Multi-Omics Integration: Unlocking Plant Natural Product Biosynthesis for Drug Discovery
This article provides a comprehensive overview of multi-omics strategies revolutionizing the study of plant natural product (PNP) biosynthesis.
Multi-Omics Integration: Unlocking Plant Natural Product Biosynthesis for Drug Discovery
Abstract
This article provides a comprehensive overview of multi-omics strategies revolutionizing the study of plant natural product (PNP) biosynthesis. Targeted at researchers and drug development professionals, it explores foundational genomic and transcriptomic discoveries, details cutting-edge methodological pipelines for pathway elucidation, addresses common analytical challenges, and evaluates validation frameworks. The synthesis offers a roadmap for accelerating the identification and sustainable production of high-value plant-derived pharmaceuticals.
Decoding the Blueprint: Genomic and Transcriptomic Foundations of Plant Natural Products
Plant Natural Products (PNPs), also known as phytochemicals or specialized metabolites, are low-molecular-weight organic compounds produced by plants that are not directly essential for basic growth and development but play crucial roles in ecological interactions and adaptation. Their immense structural diversity underpins their broad therapeutic significance, making them a cornerstone of traditional medicine and modern drug discovery.
Chemical Diversity and Major Classes
PNPs are traditionally classified based on their biosynthetic origins. The three major pathways are the shikimate/phenylpropanoid, mevalonate (MVA)/methylerythritol phosphate (MEP), and alkaloid pathways. The quantitative distribution of major PNP classes, as estimated from current plant metabolomic studies, is summarized below.
Table 1: Major Classes of Plant Natural Products and Their Prevalence
| PNP Class | Biosynthetic Origin | Estimated Number of Known Structures | Exemplary Therapeutic Activity |
|---|---|---|---|
| Terpenoids | MVA/MEP pathways | >40,000 | Artemisinin (antimalarial), Paclitaxel (anticancer) |
| Alkaloids | Various amino acids | >20,000 | Vinblastine (anticancer), Morphine (analgesic) |
| Phenolics | Shikimate/Phenylpropanoid | >10,000 | Resveratrol (cardioprotective), Curcumin (anti-inflammatory) |
| Glycosides | Often derived from above classes | >5,000 | Digoxin (cardiotonic), Salicin (anti-inflammatory) |
| Polyketides | Polyketide synthase | >2,000 | Hyperforin (antidepressant) |
Therapeutic Significance and Market Impact
PNPs and their derivatives represent a significant portion of approved drugs, particularly in oncology and infectious diseases. Their complex structures often provide unique pharmacophores not easily replicated by synthetic chemistry.
Table 2: Representative PNP-Derived Drugs and Global Market Impact (2023 Estimates)
| Drug | Origin Plant | Therapeutic Use | Global Sales (Annual, Approx.) |
|---|---|---|---|
| Paclitaxel | Taxus brevifolia (Pacific Yew) | Ovarian, breast cancer | ~$1.8 Billion |
| Artemisinin-combination therapies (ACTs) | Artemisia annua | Malaria | ~$0.5 Billion |
| Morphine/Opioid derivatives | Papaver somniferum (Opium Poppy) | Pain management | Multi-billion |
| Digoxin | Digitalis lanata (Foxglove) | Heart failure, arrhythmia | Declining, but essential |
Multi-omics Strategies in PNP Biosynthesis Research
Understanding the complex biosynthesis of PNPs requires integrating multiple "omics" layers to connect genotype to phenotype. This systems biology approach is central to modern PNP research, enabling pathway elucidation and metabolic engineering.
Key Experimental Protocols in Multi-omics Research:
Protocol 1: Metabolite Profiling via LC-MS/MS
- Objective: Comprehensively identify and quantify PNPs in a plant tissue extract.
- Methodology:
- Extraction: Homogenize 100 mg fresh plant tissue in 1 mL 80% methanol/H₂O with 0.1% formic acid at 4°C. Centrifuge (15,000 x g, 15 min).
- LC Separation: Inject supernatant onto a reverse-phase C18 column (e.g., 2.1 x 100 mm, 1.8 µm). Use a gradient from 5% to 95% acetonitrile (with 0.1% formic acid) over 20 min at 0.3 mL/min.
- MS Detection: Use a high-resolution Q-TOF or Orbitrap mass spectrometer in both positive and negative electrospray ionization (ESI) modes. Data-Dependent Acquisition (DDA) mode triggers MS/MS scans on top ions.
- Data Analysis: Process raw data with software (e.g., XCMS, MS-DIAL) for peak picking, alignment, and annotation against spectral libraries (e.g., GNPS, MassBank).
Protocol 2: Transcriptome Assembly and Differential Expression Analysis
- Objective: Identify genes co-expressed with the biosynthesis of a target PNP.
- Methodology:
- RNA-Seq: Extract total RNA from tissues of interest (e.g., high vs. low metabolite producing). Prepare stranded cDNA libraries and sequence on an Illumina platform (≥30 million 150 bp paired-end reads per sample).
- De Novo Assembly: For non-model plants, assemble clean reads into transcripts using Trinity or rnaSPAdes.
- Expression Quantification: Map reads to the assembly using Salmon to calculate Transcripts Per Million (TPM) values.
- Co-expression Analysis: Use correlation metrics (e.g., Pearson's) between gene expression profiles and metabolite abundance across samples to identify candidate biosynthetic genes.
Protocol 3: Functional Characterization via Heterologous Expression
- Objective: Validate the enzymatic function of a candidate gene.
- Methodology:
- Cloning: Amplify the candidate gene's Open Reading Frame (ORF) and clone it into a prokaryotic (e.g., pET vector) or yeast (e.g., pYES2) expression vector.
- Expression: Transform the vector into E. coli BL21(DE3) or S. cerevisiae. Induce protein expression with IPTG or galactose.
- Enzyme Assay: Incubate cell lysate or purified protein with suspected substrate(s) and co-factors (NADPH, SAM, etc.) in a suitable buffer (e.g., 50 mM Tris-HCl, pH 7.5).
- Product Analysis: Terminate the reaction with an organic solvent (e.g., ethyl acetate) and analyze the extract using LC-MS/MS or GC-MS to detect the predicted product.
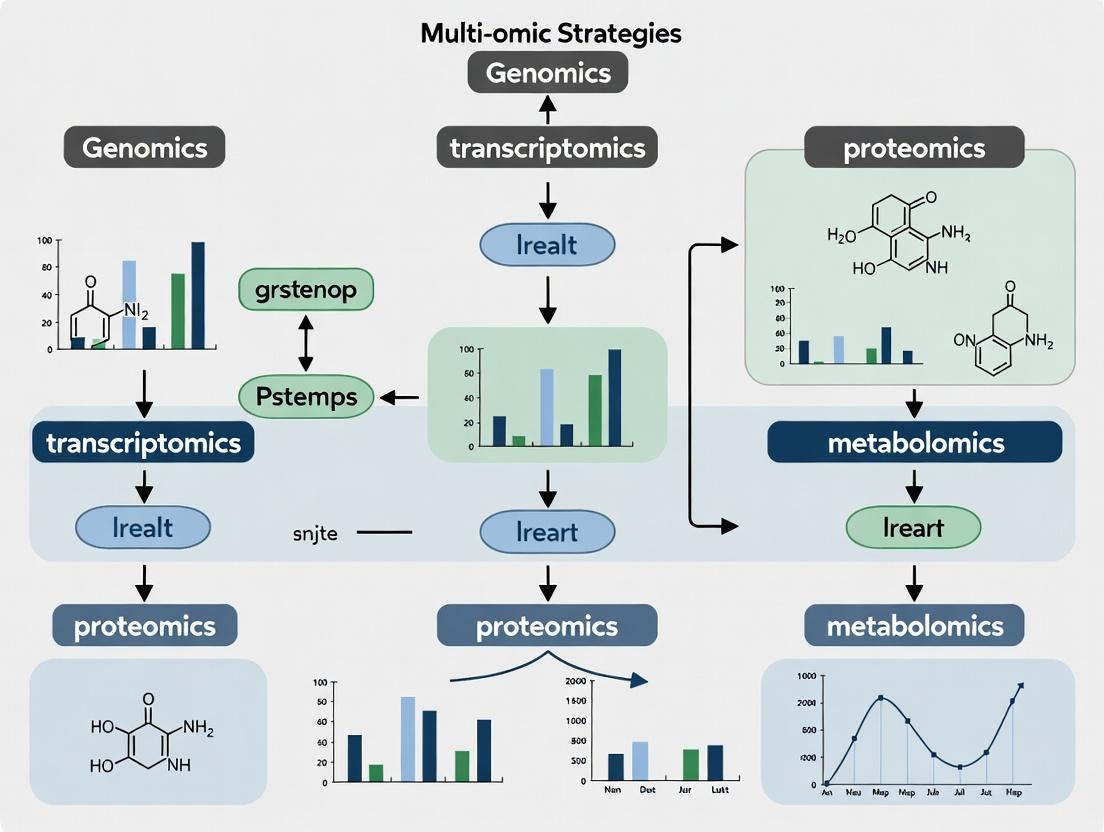
Visualizing Multi-omics Integration and Biosynthetic Pathways
Multi-omics Workflow for PNP Pathway Discovery
Core Phenylpropanoid Pathway for Phenolic PNPs
The Scientist's Toolkit: Key Research Reagent Solutions
Table 3: Essential Reagents and Kits for PNP Multi-omics Research
| Reagent/Kits | Supplier Examples | Function in PNP Research |
|---|---|---|
| Plant RNA Isolation Kits | Qiagen RNeasy, Zymo Research | High-integrity total RNA extraction from polysaccharide- and polyphenol-rich tissues for transcriptomics. |
| Metabolomics Grade Solvents | Sigma-Aldrich, Fisher Chemical | LC-MS/MS compatible methanol, acetonitrile, and water with ultra-low contaminant levels for reproducible metabolite profiling. |
| SILK (Stable Isotope Labeled Key) Intermediates | Cambridge Isotope Labs, Sigma-Aldrich | 13C- or 2H-labeled precursors (e.g., 13C6-glucose, D5-phenylalanine) for tracing metabolic flux through biosynthetic pathways. |
| Heterologous Expression Systems | Thermo Fisher (pET vectors), ATCC (Yeast Strains) | Pre-validated vectors and host cells (E. coli, S. cerevisiae) for cloning and expressing putative PNP biosynthetic genes. |
| LC-MS/MS Metabolite Libraries | IROA Technologies, Metabolon | Curated spectral libraries of known PNPs for high-confidence annotation of untargeted metabolomics data. |
| CRISPR/Cas9 Plant Editing Systems | Addgene (Vectors), ToolGen | Materials for targeted genome editing in medicinal plants to knockout genes and confirm their role in PNP biosynthesis. |
This whitepaper provides an in-depth technical guide to the four core omics technologies, framed within the thesis that integrated multi-omics strategies are essential for advancing plant natural product (PNP) biosynthesis research. The synergistic application of these technologies enables the deconvolution of complex biosynthetic pathways, facilitating the discovery and engineering of high-value compounds for drug development.
Genomics
Genomics is the study of an organism's complete set of DNA, including all genes and intergenic regions. In PNP research, it provides the blueprint for potential biosynthetic pathways.
Key Methodology: Next-Generation Sequencing (NGS)
- Protocol: High-molecular-weight genomic DNA is extracted, sheared, and size-selected. Libraries are prepared with platform-specific adapters (e.g., Illumina, PacBio, or Oxford Nanopore). For Illumina short-read sequencing, fragmented DNA undergoes end-repair, A-tailing, and adapter ligation, followed by PCR amplification and cluster generation on a flow cell. Sequencing-by-synthesis is performed. For complex plant genomes, a hybrid approach using PacBio HiFi or Oxford Nanopore long-reads for scaffolding, combined with Illumina short-reads for polishing, is standard. Assemblies are generated using tools like CANU or Flye for long-reads and SPAdes for short-reads, followed by annotation via pipelines like BRAKER2.
- Primary Application: Identification of candidate biosynthetic gene clusters (BGCs), such as those for terpenoids, alkaloids, or polyketides, by scanning for co-localized genes encoding enzymes like cytochrome P450s, acyltransferases, and transporters.
Quantitative Data: Genomics Platform Comparison
| Platform | Read Length (bp) | Throughput per Run | Accuracy | Primary Use in PNP Research |
|---|---|---|---|---|
| Illumina NovaSeq | 2x150 | Up to 6 Tb | >99.9% (Q30) | High-coverage resequencing, variant calling |
| PacBio HiFi | 15-25k | 50-100 Gb | >99.9% (Q20) | De novo assembly of complex genomes |
| Oxford Nanopore | 10k-2M+ | 10-100+ Gb | ~97-99% (Q20-30) | Real-time sequencing, detecting base modifications |
| DNBSEQ-T20 | 2x150 | Up to 18 Tb | >99.9% (Q30) | Large-scale population genomics |
Diagram: Genomics Workflow for BGC Discovery
Transcriptomics
Transcriptomics analyzes the complete set of RNA transcripts (mRNA, lncRNA, miRNA) produced by the genome under specific conditions. It is crucial for linking genomic potential to active pathway expression in PNP research.
Key Methodology: RNA-Sequencing (RNA-Seq)
- Protocol: Total RNA is extracted (ensuring high RIN >8.0). Ribosomal RNA is depleted, or mRNA is poly-A selected. The library is prepared via fragmentation, cDNA synthesis, adapter ligation, and PCR amplification. Paired-end sequencing (e.g., 2x150 bp) on an Illumina platform is typical. For differential gene expression analysis, raw reads are quality-trimmed (Trimmomatic), mapped to the reference genome (HISAT2, STAR), and assembled/quantified (StringTie, featureCounts). Differential expression is calculated (DESeq2, edgeR). Co-expression network analysis (e.g., WGCNA) identifies gene modules correlated with metabolite abundance.
- Primary Application: Identifying genes upregulated in specific tissues (e.g., roots, glands) or under elicitation (e.g., jasmonate treatment) that correlate with PNP biosynthesis.
Quantitative Data: Transcriptomics Analysis Output
| Analysis Type | Typical Metric | Tool/Algorithm | Relevance to PNP Pathways |
|---|---|---|---|
| Differential Expression | Log2 Fold Change, adj. p-value | DESeq2, edgeR | Finds genes induced with pathway activity |
| Transcript Assembly | Fragments Per Kilobase Million (FPKM) | StringTie, Cufflinks | Quantifies isoform-level expression |
| Co-expression | Pearson Correlation, Module Eigengene | WGCNA | Links unknown genes to characterized pathway genes |
| Single-Cell RNA-Seq | Unique Molecular Identifier (UMI) counts | Seurat, Scanpy | Profiles cell-type-specific expression in heterogenous tissues |
Diagram: Transcriptomics Logic for Gene Discovery
Proteomics
Proteomics is the large-scale study of the entire complement of proteins, including their structures, modifications, interactions, and abundances. It confirms the translation of transcriptomic data into functional enzymes.
Key Methodology: Liquid Chromatography-Tandem Mass Spectrometry (LC-MS/MS)
- Protocol: Proteins are extracted from plant tissue, digested with trypsin, and desalted. Peptides are separated by reversed-phase nanoLC and analyzed on a high-resolution tandem mass spectrometer (e.g., Q-Exactive, timsTOF). Data-Dependent Acquisition (DDA) or Data-Independent Acquisition (DIA; e.g., SWATH-MS) modes are used. For DDA, the top N most intense peptides are fragmented. Raw files are processed using search engines (MaxQuant, Proteome Discoverer) against a species-specific protein database. Post-translational modification (PTM) analysis requires specific enrichment steps (e.g., phosphopeptides) and search parameters.
- Primary Application: Quantifying the abundance of all enzymes in a putative PNP pathway, confirming their presence, and detecting regulatory PTMs (e.g., phosphorylation).
Quantitative Data: Proteomics MS Platform Comparison
| Instrument Type | Acquisition Mode | Resolution (at m/z 200) | Quantification Method | Key Advantage for PNP |
|---|---|---|---|---|
| Orbitrap (Q-Exactive) | DDA, DIA | 70,000 - 140,000 | Label-free (LFQ), TMT | High resolution and accuracy |
| Quadrupole-TOF (timsTOF) | DDA, DIA (PASEF) | 40,000 - 100,000 | Label-free, TMT | High sensitivity and speed |
| Triple Quadrupole (QQQ) | SRM/MRM | Unit Resolution | Absolute (SIS peptides) | Targeted, highly precise quantification |
Metabolomics
Metabolomics is the comprehensive profiling of small-molecule metabolites (typically <1500 Da) within a biological system. It provides the functional readout of cellular activity and is the direct measurement of PNP output.
Key Methodology: Untargeted Metabolomics via LC-MS
- Protocol: Metabolites are extracted using a solvent system like methanol:water (80:20). Samples are analyzed in both positive and negative ionization modes on a high-resolution mass spectrometer (e.g., UHPLC-Q-TOF). Chromatographic separation (e.g., C18 column) is critical. Data is acquired in full-scan MS mode (m/z 50-1500). Raw data is processed for feature detection, alignment, and annotation using software (XCMS, MS-DIAL, GNPS). Annotation relies on matching m/z, MS/MS fragmentation patterns, and retention times to authentic standards or public libraries (MassBank, GNPS).
- Primary Application: Discovering novel PNPs, monitoring changes in metabolite profiles in response to genetic or environmental perturbations, and identifying the final products of engineered pathways.
Quantitative Data: Metabolomics Analysis Metrics
| Analysis Stage | Key Parameters | Common Tools | Purpose in PNP Research |
|---|---|---|---|
| Feature Detection | m/z, Retention Time, Intensity | XCMS, MZmine | Detects all ion signals |
| Statistical Analysis | VIP Score (PLS-DA), p-value (t-test) | MetaboAnalyst, SIMCA | Finds biomarkers differentiating sample groups |
| Annotation | MS/MS Spectral Match, m/z Error | GNPS, Sirius | Identifies known and predicts structures of unknowns |
| Pathway Mapping | KEGG, PlantCyc Pathways | KEGG Mapper, PlantSEED | Puts metabolites in biological context |
Diagram: Multi-omics Integration for PNP Pathways
The Scientist's Toolkit: Key Research Reagent Solutions
| Item | Function in Multi-omics PNP Research |
|---|---|
| Methyl Jasmonate | A potent phytohormone elicitor used to upregulate defense-related secondary metabolite pathways for transcriptomic/proteomic/metabolomic comparisons. |
| TriReagent/MiRNeasy Kit | For simultaneous extraction of high-quality RNA, DNA, and protein from a single plant sample, crucial for integrative analysis. |
| Ribo-Zero rRNA Removal Kit | Efficiently depletes abundant ribosomal RNA from total RNA samples, enriching for mRNA and non-coding RNA, improving RNA-seq coverage of lowly expressed biosynthetic genes. |
| Trypsin, Sequencing Grade | The gold-standard protease for bottom-up proteomics, generating peptides suitable for LC-MS/MS analysis to identify and quantify pathway enzymes. |
| Stable Isotope Labeled Standards (e.g., 13C-Glucose) | Used in tracer experiments for flux analysis, determining the flow of carbon through biosynthetic networks. |
| C18 Solid-Phase Extraction (SPE) Columns | For clean-up and pre-concentration of complex plant metabolite extracts prior to LC-MS analysis, reducing ion suppression. |
| Authentic Chemical Standards | Pure compounds for targeted metabolomics, essential for constructing calibration curves for absolute quantification and validating MS/MS spectral libraries. |
| Polyethylene Glycol (PEG)-mediated Protoplast Transformation Kit | For transient gene expression in plant cells to validate the function of candidate genes identified from omics analyses. |
Mining Plant Genomes for Biosynthetic Gene Clusters (BGCs) and Key Enzyme Families (e.g., CYPs, UGTs)
The discovery and elucidation of plant natural product (PNP) biosynthetic pathways are central to pharmaceutical and agricultural biotechnology. Within the framework of a multi-omics strategy—integrating genomics, transcriptomics, metabolomics, and proteomics—the systematic mining of plant genomes forms the foundational genomic layer. This guide details the computational and experimental methodologies for identifying Biosynthetic Gene Clusters (BGCs) and characterizing key enzyme families like Cytochrome P450s (CYPs) and UDP-glycosyltransferases (UGTs), which are pivotal for the structural diversification and bioactivity of PNPs.
Computational Mining for BGCs and Enzyme Families
Genome Assembly & Annotation Pipeline
A high-quality, chromosome-scale genome assembly is prerequisite. Use long-read sequencing (PacBio, Oxford Nanopore) coupled with Hi-C chromatin mapping. Annotation employs a combined evidence approach: ab initio gene prediction (e.g., BRAKER2), protein homology (e.g., DIAMOND against UniProt/Swiss-Prot), and transcriptome evidence (RNA-seq).
Table 1: Benchmark Data for Genome Assembly Tools (Model Plant: Nicotiana benthamiana)
| Tool/Pipeline | N50 (Mb) | BUSCO Completeness (%) | Computational Time (CPU hours) | Primary Use Case |
|---|---|---|---|---|
| Canu (v2.0) | 12.5 | 98.2 | 1200 | Initial long-read assembly |
| HiFiasm (v0.19) | 45.8 | 99.1 | 450 | HiFi read assembly |
| Juicer/3D-DNA | Scaffold to Chromosome | N/A | 200 | Hi-C scaffolding |
| BRAKER2 | N/A | 96.7 (Gene Set) | 300 | Genome annotation |
BGC Prediction Tools & Workflow
PlantiSMASH is the dedicated algorithm for plant BGC detection, identifying co-localized genes encoding hallmark biosynthetic enzymes (e.g., terpene synthases (TPS), polyketide synthases (PKS), non-ribosomal peptide synthetases (NRPS), and tailoring enzymes).
Protocol 1: Running PlantiSMASH
- Input: Genome in GenBank or FASTA format with corresponding GFF3 annotation file.
- Command:
antismash --genefinding-gff3 <annotation.gff3> --taxon plants <genome.fasta> - Parameters: Enable
--clusterhmmerfor Pfam domain analysis and--asffor active site Finder. - Output: Interactive HTML page detailing cluster regions, gene functions, and known cluster comparisons.
Table 2: BGC Prediction Output Metrics for Echinacea purpurea Genome
| Cluster # | Type (Most Likely) | Size (kb) | Core Genes | Key Tailoring Enzymes | Similar Known Cluster (MIBiG) |
|---|---|---|---|---|---|
| 1 | Terpene | 85 | TPS (2) | CYP76AH1-like, UGT90A1-like | Triterpene (Beta-amyrin) |
| 2 | Alkamide | 120 | PKS (Type III) | CYP79A-like, UGT85A-like | N-Isobutylamide |
| 3 | Flavonoid | 45 | CHS, CHI | CYP75B1 (F3'H), UGT78D2 | Anthocyanin |
Identification of Key Enzyme Families (CYPs, UGTs)
CYPs: Identify using HMM profiles (PF00067, PF06588) from Pfam database via hmmsearch. Clan assignment and family/subfamily classification follow David Nelson's system (e.g., CYP71, CYP72).
UGTs: Identify using PF00201 (UDPGT) HMM profile. Phylogenetic analysis with known UGTs (from Plant UGT Repository) determines family (e.g., UGT71, UGT73).
Protocol 2: HMM-based Enzyme Identification
- Prepare HMM: Download PFAM profiles for target enzyme family.
- Search:
hmmsearch --cpu 8 --tblout <output.table> <Pfam.hmm> <proteome.fasta> - Filter: Parse results with E-value cutoff < 1e-10 and coverage > 60%.
- Classify: Align hits to reference sequences (e.g., from Cytochrome P450 Engineering Database or UGT Nomenclature Committee) using MAFFT and construct a maximum-likelihood phylogeny (IQ-TREE).
Experimental Validation and Characterization
Multi-omics Guided Gene Prioritization
Correlate genomic BGC/Enzyme data with transcriptomic (RNA-seq across tissues/elicitations) and metabolomic (LC-MS/MS) data to prioritize targets.
Protocol 3: Correlation Network Analysis
- Data: Gene expression matrix (TPM values) and peak intensity matrix of putative metabolites.
- Tool: Use
WGCNA(Weighted Gene Co-expression Network Analysis) R package orCytoscapewith Omics Integrator. - Process: Construct co-expression networks, identify modules highly correlated with metabolite abundance. Genes within a BGC co-expressed and correlating with a specific metabolite are high-priority candidates.
Heterologous Expression & Enzyme Assays
The gold standard for functional characterization.
Protocol 4: In vitro CYP Activity Assay
- Cloning: Codon-optimize CYP gene, clone into pYES2/CT or pET expression vector (with N-terminal modification for yeast/bacteria).
- Expression: Express in Saccharomyces cerevisiae WAT11 (engineered with Arabidopsis ATR1 reductase) or insect cells.
- Microsome Preparation: Lyse cells, centrifuge at 10,000g, then ultracentrifugate supernatant at 100,000g to pellet microsomes.
- Assay: In 100 µL reaction: 50 mM phosphate buffer (pH 7.4), 1 mg/mL microsomal protein, 50 µM substrate, 1 mM NADPH. Incubate 30 min at 30°C.
- Analysis: Stop with equal volume MeCN, centrifuge, analyze supernatant by LC-MS/MS. Monitor for mass shift corresponding to expected oxidation (e.g., +O, -2H).
Protocol 5: In vivo Validation in Transient Plant System
- Vector: Clone candidate BGC genes (core + tailoring) into modular expression vectors (e.g., pEAQ-HT or pCambia).
- Infiltration: Transform Agrobacterium tumefaciens strain GV3101, mix cultures, infiltrate into N. benthamiana leaves.
- Harvest: Sample leaf tissue 5-7 days post-infiltration.
- Metabolite Extraction & Analysis: Extract with 80% MeOH/H₂O, analyze by UPLC-QTOF-MS. Compare chromatograms to controls (empty vector, single genes).
Visualization of Workflows and Relationships
Multi-omics BGC Discovery and Validation Workflow
Key Enzyme Roles in PNP Diversification
The Scientist's Toolkit: Research Reagent Solutions
Table 3: Essential Reagents and Materials for BGC Mining & Validation
| Item | Function/Benefit | Example Product/Supplier |
|---|---|---|
| High Molecular Weight DNA Kit | Isolation of ultra-pure DNA for long-read sequencing, minimizing shearing. | MagAttract HMW DNA Kit (Qiagen) |
| PacBio HiFi Read Chemistry | Generates highly accurate long reads (>10 kb) essential for complex genome and BGC assembly. | SMRTbell Prep Kit 3.0 (PacBio) |
| PlantiSMASH Software | Specialized algorithm for detecting plant-specific BGC architectures. | https://plantismash.secondarymetabolites.org/ |
| Cytochrome P450 Engineered Yeast | Heterologous host optimized for functional expression of plant CYPs with native redox partners. | S. cerevisiae WAT11 strain (VTT Culture Collection) |
| UGT Assay Substrate Kit | Provides a range of acceptor molecules (flavonoids, terpenes) and UDP-sugars for UGT activity screening. | UGlycS Screening Kit (BioCat) |
| Transient Expression Vector System | High-yield, modular system for Agrobacterium-mediated co-expression of multiple genes in N. benthamiana. | pEAQ-HT vector system (John Innes Centre) |
| LC-MS/MS Grade Solvents | Essential for reproducible, high-sensitivity metabolomic profiling of novel compounds. | Optima LC/MS grade solvents (Fisher Chemical) |
| NADPH Regeneration System | Sustains CYP reactions in vitro by continuously supplying the essential cofactor NADPH. | NADPH Regenerating System (Promega, Corning) |
Within the broader thesis of employing multi-omics strategies for plant natural product (PNP) biosynthesis research, transcriptomic analysis serves as the pivotal link between genomic potential and metabolic phenotype. This guide details the computational and experimental methodologies for identifying condition-specific gene expression within the biosynthetic pathways of pharmacologically active PNPs. By profiling transcriptomes under varied elicitation conditions—such as biotic/abiotic stress, phytohormone treatment, or developmental staging—researchers can pinpoint the precise regulatory nodes and enzymatic steps that gatekeep the biosynthesis of target compounds.
Core Experimental Design & Data Acquisition
A robust experimental design is fundamental for generating meaningful transcriptomic data.
- Methyl Jasmonate (MeJA) Treatment: Hydroponic or in-vitro cultures are treated with 100 µM MeJA. Tissue is harvested at 0, 6, 12, 24, 48, and 72 hours post-elicitation. A mock treatment control (e.g., ethanol solvent) is mandatory.
- UV-B Exposure: Plantlets are exposed to UV-B radiation (wavelength 280-315 nm) at an intensity of 2.5 W m⁻² for durations of 15, 30, and 60 minutes. Harvest occurs immediately and at 24 hours post-exposure.
- Wounding/Mimicked Herbivory: Mechanical wounding with a sterile pattern or application of 1 mM insect oral secretions (e.g., Manduca sexta regurgitant) to leaf surfaces. Sampling occurs at 1, 3, 6, and 12 hours.
RNA-Seq Workflow
Total RNA is extracted using a silica-membrane-based kit with on-column DNase I digestion. Library preparation utilizes strand-specific, poly-A selection protocols. Sequencing is performed on an Illumina platform to a minimum depth of 30 million paired-end (150 bp) reads per biological replicate (n≥3).
Diagram 1: RNA-Seq workflow for PNP pathway analysis.
Bioinformatic Analysis for Condition-Specific Expression
Differential Expression Analysis
Processed read counts are analyzed using DESeq2 (Love et al., 2014). Genes with an adjusted p-value (padj) < 0.05 and an absolute log2 fold change > 2 are considered differentially expressed (DE). Condition-specificity is determined by comparing DE gene sets across multiple treatments.
Table 1: Example DE Gene Statistics from a Simulated MeJA vs. Control Experiment
| Gene ID | Base Mean (Expression) | log2FoldChange (MeJA/Control) | padj | Annotation (Putative) |
|---|---|---|---|---|
| Contig_12345 | 1250.6 | 5.8 | 2.1E-12 | Geranylgeranyl diphosphate synthase |
| Contig_67890 | 892.3 | 4.2 | 1.8E-09 | Cytochrome P450 (CYP71 clan) |
| Contig_11223 | 456.7 | -3.1 | 4.5E-06 | Photosystem I subunit |
| Contig_44556 | 78.9 | 0.5 | 0.32 | Actin depolymerizing factor |
Pathway-Centric Visualization & Enrichment
DE genes are mapped onto PNP pathways (e.g., terpenoid, phenylpropanoid, alkaloid) using KEGG or custom annotations. Pathway topology analysis (e.g., via Pathview) reveals activated branches.
Diagram 2: Condition-specific regulation in terpenoid precursor pathways.
The Scientist's Toolkit: Essential Research Reagent Solutions
Table 2: Key Reagents & Tools for Transcriptomic Analysis of PNP Pathways
| Item | Function & Rationale |
|---|---|
| Polymerase Chain Reaction (PCR) Kits | Amplification of specific gene sequences for cloning, validation, and transgenic research. Essential for verifying transcriptomic findings at the DNA level. |
| cDNA Synthesis Kits | Convert RNA into complementary DNA (cDNA) for downstream applications like quantitative PCR (qPCR), enabling validation of RNA-Seq results. |
| Quantitative PCR (qPCR) Assays | Gold standard for targeted validation of differential gene expression. Provides high sensitivity and absolute quantification of specific transcripts. |
| RNA Extraction Kits | Isolate high-quality, intact total RNA from complex plant tissues, which is critical for accurate transcriptome sequencing. |
| Next-Generation Sequencing (NGS) Library Prep Kits | Prepare RNA libraries for sequencing on platforms like Illumina, enabling genome-wide expression profiling. |
| Bioinformatics Software (e.g., CLC Genomics Workbench, Geneious) | User-friendly platforms for analyzing NGS data, performing differential expression, and visualizing pathways without extensive command-line expertise. |
| Reference Genome Databases (e.g., Phytozome, NCBI) | Provide annotated genomic sequences for read alignment and gene functional annotation, forming the basis for transcriptomic interpretation. |
Validation & Integration: From Transcript to Product
qPCR Validation Protocol
- Primer Design: Design exon-spanning primers (amplicon 80-150 bp) for 5-10 top DE candidate genes and 2 reference genes (e.g., EF1α, UBQ).
- Reverse Transcription: Use 1 µg total RNA and oligo(dT) primers for cDNA synthesis.
- Reaction Setup: Perform triplicate 20 µL reactions containing 1X SYBR Green master mix, 200 nM primers, and 50 ng cDNA template.
- Thermocycling: 95°C for 3 min; 40 cycles of 95°C for 15 sec, 60°C for 30 sec; followed by melt curve analysis.
- Analysis: Calculate ∆∆Ct values. Confirm correlation with RNA-Seq fold-changes (R² > 0.85 expected).
Multi-Omics Correlation
Integrate transcriptomic data with:
- Metabolomic Data (LC-MS): Correlate expression of pathway genes with accumulation of downstream PNP metabolites (e.g., Pearson correlation > 0.7).
- Proteomic Data: Confirm translation of upregulated transcripts into functional enzymes.
Table 3: Multi-Omics Correlation Data for a Hypothetical Terpenoid Pathway
| Gene/Enzyme (Transcript ID) | log2FC (Transcript) | Protein Abundance Change (log2FC) | Metabolite Accumulation (Fold Change) |
|---|---|---|---|
| DXS (Contig_3344) | +3.5 | +1.8 | Precursor IPP: +2.1x |
| TPS2 (Contig_5567) | +6.1 | +3.2 | Product Limonene: +25.3x |
| CYP450 (Contig_8890) | +4.8 | +2.1 | Oxidated Product: +12.7x |
Transcriptomics provides an indispensable, dynamic map of the regulatory landscape governing PNP biosynthesis. When systematically applied within a multi-omics framework—correlating gene expression with protein and metabolite profiles—it transforms the identification of condition-specific pathway genes from inference into a robust, actionable discovery process. This approach directly accelerates the engineering of plant metabolic systems for enhanced production of valuable pharmaceuticals.
This whitepaper, framed within the broader thesis of Multi-omics strategies for plant natural product biosynthesis research, details the foundational omics-driven pipeline for elucidating biosynthetic pathways of high-value alkaloids and terpenoids. It provides a technical guide for de novo pathway discovery, integrating cutting-edge genomic, transcriptomic, metabolomic, and proteomic approaches.
Plant alkaloids (e.g., vinblastine, morphine) and terpenoids (e.g., artemisinin, paclitaxel) constitute a rich source of pharmaceuticals. Their biosynthetic pathways are often complex, involving multiple enzymes and compartmentalized steps. Traditional discovery methods are slow and labor-intensive. Foundational multi-omics provides a systematic, high-throughput framework for gene cluster identification, enzyme characterization, and pathway reconstruction.
Foundational Omics Workflow
The core discovery pipeline follows an iterative cycle of data generation, integration, and functional validation.
Diagram 1: Foundational Multi-Omics Discovery Workflow (100 chars)
Key Experimental Protocols & Data
Genome Sequencing and Assembly for Gene Cluster Discovery
Objective: Generate a high-quality reference genome to identify contiguous biosynthetic gene clusters (BGCs). Protocol:
- DNA Extraction: Use a CTAB-based method with high-molecular-weight DNA preservation (e.g., Qiagen Genomic-tip).
- Library Preparation & Sequencing:
- Long-Read: Pacific Biosciences (PacBio) HiFi or Oxford Nanopore Technologies (ONT) Ultra-Long sequencing for scaffolding.
- Short-Read: Illumina NovaSeq 6000 (PE150) for polishing.
- Assembly & Annotation: Assemble with
hifiasm(PacBio) orFlye(ONT). Polish withNextPolishusing Illumina data. Annotate usingfunannotatepipeline, integrating protein homology (UniProt), ab initio prediction, and RNA-Seq evidence.
Quantitative Data: Table 1 summarizes benchmark data for a typical high-quality plant genome project relevant for BGC discovery.
Table 1: Genomic Sequencing & Assembly Metrics
| Metric | Target Value | Typical Output for Catharanthus roseus |
|---|---|---|
| Sequencing Depth (Illumina) | >100x | 120x |
| HiFi Read N50 | >15 kb | 18 kb |
| Assembly Size | Species-specific | ~1.5 Gb |
| Contig N50 | >1 Mb | 2.3 Mb |
| BUSCO Completeness | >95% | 98.2% |
| Predicted Genes | - | ~35,000 |
| Identified Putative BGCs | - | 45-70 |
Multi-Condition Transcriptomics for Candidate Gene Prioritization
Objective: Correlate gene expression with metabolite abundance across tissues, treatments, and time series. Protocol:
- Sample Design: Collect replicates from high- vs. low-producing tissues (e.g., root vs. leaf), elicitor-treated (e.g., methyl jasmonate) vs. control, and developmental time courses.
- RNA-Seq: Total RNA extraction (RNeasy Plant Mini Kit), rRNA depletion, Illumina stranded mRNA library prep, sequencing on NovaSeq 6000 (30-50 million paired-end reads per sample).
- Analysis: Map reads to reference genome with
HISAT2. Assemble transcripts and quantify expression withStringTie. Perform differential expression analysis withDESeq2. Calculate correlation (Pearson/Spearman) between gene TPM and metabolite peak intensity.
Untargeted Metabolomics for Chemo-Phenotyping
Objective: Profile the full complement of alkaloids/terpenoids and identify key accumulating compounds. Protocol:
- Extraction: Freeze-dry tissue, homogenize, extract with 70% methanol/water containing internal standards (e.g., deuterated analogs).
- LC-MS/MS Analysis:
- System: UHPLC (HSS T3 column) coupled to Q-TOF or Orbitrap mass spectrometer.
- Conditions: Gradient elution (water/acetonitrile + 0.1% formic acid). Data acquired in both positive and negative ionization modes, with data-dependent acquisition (DDA) for MS/MS.
- Data Processing: Use software like
MS-DIALorXCMSfor peak picking, alignment, and annotation against databases (GNPS, MassBank, in-house libraries).
Quantitative Data: Table 2 shows typical metabolomics output correlating with transcriptomic data.
Table 2: Metabolomics-Transcriptomics Correlation Data
| Metabolite (Class) | Fold Change (Root/Leaf) | Number of Correlated Transcripts (r>0.9) | Top Correlated Enzyme Family |
|---|---|---|---|
| Ajmalicine (Alkaloid) | 150x | 12 | Strictosidine synthase-like (SSL) |
| Catharanthine (Alkaloid) | 85x | 8 | Secologanin synthase (CYP72A) |
| Artemisinin (Terpenoid) | 200x (Gland/Leaf) | 15 | Amorpha-4,11-diene synthase (ADS) |
| Taxadiene (Terpenoid) | 50x (Bark/Cell Culture) | 10 | Taxadiene synthase (TS) |
Pathway Elucidation and Validation Workflow
Integrated omics data feeds into a hypothesis-driven validation pipeline.
Diagram 2: Candidate Gene Validation Logic Flow (100 chars)
The Scientist's Toolkit: Research Reagent Solutions
Table 3: Essential Reagents and Kits for Foundational Omics Experiments
| Item/Category | Example Product | Function in Workflow |
|---|---|---|
| High-Quality DNA Extraction | Qiagen Genomic-tip 100/G | Purifies HMW DNA for long-read sequencing; critical for contiguous assembly of BGCs. |
| Stranded RNA Library Prep | Illumina Stranded mRNA Prep | Preserves strand information for accurate transcript quantification and novel isoform detection. |
| Metabolomics Internal Standards | deuterated vinblastine, d6-artemisinin | Enables relative quantification and corrects for ionization efficiency variations in LC-MS. |
| Heterologous Expression Host | Saccharomyces cerevisiae strain EPY300 | Optimized yeast chassis for functional expression of plant cytochrome P450s and transporters. |
| Golden Gate Assembly Kit | MoClo Toolkit (Plant Parts) | Modular, efficient cloning system for assembling multiple gene constructs for pathway reconstitution. |
| LC-MS Grade Solvents | Fisher Chemical Optima LC/MS | Ensures minimal background noise and ion suppression for sensitive metabolomics detection. |
| CYP450 Redox Partners | Arabidopsis ATR2 / Sorghum SOR redox kits | Provides plant-specific cytochrome P450 reductase for in vitro enzyme activity assays. |
| Elicitors for Induction | Methyl jasmonate, Yeast extract | Used in treatment experiments to upregulate defense-related BGCs for transcriptomic analysis. |
From Data to Pathways: Integrative Multi-Omics Pipelines for Biosynthetic Elucidation
Within the framework of a broader thesis on multi-omics strategies for plant natural product (PNP) biosynthesis research, the integration of sequencing (genomics, transcriptomics) and spectral (metabolomics, proteomics) data is paramount. This technical guide outlines a strategic workflow to derive mechanistic insights into biosynthetic pathways, crucial for researchers and drug development professionals aiming to harness plant biochemistry.
Foundational Omics Layers & Quantitative Landscape
A successful integration begins with understanding the individual omics layers. The following table summarizes core datasets, their quantitative outputs, and primary platforms.
Table 1: Core Omics Datasets in Plant Natural Product Research
| Omics Layer | Primary Data Type | Typical Output Metrics | Common Platform/Technology |
|---|---|---|---|
| Genomics | DNA Sequences | Genome coverage (e.g., 50x), Contig N50 (e.g., 1.2 Mb), Predicted gene count | PacBio HiFi, Oxford Nanopore, Illumina |
| Transcriptomics | RNA-Seq Reads | Reads per sample (e.g., 30M), Differentially Expressed Genes (DEGs), TPM/FPKM values | Illumina (short-read), Iso-Seq (long-read) |
| Proteomics | LC-MS/MS Spectra | Peptide Spectrum Matches (PSMs), Protein abundance (e.g., LFQ intensity), PTM identifications | Q-Exactive HF, timsTOF |
| Metabolomics | LC/GC-MS Spectra | Peak counts (e.g., 5,000/sample), m/z, retention time, fragmentation (MS2) spectra | Q-TOF, Orbitrap, GC-MS |
Strategic Integration Workflow
The integration is not linear but iterative, involving parallel processing and constant feedback between layers.
Experimental Protocols for Key Steps
Protocol A: Plant Tissue Multi-Omics Sampling
- Material: Liquid N₂, RNAlater, protease/phosphatase inhibitors, lyophilizer.
- Method: Flash-freeze harvested plant tissue (e.g., root, leaf) in liquid N₂. Precisely subdivide frozen tissue under N₂. One aliquot is homogenized for RNA/DNA extraction. A separate aliquot is lyophilized, then pulverized for metabolite extraction in 80% methanol. A third aliquot is ground in a protein extraction buffer with inhibitors for proteomics.
Protocol B: Linked RNA-Seq and Metabolite Profiling Analysis
- Method: 1) Perform RNA-Seq (Illumina, 150bp PE). Map reads to reference genome/transcriptome using
HISAT2orSTAR. 2) Identify DEGs usingDESeq2(adj. p-value <0.05, log2FC >1). 3) In parallel, process LC-MS raw data (.raw,.d) withMS-DIALorXCMSfor peak picking, alignment, and compound annotation via GNPS or in-house libraries. 4) Correlate metabolite abundance (peak area) with gene expression (TPM) of nearby biosynthetic genes usingWGCNAormixOmicsR packages.
Protocol C: Proteogenomic Validation of Enzyme Candidates
- Method: 1) Generate a custom protein database from the sequenced genome/transcriptome (6-frame translation). 2) Analyze LC-MS/MS proteomics data (tryptic digest) using
MaxQuantorFragPipeagainst the custom database. 3) Filter for high-confidence matches (FDR <1%). 4) Overlap identified peptides with predicted proteins from genomic candidate biosynthetic gene clusters (BGCs) to confirm translation.
Integrated Data Analysis Workflow Diagram
Diagram Title: Multi-omics Integration Workflow for PNP Research
Biosynthetic Pathway Inference Logic
Diagram Title: Evidence Integration for Pathway Inference
The Scientist's Toolkit: Essential Research Reagents & Materials
Table 2: Key Research Reagent Solutions for Multi-Omics Experiments
| Item | Function/Application | Example Product/Brand |
|---|---|---|
| TriZol/RNAzol RT | Simultaneous isolation of RNA, DNA, and protein from a single sample. Critical for minimizing biological variation between omics layers. | Sigma-Aldrich, Molecular Research Center |
| Methyl tert-Butyl Ether (MTBE) | Lipid-phase metabolite extraction solvent. Provides broad coverage of polar and non-polar metabolites for LC-MS. | Honeywell, Sigma-Aldrich |
| Protease & Phosphatase Inhibitor Cocktails | Added to protein extraction buffers to prevent degradation and preserve post-translational modification states. | Roche cOmplete, Halt (Thermo Fisher) |
| TMT/Isobaric Tags | Multiplexing reagents for quantitative proteomics, allowing parallel analysis of up to 18 samples in one LC-MS/MS run. | TMTpro (Thermo Fisher) |
| DNase I, RNase-free | Essential for removing genomic DNA contamination during RNA preparation for sequencing. | Qiagen, New England Biolabs |
| Sera-Mag Oligo(dT) Beads | For mRNA enrichment in transcriptomics workflows using Illumina platforms. | Cytiva |
| Internal Standard Mix (Metabolomics) | A mix of stable isotope-labeled compounds for retention time alignment and semi-quantitation in metabolomics. | MSK-CAFC-1 (Cambridge Isotope Labs) |
| Trypsin/Lys-C, Mass Spec Grade | Protease for specific digestion of proteins into peptides for bottom-up proteomics. | Promega |
| SP3 Bead-Based Cleanup Kits | For clean-up and preparation of nucleic acids or proteins, minimizing sample loss. | SpeedBeads (Cytiva), commercial SP3 kits |
Within the broader thesis on Multi-omics strategies for plant natural product biosynthesis research, integrating transcriptomics and metabolomics is paramount. This guide details the technical methodology for performing a correlative analysis to link gene co-expression networks with metabolite profiles. The goal is to identify candidate genes involved in the biosynthesis of valuable plant natural products, such as alkaloids or terpenoids, by finding statistically robust associations between modules of co-expressed genes and clusters of correlated metabolites.
Foundational Concepts
Gene Co-expression Networks (GCNs)
A Gene Co-expression Network is constructed from transcriptomic data (e.g., RNA-Seq from multiple samples/treatments/tissues). Genes with similar expression patterns across samples are grouped into modules, suggesting co-regulation or functional relatedness.
Metabolite Profiles
Metabolomic data, typically from LC-MS or GC-MS platforms, provides relative or absolute abundances of metabolites. Like genes, metabolites can be clustered based on abundance correlations across the same sample set.
Correlation and Integration
The core integrative step involves calculating correlations between the eigengene (first principal component, representing module expression) of each gene module and the abundance of each metabolite, or the eigenmetabolite of metabolite clusters.
Detailed Experimental & Computational Protocol
Sample Preparation and Data Generation
Protocol 1: Multi-omics Sample Collection for Plant Tissues
- Plant Material: Grow plants under controlled conditions. Harvest tissues (e.g., root, leaf, glandular trichomes) of interest across multiple biological replicates (n ≥ 5) and developmental stages or elicitation time points.
- Transcriptomics Sample Prep: Flash-freeze tissue in liquid N₂. Extract total RNA using a kit with DNase treatment (e.g., Qiagen RNeasy Plant Mini Kit). Assess RNA integrity (RIN > 8.0). Prepare libraries for Illumina RNA-Seq.
- Metabolomics Sample Prep: From the same tissue aliquot, extract metabolites using a methanol:water:chloroform solvent system. Derivatize for GC-MS or inject directly for LC-MS (reverse phase and HILIC recommended).
Protocol 2: RNA-Seq Data Processing & Normalization
- Alignment & Quantification: Use
HISAT2orSTARto align reads to the reference genome. Generate gene-level read counts withfeatureCounts. - Normalization: Perform TPM (Transcripts Per Million) or FPKM normalization. For co-expression analysis, a variance-stabilizing transformation (e.g., using
DESeq2'svstfunction) is often applied. - Filtering: Remove lowly expressed genes (e.g., those with counts < 10 in >90% of samples).
Protocol 3: Metabolomics Data Pre-processing
- Peak Picking & Alignment: Use XCMS (for LC-MS) or AMDIS (for GC-MS) for peak detection, alignment, and gap filling.
- Annotation: Annotate peaks using in-house spectral libraries or public databases (e.g., GNPS, MassBank). Use retention index (GC-MS) or retention time (LC-MS) for confidence.
- Normalization: Apply internal standard normalization, followed by sample median normalization and Pareto scaling for multivariate analysis.
Core Integrative Analysis Workflow
Protocol 4: Constructing a Weighted Gene Co-expression Network (WGCNA)
- Soft-Thresholding: Choose a soft power (β) that ensures a scale-free network topology (scale-free topology fit index R² > 0.85). Typical powers for plant data range from 12 to 20.
- Network Construction & Module Detection: Calculate the adjacency matrix, then the Topological Overlap Matrix (TOM). Perform hierarchical clustering on the TOM-based dissimilarity. Dynamic tree cut is used to identify gene modules. Modules are labeled by colors (e.g., MEblue, MEturquoise).
- Eigengene Calculation: For each module, calculate the module eigengene (ME) as the first principal component of the module's expression matrix.
Protocol 5: Integrating Metabolite Profiles
- Metabolite Correlation Clustering: Perform hierarchical clustering on the Pearson correlation matrix of metabolite abundances to identify metabolite clusters.
- Module-Trait Correlation: Calculate Pearson or Spearman correlations between each gene module's eigengene (ME) and each metabolite's abundance or each metabolite cluster's eigenmetabolite.
- Statistical Assessment: Calculate p-values and adjust for multiple testing (Benjamini-Hochberg FDR). |Correlation| > 0.7 and FDR < 0.05 are considered strong associations.
- Visualization: Generate heatmaps of module-metabolite correlation matrices.
Downstream Validation & Interpretation
Protocol 6: Candidate Gene Identification & Functional Enrichment
- Intramodular Analysis: For a module of interest highly correlated with a target natural product, calculate the module membership (MM, correlation of a gene's expression with the module eigengene) and the gene significance (GS, correlation of the gene's expression with the metabolite abundance). Prioritize genes with high |MM| and |GS|.
- Enrichment Analysis: Perform GO (Gene Ontology) or KEGG pathway enrichment analysis on the module genes using tools like
clusterProfiler. - Phylogenetic Analysis: For biosynthetic gene candidates (e.g., CYPs, UGTs), perform phylogenetic analysis with known enzymes from other species.
Protocol 7: Experimental Validation via Heterologous Expression
- Cloning: Clone candidate gene ORFs into an appropriate expression vector (e.g., pYES2 for yeast, pEAQ-HT for Nicotiana benthamiana).
- Metabolite Feeding & Analysis: Express the gene in the heterologous system with and without presumed substrate feeding. Extract and analyze metabolites via targeted LC-MS/MS.
- Enzyme Assay: Express and purify recombinant protein for in vitro enzyme kinetic assays.
Data Presentation
Table 1: Key Metrics from a Representative Study Linking GCNs to Terpenoid Profiles in Salvia miltiorrhiza
| Analysis Stage | Parameter | Value | Interpretation | ||
|---|---|---|---|---|---|
| Transcriptomics | Total Genes After Filtering | 25,342 | High-quality gene set for network build. | ||
| WGCNA | Soft Threshold Power (β) | 18 | Achieved scale-free topology (R²=0.89). | ||
| WGCNA | Number of Gene Modules | 32 | Distinct co-expression patterns identified. | ||
| Metabolomics | Annotated Metabolites | 187 | Focus on diterpenoids and phenolic acids. | ||
| Integration | Significant Module-Metabolite Correlations (FDR<0.05) | 45 | Strong statistical evidence for linkages. | ||
| Integration | Highest Observed | r | (CYP76AH1 vs. Tanshinone IIA) | 0.92 | Near-perfect correlation, suggesting direct role. |
| Validation | In vitro Enzyme Activity (CYP76AH1) | kcat = 4.2 s⁻¹ | Confirmed catalytic function. |
Table 2: Research Reagent Solutions Toolkit
| Item | Supplier Examples | Function in Analysis |
|---|---|---|
| RNA Extraction Kit (Plant) | Qiagen RNeasy Plant Mini Kit, Norgen Total RNA Purification Kit | High-integrity RNA isolation for transcriptomics. |
| GC-MS Derivatization Reagents | MilliporeSigma (MSTFA, Methoxyamine hydrochloride) | Chemical modification of metabolites for volatile GC-MS analysis. |
| LC-MS Grade Solvents | Fisher Optima, Honeywell Burdick & Jackson | Low impurity solvents for sensitive MS detection. |
| Internal Standards (IS) | Cambridge Isotope Labs (¹³C, ²H-labeled compounds), MilliporeSigma | For metabolite quantification and normalization. |
| WGCNA R Package | CRAN (https://cran.r-project.org/package=WGCNA) | Primary computational tool for network construction. |
| XCMS Online / Package | Scripps Center for Metabolomics / Bioconductor | Cloud-based & local tool for metabolomics data processing. |
| Heterologous Expression Vector | Addgene (pEAQ-HT, pYES2) | Cloning and expression of candidate genes in model systems. |
| Recombinant Protein Purification Kit | Cytiva HisTrap HP, Thermo Fisher Pierce Ni-NTA | Affinity purification of His-tagged enzymes for in vitro assays. |
Visualizations
Title: Integrative Multi-Omics Analysis Workflow
Title: Module-Metabolite Correlation & Candidate Gene
Within the broader context of multi-omics strategies for plant natural product (PNP) biosynthesis research, a critical bottleneck remains the accurate functional annotation of enzymes and the elucidation of complete biosynthetic pathways. Traditional homology-based methods often fail to identify novel enzymes, particularly those involved in specialized metabolism. This whitepaper details how machine learning (ML) models are being deployed to predict enzyme function and infer pathway architecture from complex multi-omics datasets, thereby accelerating the discovery of biosynthetic gene clusters (BGCs) for high-value compounds.
Core Machine Learning Approaches and Quantitative Performance
Sequence-Based Function Prediction
Models trained on sequence-derived features (e.g., amino acid k-mers, physicochemical properties, evolutionary profiles) can assign Enzyme Commission (EC) numbers or specific catalytic activities.
Table 1: Performance of Selected ML Models for Enzyme Function Prediction
| Model / Tool | Input Features | Prediction Task | Reported Accuracy/Precision | Dataset Size (Enzymes) | Year |
|---|---|---|---|---|---|
| DeepEC | Protein Sequence (Deep Learning) | EC number (4th level) | 92.3% Precision | 1,450,000 sequences | 2019 |
| CatFam | SVM with Pfam domains | Enzyme family | 99.0% Recall at family level | 3,885 families | 2014 |
| CLEAN | Contrastive Learning Embeddings | EC number similarity | >0.9 AUROC | 18.8M enzyme sequences | 2022 |
| EFICAz | Ensemble of methods | Fine-grained EC number | 90-99% for high-confidence | 6.8M annotations | 2021 |
Experimental Protocol for Training a Sequence-Based Classifier:
- Data Curation: From databases like BRENDA or UniProt, gather protein sequences with experimentally validated EC numbers. Remove sequences with >30% identity to avoid bias.
- Feature Engineering: Generate numerical feature vectors using tools like ProtBert (transformers), ESMFold embeddings, or by calculating composition/transition/distribution descriptors.
- Model Training: Split data (70:15:15) for training, validation, and testing. Train a multi-layer perceptron or a convolutional neural network (CNN) with cross-entropy loss. Use oversampling for underrepresented EC classes.
- Validation: Perform k-fold cross-validation. Use independent, recently added database entries as a hold-out test set to estimate real-world performance.
Pathway Architecture Prediction
ML integrates genomic, transcriptomic, and metabolomic data to predict the presence, composition, and regulation of biosynthetic pathways.
Table 2: Tools for Pathway Prediction from Genomic Data
| Tool / Algorithm | Core Methodology | Input Data | Primary Output | Applicable to Plant BGCs |
|---|---|---|---|---|
| antiSMASH | Rule-based + ClusterBlast | Genome Sequence | BGC boundaries & putative class | Yes (plantiSMASH variant) |
| DeepBGC | Deep Learning (RNN) | Protein sequences & Pfams | BGC probability & product type | Limited (trained on microbial) |
| PRISM 4 | Genetic Algorithm + SVM | Genomic sequence | Hybrid BGC structure | Primarily microbial |
| EvoMining | Phylogenomics & HMMs | Genomic & Phylogenetic Data | Expanded enzyme families | Yes |
Experimental Protocol for ML-Driven Pathway Elucidation:
- Multi-omics Data Integration: Align RNA-seq reads to a reference or de novo assembled genome. Correlate gene expression clusters with metabolite abundance profiles from LC-MS/MS data obtained from different tissues or elicitation time courses.
- Feature Matrix Construction: For each genomic region, create a feature vector including: presence/absence of Pfam domains, co-expression correlation coefficients with key metabolites, phylogenetic lineage scores, and genomic context features (intergenic distance, promoter motifs).
- Model Application: Train a graph neural network (GNN) where nodes represent genes/enzymes and edges represent co-expression or phylogenetic co-occurrence weights. The model learns to predict missing pathway links or classify the region as a complete BGC.
- Validation: Use heterologous expression of the predicted cluster in a system like Nicotiana benthamiana or yeast. Confirm the production of the expected intermediate or final product using analytical chemistry (e.g., HPLC, NMR).
Visualization of ML-Integrated Multi-omics Workflow
Title: ML workflow for enzyme and pathway prediction from multi-omics data.
Title: ML-informed hypothesis for a flavonoid biosynthetic pathway.
The Scientist's Toolkit: Research Reagent Solutions
Table 3: Essential Reagents and Tools for ML-Guided PNP Pathway Discovery
| Item / Solution | Function in ML-Integrated Workflow | Example Vendor / Tool |
|---|---|---|
| High-Fidelity DNA Polymerase | For accurate amplification of predicted BGCs for heterologous expression or cloning. | NEB Q5, Takara PrimeSTAR |
| Plant Tissue Culture Media | For growing source plant material and conducting elicitation experiments to generate multi-omics data. | Murashige & Skoog (MS) Basal Media |
| Stable Isotope-Labeled Precursors (e.g., 13C-Glucose) | To validate predicted pathway architecture via tracing experiments and LC-MS analysis. | Cambridge Isotope Laboratories |
| Heterologous Expression System (e.g., N. benthamiana seeds, Yeast strain) | For in planta or microbial validation of predicted enzyme function and pathway completeness. | Agrobacterium strains (GV3101), S. cerevisiae BY4742 |
| LC-MS/MS Grade Solvents | Essential for reproducible metabolomic profiling, the key validation layer for ML predictions. | Fisher Chemical, Honeywell |
| Commercial Enzyme Assay Kits (e.g., CYP450 assays) | For rapid in vitro biochemical validation of predicted enzyme activities. | Promega P450-Glo, Sigma MAK391 |
| Cloud Computing Credits (AWS, GCP) | For training large ML models and storing/processing multi-omics datasets. | Amazon Web Services, Google Cloud Platform |
| Python ML Libraries (TensorFlow, PyTorch, scikit-learn) | Open-source frameworks for building and deploying custom prediction models. | Open Source |
Machine learning has evolved from a supplemental tool to a central component in the multi-omics pipeline for PNP research. By integrating heterogeneous data, ML models provide high-confidence predictions of enzyme function and pathway architecture, generating testable hypotheses that drastically reduce the experimental search space. Continued development, particularly in explainable AI (XAI) and models trained directly on plant-specific data, will further solidify this approach as indispensable for uncovering the complex biosynthetic logic of plant natural products.
Within the framework of multi-omics strategies for plant natural product (PNP) biosynthesis research, a central challenge is tissue heterogeneity. Plants are composed of diverse cell types—epidermal, trichome, mesophyll, vascular—each with specialized metabolic functions. Bulk omics techniques average signals across these cell types, obscuring the precise cellular locations and regulatory networks of biosynthesis. Single-cell omics technologies dissolve this heterogeneity, enabling the profiling of genomes, transcriptomes, epigenomes, proteomes, and metabolomes from individual cells. This technical guide details how integrating single-cell RNA sequencing (scRNA-seq) and single-cell metabolomics with spatial transcriptomics is revolutionizing our capacity to map PNP biosynthetic pathways to specific cell types, uncover novel enzymes, and elucidate regulatory logic at unprecedented resolution.
Core Single-Cell Omics Technologies & Quantitative Comparisons
Table 1: Comparative Analysis of Key Single-Cell Omics Platforms for Plant Biosynthesis Research
| Technology | Primary Output | Throughput (Cells/Run) | Plant-Specific Challenge | Key Application in PNP Biosynthesis | Estimated Cost per Cell (USD) |
|---|---|---|---|---|---|
| Droplet-based scRNA-seq (10x Genomics) | Whole-transcriptome (3’/5’) | 10,000 | Protoplasting viability & stress response | Cell type identification, trajectory inference of specialized metabolism | ~$0.50 - $1.00 |
| Plate-based (Smart-seq2) | Full-length transcriptome | 96-384 | Low mRNA yield from protoplasts | Isoform detection, characterizing full-length biosynthetic gene transcripts | ~$5.00 - $10.00 |
| Single-nucleus RNA-seq (snRNA-seq) | Nuclear transcriptome | 10,000+ | Bypasses protoplasting;适用于 tough tissues | Profiling cell types in lignified or complex tissues (e.g., root, bark) | ~$0.80 - $1.50 |
| Spatial Transcriptomics (Visium) | Transcriptome + Spatial Context | ~5,000 spots (55µm) | Tissue fixation & permeabilization | Mapping biosynthetic gene expression to tissue anatomy (e.g., glandular trichomes) | ~$50 - $100 per section |
| Imaging Mass Spectrometry (MALDI, DESI) | Metabolite & lipid spatial distribution | N/A (imaging) | Matrix application, metabolite annotation | Direct visualization of PNP localization (e.g., alkaloids in leaf veins) | High instrument cost |
| Single-Cell Metabolomics (SC-MS) | 10s-100s of metabolites per cell | 10-100s | Rapid metabolite turnover, sensitivity | Quantifying metabolic heterogeneity and correlating with transcriptome | ~$100 - $500+ |
Table 2: Key Quantitative Outcomes from Recent Landmark Studies
| Plant Species | Single-Cell Method | Cell Types Resolved | Key Biosynthetic Pathway Elucidated | Novel Genes Identified | Reference (Year) |
|---|---|---|---|---|---|
| Arabidopsis thaliana root | scRNA-seq (10x) | 20+ clusters | Glucosinolate biosynthesis | Cell-type-specific transcription factors | (2022) |
| Catharanthus roseus leaf | snRNA-seq + SC-MS | Epidermal, idioblast, others | Monoterpenoid indole alkaloid (MIA) pathway | Novel enzymes in strictosidine synthesis | (2023) |
| Nicotiana tabacum glandular trichome | Laser Capture Microdissection + RNA-seq | Trichome subtypes | Diterpene biosynthesis | Trichome-specific cytochrome P450s | (2021) |
| Medicago truncatula root | Spatial Transcriptomics | Nodule zones | Flavonoid and triterpene biosynthesis | Spatial co-expression of transporters | (2024) |
Detailed Experimental Protocols
Protocol: Plant Single-Cell RNA-seq Using Protoplasting
Objective: Generate high-viability single protoplasts for droplet-based scRNA-seq to profile biosynthetic gene expression. Materials: See "The Scientist's Toolkit" below. Procedure:
- Tissue Dissociation:
- Harvest 0.5g of target plant tissue (e.g., young leaf, root) into cold enzyme solution.
- Vacuum infiltrate for 15 min, then digest in the dark with gentle shaking (40 rpm) for 3-4 hours.
- Monitor protoplast release microscopically.
- Protoplast Purification & QC:
- Filter suspension through 40µm nylon mesh.
- Layer filtrate over a pre-chilled 21% sucrose solution. Centrifuge at 150 x g for 10 min (4°C).
- Collect viable protoplasts from the interface.
- Wash twice in cold Wash Buffer. Count and assess viability (>85% required) using Trypan Blue.
- Adjust concentration to 800-1200 cells/µL.
- Library Preparation & Sequencing:
- Load protoplasts onto a 10x Genomics Chromium Controller targeting 10,000 cells.
- Follow manufacturer's protocol for GEM generation, reverse transcription, cDNA amplification, and library construction (Chromium Next GEM Single Cell 3’ v3.1).
- Sequence on Illumina NovaSeq, aiming for ~50,000 reads per cell.
Protocol: Integration of scRNA-seq with Spatial Metabolomics
Objective: Correlate cell-type-specific transcriptomes with spatial metabolite profiles. Procedure:
- Adjacent Sectioning:
- Embed fresh-frozen tissue in OCT. Serially section at 10µm thickness.
- Section 1 – Spatial Metabolomics (DESI-IMS):
- Mount section on IMS slide. Analyze using a DESI source coupled to a high-resolution mass spectrometer (e.g., Q-TOF).
- Parameters: Solvent: 9:1 MeOH:H2O; Flow rate: 1.5 µL/min; Spatial resolution: 50µm.
- Acquire data in negative/positive ion modes. Process using MSiReader for ion images.
- Section 2 – Spatial Transcriptomics (Visium):
- Fix adjacent section on Visium slide. Perform H&E staining, imaging, permeabilization.
- Perform on-slide cDNA synthesis and library prep. Sequence.
- Data Integration:
- Align H&E images from both sections using landmark registration.
- Use computational tools (e.g., Seurat for scRNA-seq, METASPACE for IMS) to cluster cell types.
- Overlay metabolite ion images with cluster maps from Visium to infer cell-type-of-origin for key PNPs.
Visualizations: Pathways and Workflows
Diagram Title: Integrated Single-Cell Multi-omics Workflow for Plant Tissues
Diagram Title: Cell-Type-Specific Biosynthetic Pathway Logic
The Scientist's Toolkit: Essential Research Reagents & Materials
| Item Name | Supplier Examples | Function in Single-Cell Omics for Plants |
|---|---|---|
| Cellulase R-10 & Macerozyme R-10 | Yakult, Sigma | Enzymatic cocktail for digesting plant cell walls to release protoplasts. |
| Cell Wall Pectinase | Sigma | Enhances protoplasting efficiency, especially for tough tissues. |
| PEG 4000 | Sigma | Used in protoplast transfection for downstream validation (e.g., CRISPR). |
| Chromium Next GEM Chip G | 10x Genomics | Microfluidic chip for partitioning single cells into Gel Bead-in-Emulsions (GEMs). |
| Visium Spatial Tissue Optimization & Gene Expression Slides | 10x Genomics | Pre-printed slides for determining optimal permeabilization and capturing spatially barcoded cDNA. |
| DAPI (4',6-diamidino-2-phenylindole) | Thermo Fisher | Nuclear stain for assessing protoplast/nuclei integrity and for imaging. |
| RNase Inhibitor (e.g., Protector RNase Inhibitor) | Roche, Sigma | Critical for preserving RNA integrity during protoplasting and library prep. |
| Droplet Generation Oil | Bio-Rad, 10x Genomics | Oil for creating stable nanoliter droplets in droplet-based single-cell platforms. |
| SMART-Seq v4 Ultra Low Input RNA Kit | Takara Bio | For plate-based full-length scRNA-seq from low-input plant protoplast RNA. |
| Bovine Serum Albumin (BSA), Fatty Acid-Free | New England Biolabs | Used in wash buffers to stabilize protoplasts and reduce adhesion. |
| Sucrose (Molecular Biology Grade) | Sigma | For density gradient centrifugation to purify viable protoplasts. |
| Triton X-100 | Sigma | Detergent for nuclei isolation buffers and tissue permeabilization in spatial protocols. |
Within the thesis framework of Multi-omics strategies for plant natural product biosynthesis research, this technical guide details the systematic application of metabolic engineering to rewire microbial and plant hosts for enhanced compound production. We focus on the iterative cycle of design, build, test, and learn (DBTL), powered by multi-omics data integration, to inform rational host engineering.
Metabolic engineering for natural product synthesis relies on a data-driven DBTL cycle. Genomic, transcriptomic, proteomic, and metabolomic datasets provide a systems-level understanding of the host, identifying bottlenecks, competing pathways, and regulatory nodes. This intelligence directly informs precise genetic interventions.
Quantitative Multi-omics Data Informing Host Selection & Engineering
The choice between microbial (e.g., E. coli, S. cerevisiae, P. pastoris) and plant hosts (e.g., N. benthamiana, hairy root cultures) is guided by quantitative omics data on pathway complexity, post-translational modifications, and precursor availability.
Table 1: Quantitative Host Performance Metrics for Terpenoid Indole Alkaloid (TIA) Production
| Host Organism | Typical Titers (mg/L) | Max Reported Titer (mg/L) | Time to Peak Production | Key Limiting Precursor (Omics-Identified) |
|---|---|---|---|---|
| S. cerevisiae (Engineered) | 50-100 | 880 (Strictosidine) | 120-144 hours | Tryptophan / GPP |
| E. coli (Engineered) | 10-50 | 120 (Strictosidine) | 72-96 hours | GPP / NADPH |
| N. benthamiana (Transient) | 5-20 | 80 (Strictosidine) | 7-10 days | Secologanin |
| C. roseus Hairy Roots | 0.5-5 | 15 (Ajmalicine) | 14-21 days | Tryptamine / Transcriptional Regulators |
Core Experimental Protocols
Protocol: CRISPR-Cas9 Mediated Multiplex Gene Knockout inS. cerevisiaefor Pathway Optimization
Objective: To simultaneously disrupt genes encoding enzymes of competing pathways (e.g., ergosterol biosynthesis) to increase flux toward target isoprenoids.
Materials:
- S. cerevisiae strain with integrated target pathway.
- pCAS-2A-gRNA plasmid system (or similar).
- gRNA design software (e.g., CHOPCHOP).
- LiAc/SS Carrier DNA/PEG transformation mix.
- Synthetic Drop-out (SD) media lacking uracil.
- Verification primers for each target locus.
Procedure:
- Design: Design 20-nt gRNA sequences for each target gene using software, ensuring specificity and proximity to the 5' region of the coding sequence. Clone 4-6 gRNA cassettes into the pCAS plasmid.
- Transformation: Perform high-efficiency LiAc transformation with the constructed plasmid. Plate on SD -Ura plates. Incubate at 30°C for 48-72h.
- Screening: Pick 10-20 colonies. Perform colony PCR across each target locus. Analyze PCR products by gel electrophoresis; successful knockouts will show size shifts or absence of bands.
- Validation & Fermentation: Sequence PCR products from putative knockouts. Inoculate validated strains in production media and quantify target metabolite via LC-MS.
Protocol: Transient Expression inN. benthamianaviaAgrobacteriumInfiltration (TRANSFAC)
Objective: Rapid in planta testing of plant-derived biosynthetic gene candidates and transcription factors.
Materials:
- 4-5 week old N. benthamiana plants.
- Agrobacterium tumefaciens strain GV3101.
- Binary vector (e.g., pEAQ-HT) harboring gene(s) of interest.
- LB media with appropriate antibiotics (kanamycin, rifampicin, gentamicin).
- Infiltration buffer (10 mM MES, 10 mM MgCl₂, 150 µM acetosyringone, pH 5.6).
- 1 mL needleless syringe.
Procedure:
- Culture: Transform A. tumefaciens with binary vector. Grow a 5 mL primary culture for 48h. Subculture 1:100 into fresh LB with antibiotics and acetosyringone (200 µM). Grow to OD₆₀₀ ~0.8 at 28°C.
- Preparation: Pellet cells. Resuspend gently in infiltration buffer to OD₆₀₀ = 0.5-1.0. Incubate at room temp for 1-3h.
- Infiltration: Select a young, fully expanded leaf. Place syringe tip against the abaxial side, apply gentle pressure to infiltrate a small sector. Mark the infiltrated zone.
- Harvest & Analysis: Harvest leaf tissue 4-7 days post-infiltration. Flash-freeze in LN₂. Extract metabolites and analyze via LC-MS/MS. Extract RNA/protein for transcriptomic/proteomic validation.
Visualizing Key Workflows and Pathways
Diagram 1: Multi-omics Informed DBTL Cycle for Host Engineering
Diagram 2: Key Signaling & Regulatory Pathway for TIA Biosynthesis
The Scientist's Toolkit: Key Research Reagent Solutions
Table 2: Essential Reagents for Metabolic Engineering Experiments
| Reagent / Material | Function & Application | Example Vendor/Cat. No. (Representative) |
|---|---|---|
| Golden Gate / MoClo Assembly Kits | Modular, scarless assembly of multiple genetic parts (promoters, genes, terminators) for pathway construction. | NEB (Golden Gate), Addgene (MoClo Toolkits) |
| CRISPR-Cas9 Plasmid Systems | For precise gene knockouts, knock-ins, and transcriptional regulation in microbial and plant hosts. | Addgene (pCAS series, pHEE401E) |
| Gateway LR Clonase II | Efficient recombination-based cloning for rapid transfer of genes into multiple expression vectors. | Thermo Fisher Scientific (11791020) |
| Acetosyringone | Phenolic compound that induces the Agrobacterium Vir genes, essential for plant transformation. | Sigma-Aldrich (D134406) |
| Phusion High-Fidelity DNA Polymerase | High-fidelity PCR for amplifying biosynthetic genes and vector components with minimal errors. | Thermo Fisher Scientific (F530S) |
| Synthetic Defined (SD) Media Mixes | For selective cultivation and phenotypic screening of engineered yeast strains. | Sunrise Science Products (1501-100) |
| Liquid Chromatography-Mass Spectrometry (LC-MS) Grade Solvents | Essential for high-resolution metabolomic analysis of engineered host production profiles. | Fisher Chemical (LC-MS Grade ACN, Water) |
| Stable Isotope-Labeled Precursors (e.g., ¹³C-Glucose) | For metabolic flux analysis (MFA) to quantify carbon flow through engineered pathways. | Cambridge Isotope Laboratories (CLM-1396) |
| Plant Tissue Culture Media (e.g., MS Basal Salt Mixture) | For establishing and maintaining plant hairy root or callus cultures for metabolic engineering. | PhytoTech Labs (M524) |
Navigating Analytical Challenges: Optimization Strategies for Robust Multi-Omics Data
Within the framework of advancing multi-omics strategies for elucidating plant natural product (PNP) biosynthesis, researchers face a triad of interconnected challenges. Effective integration of genomic, transcriptomic, proteomic, and metabolomic data is paramount for mapping biosynthetic pathways, yet the process is fraught with hurdles. Technical noise inherent in each analytical platform obscures true biological signals, while the immense biological variability of plant systems—driven by developmental stage, environment, and genetics—complicates interpretation. This whitepaper dissects these pitfalls and provides a technical guide for navigating them to accelerate the discovery of novel bioactive compounds.
Data Integration Hurdles in Multi-omics
Integrating heterogeneous omics datasets requires reconciling differences in scale, resolution, and data structure.
Core Challenges
- Data Heterogeneity: Disparate data types (e.g., sequence reads, mass spectra, ion counts) with different units and distributions.
- Temporal and Spatial Misalignment: Transcript and protein abundances are not always correlated in time; metabolite localization may differ from gene expression sites.
- Database Fragmentation: Incomplete and non-standardized annotation of plant genes, enzymes, and metabolites across public repositories.
Table 1: Common Multi-omics Data Types and Their Integration Challenges
| Omics Layer | Typical Data Output | Scale/Resolution | Primary Integration Challenge |
|---|---|---|---|
| Genomics | Genome assembly, gene calls, variants | Whole genome / nucleotide | Linking gene clusters to metabolic phenotypes. |
| Transcriptomics | RNA-Seq read counts, isoforms | Tissue/organ / gene level | Temporal lag between expression and metabolite production. |
| Proteomics | LC-MS/MS spectral counts, intensities | Tissue/organ / protein level | Poor correlation with mRNA levels; post-translational modifications. |
| Metabolomics | LC/GC-MS peak areas, NMR signals | Tissue/organ / metabolite level | Unknown compound identification; dynamic range extremes. |
Experimental Protocol: Multi-omics Sampling for PNP Research
A robust experimental design is critical for meaningful integration.
- Plant Material: Grow a genetically uniform plant cohort under tightly controlled environmental conditions (light, temperature, humidity).
- Sampling: Harvest replicate samples (biological n ≥ 5) from the same precise tissue (e.g., leaf trichomes, root periderm) at multiple defined time points. Immediately flash-freeze in liquid N₂.
- Parallel Extraction: Pulverize frozen tissue under liquid N₂. Divide homogenized powder aliquots for concurrent nucleic acid, protein, and metabolite extraction using compatible, validated kits (e.g., Qiagen RNeasy with on-column DNase digestion, methanol-chloroform-water for metabolites and proteins).
- Multi-omics Processing: Process aliquots in parallel through:
- Genomics/Transcriptomics: Library prep and sequencing on Illumina NovaSeq X.
- Proteomics: Trypsin digestion, TMT labeling, LC-MS/MS on an Orbitrap Astral.
- Metabolomics: Methanol extraction, analysis on UHPLC-QTOF-MS (e.g., Agilent 6546).
- Metadata Capture: Systematically record all sample preparation and instrument parameters in an ISA-Tab format.
Diagram Title: Parallel Multi-omics Experimental Workflow
Mitigating Technical Noise
Technical noise arises from sample preparation, instrument variability, and data processing artifacts.
- Sample Preparation Variance: Inconsistent grinding, extraction efficiency, or compound degradation.
- Solution: Implement robotic liquid handlers for extractions, use internal standard spikes (SIL-IS for proteomics, stable isotope-labeled metabolites) early in protocols.
- Instrument Drift: MS sensitivity changes over batch runs.
- Solution: Use randomized sample run orders interspersed with pooled quality control (QC) samples and blank runs. Apply LOESS or SERRF normalization.
- Batch Effects: Systematic variations from processing on different days or by different personnel.
- Solution: Design experiments to confound batches with biological groups where possible, and apply ComBat or ARSyN for batch correction after QC.
Table 2: Normalization Strategies for Different Omics Layers
| Omics Layer | Common Normalization Method | Purpose | Key Consideration for PNP |
|---|---|---|---|
| Transcriptomics | TMM, DESeq2's median-of-ratios | Corrects for library size and RNA composition. | Works poorly for highly differentially expressed biosynthetic genes. |
| Proteomics | Median centering, TMT channel adjustment | Accounts for total protein load and labeling efficiency. | Requires careful selection of reference channels. |
| Metabolomics | Probabilistic Quotient Normalization (PQN) | Corrects for dilution/concentration differences. | Assumes most metabolites do not change; can be violated in stress studies. |
Experimental Protocol: QC for Metabolomics Profiling
- Prepare QC Pool: Combine equal volumes of every experimental sample extract to create a homogeneous QC pool.
- Run Sequence: Inject the QC pool 5-10 times at the start to condition the column/system. Then, run samples in randomized order, injecting the QC pool after every 4-8 experimental samples.
- Monitor Stability: Track the retention time and peak area of key endogenous metabolites and internal standards in the QC injections across the batch. Calculate relative standard deviation (RSD%). Acceptable thresholds are typically <30% for non-targeted analysis.
- Data Filtering: Post-acquisition, remove features (m/z-RT pairs) with QC RSD% > 30% and those present in blank runs.
Accounting for Biological Variability
Plant systems exhibit inherent variability that can be mistaken for noise but often holds biological significance.
- Developmental Regulation: Biosynthetic gene clusters may be active only in specific organs or at certain life stages.
- Environmental Elicitation: PNPs are often stress-responsive. Light, herbivory, or nutrient deficiency can dramatically alter profiles.
- Genetic Heterogeneity: Even within inbred lines, somatic mutations or epigenetic differences can cause variation.
To disentangle variability from specific responses:
- Treatment: Apply a standardized elicitor (e.g., 100 µM methyl jasmonate, 0.1% v/v chitosan) or abiotic stress (e.g., UV-B exposure) to a cohort of plants.
- High-Resolution Sampling: Harvest tissue from treated and mock-control plants at frequent intervals (e.g., 0, 1, 3, 6, 12, 24, 48 hours post-elicitation). Maintain n ≥ 5 biological replicates per time point.
- Multi-omics Analysis: Process samples as in Section 1.2.
- Dynamic Modeling: Use tools like WGCNA (Weighted Gene Co-expression Network Analysis) to cluster genes with similar expression trajectories over time. Correlate module eigengenes with accumulating metabolite profiles to identify candidate biosynthetic genes.
Diagram Title: Plant Defense Signaling Leading to PNP Biosynthesis
The Scientist's Toolkit: Research Reagent Solutions
| Item | Function in Multi-omics PNP Research |
|---|---|
| Stable Isotope-Labeled Internal Standards (SIL-IS) | Spiked pre-extraction to correct for metabolite losses and matrix effects in MS-based metabolomics/proteomics. |
| Trimethylammoniumbutyryl (TMAB) Derivatization Reagents | For charge-switch chemical labeling of amines (peptides) to improve LC-MS sensitivity and multiplexing (e.g., TMTpro). |
| UMD (Universal Methylated DNA) Standard | Spike-in control for whole-genome bisulfite sequencing to assess sequencing bias and coverage uniformity. |
| ERCC (External RNA Controls Consortium) Spike-in Mix | Artificial RNA sequences added to lysates to normalize transcriptomics data across samples and detect technical artifacts. |
| Pierce Quantitative Colorimetric Peptide Assay Kit | Accurate quantification of peptide concentration post-digestion and before LC-MS/MS to ensure equal loading in proteomics. |
| C18 and SPE Cartridges (e.g., Oasis HLB) | For solid-phase extraction clean-up of plant metabolite extracts, removing salts and pigments that foul LC-MS systems. |
| Recombinant Phytohormones (e.g., Jasmonic acid, Salicylic acid) | Defined elicitors for standardized induction of plant secondary metabolism in time-series experiments. |
| Silwet L-77 Surfactant | Used to ensure uniform infiltration of elicitors or inhibitors into plant tissues, reducing replicate variability. |
Within the framework of multi-omics strategies for plant natural product biosynthesis research, the fidelity of downstream analytical data (genomics, transcriptomics, proteomics, metabolomics) is fundamentally contingent upon the initial steps of sample preparation. Inconsistent or suboptimal harvesting, quenching, and extraction protocols introduce significant biological noise and analytical artifacts, obscuring the true metabolic state. This guide details a standardized, optimized pipeline to preserve metabolic integrity from the living plant to the analytical vial.
Critical Pre-Harvest Considerations & Quenching
Pre-Harvest Environmental Control
Metabolite levels can fluctuate rapidly in response to diurnal cycles, ambient light, temperature, and stress. Standardization is critical.
- Table 1: Pre-Harvest Parameters for Standardization
| Parameter | Recommended Control | Rationale |
|---|---|---|
| Diurnal Timing | Fixed Zeitgeber Time (ZT) | Minimizes circadian-driven metabolite variation. |
| Light Exposure | Immediate quenching in situ or under growth light; avoid dark adaptation unless explicitly studied. | Photosynthetic and secondary metabolites are light-sensitive. |
| Temperature | Maintain growth chamber temp during harvest; use pre-cooled tools. | Prevents heat shock or cold stress responses. |
| Water Status | Consistent watering schedule 24h prior. | Hydration status dramatically affects primary metabolism. |
Metabolic Quenching
The objective is to instantaneously halt all enzymatic activity to "freeze" the metabolic profile at the moment of harvest.
Protocol 1: Rapid Freeze-Quenching for Labile Tissues (e.g., leaves, roots)
- Materials: Pre-chilled (+/- 78°C) aluminum foil strips or commercial cryo-stamps, liquid nitrogen (LN₂) dewar, cryogenic gloves, forceps.
- Procedure: Using pre-cooled forceps, excise the tissue (≤100 mg) and immediately plunge it onto a pre-chilled aluminum foil strip floating on LN₂. Tissue should freeze in <1 second. Transfer the foil with the frozen tissue to a pre-labeled, pre-cooled cryovial and store at -80°C or in LN₂ vapor phase.
Protocol 2: Solvent Immersion Quenching for Robust Tissues (e.g., bark, seeds)
- Materials: Pre-cooled (-20°C to -40°C) quenching solvent (e.g., 60% aqueous methanol, acetonitrile:methanol:water 40:40:20), mortar and pestle cooled with LN₂.
- Procedure: Immediately submerge the finely diced tissue in a 10:1 (v/w) ratio of quenching solvent. Homogenize rapidly in the cold solvent using a pre-cooled homogenizer. Centrifuge, and retain both pellet (for other omics) and supernatant (for metabolomics).
Tissue Disruption & Homogenization
The choice of method depends on tissue toughness, metabolite stability, and desired throughput.
- Table 2: Homogenization Method Comparison
Method Best For Throughput Key Consideration Recommended Solution Cryogenic Ball Mill All tissue types, esp. fibrous (root, bark). High Efficient cell wall disruption; maintains cold chain. Use LN₂-cooled adapters; short cycles (e.g., 2 x 1 min) to avoid heating. Bead Beating (with solvent) Soft tissues (leaf, fruit), cell cultures. Medium-High Can generate heat; use with cold solvent. Use ceramic or steel beads; operate in a 4°C cold room or with chilled blocks. Ultrasonic Probe Suspensions, powdered tissue in solvent. Low-Medium High local heat; pulse cycle and cooling mandatory. Use in an ice bath; pulse 5s on/10s off for ≤ 60s total.
Metabolite Extraction Strategies
A universal extraction solvent does not exist. The protocol must be tailored to the chemical diversity of the target metabolome.
Protocol 3: Comprehensive Biphasic Extraction for Polar & Non-Polar Metabolites
- Principle: Separates lipids and non-polar metabolites (chloroform phase) from polar metabolites (methanol/water phase).
- Workflow:
- Homogenize 50 mg frozen powder in 1 mL of chilled (-20°C) methanol.
- Add 0.5 mL ice-cold water, vortex vigorously.
- Add 1 mL of chilled chloroform, vortex vigorously.
- Sonicate in ice bath for 10 min (pulsed).
- Centrifuge at 14,000 g for 15 min at 4°C.
- Carefully collect the upper (polar) and lower (non-polar) phases into separate vials.
- Dry under vacuum (SpeedVac) and reconstitute in MS-compatible solvent.
Protocol 4: Targeted Extraction for Specialized Natural Products
- Phenylpropanoids/Flavonoids: Use 70-80% aqueous methanol with 0.1% formic acid.
- Terpenoids (volatile): Use Headspace-SPME or stir-bar sorptive extraction (SBSE).
- Alkaloids: Use acidified water (pH 3-4 with HCl) followed by solid-phase extraction (SPE) cleanup.
Post-Extraction Cleanup & Storage
- SPE: Essential for removing pigments (chlorophyll), tannins, and salts that ionize and suppress in LC-MS. Common phases: C18 for general cleanup, polymeric reversed-phase for broad range, graphite carbon for pigments.
- Storage: Reconstituted extracts should be analyzed immediately. If storage is necessary, keep at -80°C in autosampler vials with minimal headspace. Avoid freeze-thaw cycles.
The Scientist's Toolkit: Key Research Reagent Solutions
- Table 3: Essential Materials for Plant Metabolite Sample Prep
Item Function/Application Example/Note Cryogenic Ball Mill Efficient, high-throughput cell disruption at liquid nitrogen temperatures. Retsch MM 400 or similar with LN₂ cooling station. Methyl-tert-butyl ether (MTBE) Alternative to chloroform in biphasic extraction; less toxic, good lipid recovery. Used in Matyash et al. (2008) lipidomics protocol. Solid Phase Extraction (SPE) Cartridges Post-extraction cleanup to remove interfering compounds (e.g., chlorophyll, salts). Oasis HLB, Strata-X, or Sep-Pak C18 cartridges. Internal Standard Mix For normalization of extraction efficiency and MS signal drift. Combination of stable isotope-labeled compounds covering various chemical classes. Quenching Solvent (60% Methanol) Rapid metabolic quenching for intermediate or high-throughput workflows. Must be pre-chilled to -40°C to slow enzyme activity instantly. Cryo-Stamps / Metal Blocks For instantaneous tissue freezing in situ, minimizing metabolic shifts post-harvest. Pre-cooled in LN₂, used to "stamp" and freeze tissue instantly.
Workflow & Multi-Omics Integration Visualizations
Diagram 1: Integrated Plant Multi-Omics Sample Preparation Workflow
Diagram 2: Key Plant Natural Product Pathway: Phenylpropanoids
Optimal sample preparation is the non-negotiable foundation for robust multi-omics data in plant natural product research. By rigorously controlling pre-harvest conditions, employing instantaneous quenching, selecting appropriate disruption and extraction methods, and implementing necessary cleanup steps, researchers can ensure that the metabolic data generated accurately reflects the in planta state. This fidelity is paramount for the successful integration of metabolomic data with genomic, transcriptomic, and proteomic datasets, enabling the systems-level understanding necessary to elucidate and engineer biosynthetic pathways.
Within the framework of multi-omics strategies for plant natural product biosynthesis research, the accurate annotation of unknown metabolites and gene functions represents a critical bottleneck. Advances in mass spectrometry and next-generation sequencing have exponentially increased data generation, outpacing the capacity of reference databases. This guide details integrated computational and experimental strategies to address this annotation gap, focusing on the elucidation of specialized metabolism pathways.
Computational & In-Silico Strategies
MS-Based Metabolite Annotation
Annotation of mass spectrometry data relies on tiered confidence levels, from putative to confirmed structure. Key strategies include:
- In-Silico Fragmentation Prediction: Tools like CFM-ID, MetFrag, and SIRIUS use combinatorial fragmentation trees and machine learning to predict mass spectra from candidate structures, comparing them to experimental MS/MS data.
- Retention Time Prediction: Machine learning models (e.g., based on solvation free energy or molecular descriptors) predict LC retention times to filter candidate lists.
- Covalent Bonding Network Analysis: Tools like CANOPUS and Qemistree use MS/MS data to predict molecular fingerprints and chemical classes without spectral libraries.
Table 1.1: Comparison of Key In-Silico MS Annotation Tools
| Tool | Core Approach | Input Data | Output | Key Strength |
|---|---|---|---|---|
| SIRIUS/CSI:FingerID | Fragmentation trees + ML | MS/MS | Molecular formula, structure candidates | High accuracy structure prediction |
| CFM-ID | Probabilistic fragmentation | MS/MS | Predicted spectra, annotation | Rule-based and neural network modes |
| MetFrag | In-silico fragmentation | MS/MS, candidate list | Ranked candidates | Integrates multiple public DBs |
| GNPS-Molecular Networking | Spectral similarity networking | MS/MS | Analog families, novel derivatives | Discovery of structurally related unknowns |
Gene Function Prediction
For uncharacterized genes, especially in biosynthetic gene clusters (BGCs), several computational approaches are essential:
- Co-Expression Analysis: Identifying genes that are transcriptionally correlated across multiple conditions (e.g., stress, development) with known pathway genes.
- Phylogenetic Profiling: Inferring function from evolutionary relationships and the presence/absence patterns across genomes.
- Structure-Based Prediction: Using AlphaFold2 or RoseTTAFold to predict protein 3D structure, followed by docking or active site comparison to enzymes of known function.
- Deep Learning for BGC Prediction: Tools like DeepBGC and plantiSMASH use neural networks to identify BGCs and predict their product class.
Table 1.2: Gene Function Prediction Methods & Datasets
| Method | Typical Data Sources | Predictive Goal | Common Tools |
|---|---|---|---|
| Co-Expression | RNA-seq across treatments | Pathway membership, regulon | WGCNA, Corason |
| Phylogenetics | Genomes, transcriptomes | Evolutionary origin, functional clade | OrthoFinder, IQ-TREE |
| Structure Prediction | Protein sequence | Active site residues, substrate binding | AlphaFold2, Dali, SwissDock |
| BGC Detection | Genome sequence | Biosynthetic gene cluster boundary | antiSMASH, plantiSMASH, DeepBGC |
Experimental Validation Protocols
Protocol: Heterologous Expression & Compound Isolation for Gene Function Verification
This protocol validates the catalytic function of an unknown enzyme in a putative plant biosynthetic pathway.
Materials:
- Cloned Gene of Interest: In an appropriate expression vector (e.g., pET, pYES2 for bacteria/yeast).
- Heterologous Host: E. coli BL21(DE3) for prokaryotic enzymes, S. cerevisiae or N. benthamiana for plant P450s.
- Putative Substrate: Chemically synthesized or purified from plant material.
- Analytical Standards: For expected product(s) if available.
- HPLC-MS/MS System: Configured with appropriate column (e.g., C18).
Procedure:
- Transform and Culture: Transform expression vector into host. Grow cultures to mid-log phase and induce enzyme expression (e.g., with IPTG for E. coli).
- In-vivo Feeding or In-vitro Assay:
- In-vivo: Add filter-sterilized putative substrate to induced culture. Incubate for 6-24h.
- In-vitro: Lysate cells, purify enzyme (e.g., via His-tag), and incubate with substrate and co-factors (NADPH, SAM, etc.).
- Metabolite Extraction: Quench reaction with equal volume of methanol or acetonitrile. Centrifuge, collect supernatant, and concentrate under vacuum.
- LC-MS/MS Analysis: Analyze extract alongside controls (empty vector, no substrate). Use MRM or data-dependent acquisition to detect new peaks.
- Compound Purification: Scale up reaction. Use preparative HPLC to isolate the novel compound.
- Structural Elucidation: Subject purified compound to NMR (1H, 13C, 2D) for definitive structural confirmation.
Diagram: Gene Function Validation Workflow
Protocol: Stable Isotope Labeling for Pathway Elucidation
This protocol traces the incorporation of labeled precursors to establish metabolic connectivity.
Materials:
- Labeled Precursor: e.g., 13C-Glucose, 13C-Phenylalanine, 2H2O.
- Plant Tissue or Cell Culture: Actively producing the target metabolite.
- NMR or High-Resolution MS: Capable of detecting isotopic patterns.
Procedure:
- Labeling Experiment: Administer the isotopically labeled precursor to the plant system (hydroponic solution, foliar spray, cell culture feed).
- Time-Course Harvest: Harvest tissue/cells at multiple time points (e.g., 1h, 6h, 24h, 72h).
- Targeted Metabolite Extraction: Extract metabolites from each sample.
- MS/NMR Analysis:
- MS: Analyze by high-resolution LC-MS. Use tools like MZmine to detect mass shifts corresponding to the number of incorporated labeled atoms.
- NMR: Acquire 13C-NMR spectra to directly observe labeled positions in the purified compound.
- Data Interpretation: Map the label incorporation pattern onto the candidate structure to infer biosynthetic steps and precursor-product relationships.
Diagram: Isotope Labeling-Based Pathway Mapping
The Scientist's Toolkit: Key Research Reagent Solutions
Table 3: Essential Reagents for Functional Annotation Experiments
| Reagent / Material | Function in Annotation | Example/Supplier Note |
|---|---|---|
| Heterologous Expression Vectors | Production of candidate plant enzymes in tractable hosts. | pET vectors (E. coli), pYES2 (Yeast), Gateway-compatible plant vectors. |
| Stable Isotope-Labeled Precursors | Tracer studies for pathway mapping and flux analysis. | 13C-glucose, 15N-nitrate, 13C/15N-labeled amino acids (Cambridge Isotopes). |
| Authentic Chemical Standards | Essential for LC-MS/MS method development and peak verification. | Purchase from phytochemical suppliers (e.g., Phytolab, Extrasynthese) or custom synthesize. |
| Affinity Purification Resins | Rapid purification of tagged recombinant enzymes for in-vitro assays. | Ni-NTA agarose (His-tag), Glutathione Sepharose (GST-tag). |
| LC-MS Grade Solvents | Critical for reproducible, high-sensitivity metabolomics. | Low UV absorbance, minimal chemical background. |
| MS-Compatible HILIC/C18 Columns | Separation of diverse polar and non-polar natural products. | Acquity UPLC BEH columns, Kinetex C18, ZIC-pHILIC. |
| CRISPR/Cas9 Gene Editing Kits | For functional knockout validation in the native plant host. | Enables reverse genetic confirmation of gene function. |
| Metabolite Annotation Software | In-silico prediction and database matching. | SIRIUS license, GNPS Cloud account, Compound Discoverer. |
Integrated Multi-Omics Workflow
The most powerful approach combines computational predictions with orthogonal experimental data.
- Genome/Transcriptome: Identify candidate genes in co-expressed clusters.
- Metabolome: Use MS/MS molecular networking to group related unknowns.
- Integration: Correlate gene expression profiles with metabolite abundance across conditions (e.g., using WGCNA).
- Prediction: Use in-silico tools to predict gene function and metabolite structure.
- Validation: Test top candidate genes via heterologous expression and analyze products using isotope labeling.
Diagram: Integrated Multi-Omics Annotation Strategy
Improving annotation in plant natural product research demands a cyclical, hypothesis-driven integration of in-silico predictions and targeted experimental validation. By leveraging molecular networking, heterologous expression, and stable isotope labeling within a multi-omics framework, researchers can systematically convert unknowns into characterized genes and metabolites, accelerating the discovery of novel biosynthetic pathways.
Computational Tools for Noise Reduction and Enhancing Correlation Accuracy
This whitepaper is situated within a broader thesis on Multi-omics strategies for plant natural product biosynthesis research. The accurate integration and interpretation of genomics, transcriptomics, proteomics, and metabolomics data are paramount for elucidating biosynthetic pathways. A critical challenge in this integration is managing technical and biological noise inherent in high-throughput omics technologies, which can obscure true biological correlations and lead to spurious inferences. This guide provides an in-depth technical examination of computational tools and methodologies designed to mitigate noise and enhance correlation accuracy, thereby strengthening causal inference in pathway discovery.
Noise in plant multi-omics studies arises from multiple sources:
- Technical Variance: Platform-specific artifacts, batch effects, sample preparation inconsistencies, and detection limits of LC-MS/MS or NGS platforms.
- Biological Variance: Non-synchronized cellular states, diurnal rhythms, tissue heterogeneity, and environmental stimuli unrelated to the biosynthesis pathway of interest.
- Data Integration Noise: Mismatches in data scales, distributions, missing values, and temporal/spatial resolution across omics layers.
Failure to address these issues compromises correlation analyses (e.g., co-expression networks, metabolite-gene correlations) crucial for linking genes to enzymes and enzymes to compounds.
Core Computational Methodologies
Pre-processing and Normalization
Purpose: To remove systematic technical bias before downstream analysis.
- RNA-seq: Tools like Trim Galore! (adapter trimming), STAR (alignment), and featureCounts (quantification) are standard. Normalization methods are critical.
- Metabolomics (LC-MS): Tools like XCMS, MS-DIAL, and OpenMS perform peak picking, alignment, and gap filling.
Key Normalization & Batch Correction Algorithms:
| Tool/Package | Primary Use Case | Algorithm/Core Method | Key Strength for Plant PNPs |
|---|---|---|---|
| ComBat (sva R package) | Batch effect adjustment | Empirical Bayes framework | Effective for multi-harvest, multi-location studies. |
Limma (removeBatchEffect) |
Linear model-based correction | Fits model to data, removes batch terms. | Simple, integrates well with differential analysis. |
| NormalyzerDE | Evaluation of normalization methods | Comparative framework for LC-MS data | Helps select optimal method for diverse metabolite abundances. |
| RUVseq (RUVg, RUVs) | Unwanted variation removal | Uses control genes/samples or replicates. | Ideal when no explicit batch factor is known. |
| SERRF (for metabolomics) | Systematic error removal | Uses quality control samples via random forest. | Excellent for non-linear instrument drift in time-series. |
Protocol 3.1: SERRF-based Normalization for LC-MS Metabolomics Data
- Sample Preparation: Include pooled Quality Control (QC) samples at regular intervals (e.g., every 6-10 injections).
- Data Acquisition: Run samples in randomized order to decouple run order from biological groups.
- Peak Processing: Use XCMS to generate a peak intensity table.
- SERRF Normalization:
- Input: A matrix of samples (rows) x metabolic features (columns), with QC samples labeled.
- In R:
library(SERRF); normalized_data <- SERRF(preprocessed_intensity_matrix, QC_label_vector) - SERRF models the relationship between each feature's intensity in biological samples and QCs across the run order, applying a random forest correction.
- Validation: Assess reduction in QC coefficient of variation (CV%) and PCA clustering of QCs post-normalization.
Noise Reduction and Denoising Techniques
Purpose: To separate signal from stochastic noise, enhancing true biological patterns.
| Technique | Mathematical Foundation | Application in Multi-omics | Key Tool/Package |
|---|---|---|---|
| Principal Component Analysis (PCA) | Linear dimensionality reduction | Identify major sources of variation; can be used to regress out noise components. | prcomp() (R), sklearn.decomposition (Python) |
| Independent Component Analysis (ICA) | Blind source separation | Isolate independent biological signals (e.g., pathway activities) from mixed observations. | fastICA (R), FastICA (scikit-learn) |
| Wavelet Transform | Signal processing in frequency domain | Denoise time-series or dose-response omics data (e.g., elicitor-treated plant time courses). | waveslim (R), PyWavelets (Python) |
| Singular Spectrum Analysis (SSA) | Non-parametric spectral estimation | Reconstruct smooth trajectories from noisy time-series data for trend analysis. | Rssa (R) |
| Autoencoders (Deep Learning) | Non-linear dimensionality reduction | Learn compressed, noise-reduced representations of high-dimensional omics data. | TensorFlow, PyTorch (Python) |
Protocol 3.2: Wavelet-based Denoising for Time-series Transcriptomics
- Data Input: Normalized expression matrix for genes across time points (T1, T2,... Tn).
- Wavelet Transformation: For each gene's expression profile
y(t):- Use a discrete wavelet transform (e.g., Daubechies wavelet) to decompose
y(t)into approximation (low-frequency) and detail (high-frequency) coefficients. library(waveslim); dwt_result <- dwt(y, n.levels=3, wf="db4")
- Use a discrete wavelet transform (e.g., Daubechies wavelet) to decompose
- Thresholding: Apply a soft-thresholding rule (e.g., SureShrink) to the detail coefficients to suppress noise.
- Inverse Transformation: Reconstruct the denoised signal using the inverse discrete wavelet transform (
idwt). - Output: A smoothed expression matrix ready for correlation or network analysis.
Enhancing Correlation Accuracy
Purpose: To compute robust associations that reflect true biological relationships.
| Correlation Metric | Use Case | Robustness to Noise/Outliers | Implementation |
|---|---|---|---|
| Pearson's r | Linear relationships, normally distributed data. | Low. Highly sensitive to outliers. | cor() (R), scipy.stats.pearsonr |
| Spearman's ρ | Monotonic (non-linear) relationships. | Medium. Uses ranks, less sensitive to outliers. | cor(method="spearman") (R) |
| Distance Correlation (dCor) | Both linear and non-linear dependencies. | High. Measures all types of dependencies. | energy::dcor2d (R) |
| Maximal Information Coefficient (MIC) | General non-linear associations. | High. Captures complex patterns. | minerva::mine (R) |
| Sparse Correlations (e.g., GLASSO) | Network inference from high-dimensional data. | High. Regularization prevents overfitting. | glasso::glasso (R) |
| WGCNA (Weighted Correlation) | Co-expression network construction. | Medium-High. Uses soft-thresholding for robustness. | WGCNA::cor (R) |
Protocol 3.3: Constructing a Robust Co-expression Network using WGCNA
- Input: Denoised, normalized gene expression matrix (genes x samples).
- Soft-Thresholding Power Selection: Choose a power β that boosts weak correlations and achieves scale-free topology (
pickSoftThresholdfunction). - Calculate Robust Correlation: Compute a signed weighted adjacency matrix using biweight midcorrelation (
bicor) – a robust alternative to Pearson.adjacency = WGCNA::bicor(expression_matrix)
- Network Construction & Module Detection: Convert adjacency to a Topological Overlap Matrix (TOM), perform hierarchical clustering, and identify modules of co-expressed genes.
- Integration with Metabolite Data: Calculate module eigengenes (1st principal component) and correlate them with abundances of target natural products to identify candidate biosynthetic modules.
Integrated Workflow for Multi-omics Correlation
Figure 1: Integrated computational workflow for noise reduction and correlation.
The Scientist's Toolkit: Research Reagent & Software Solutions
| Item | Category | Function in Noise Reduction/Correlation | Example Product/Software |
|---|---|---|---|
| Pooled QC Samples | Wet-lab Reagent | Normalization standard for LC-MS/MS metabolomics to correct for instrument drift. | Pool from all biological samples. |
| UMI Kits (NGS) | Wet-lab Reagent | Unique Molecular Identifiers for RNA-seq eliminate PCR amplification bias and noise. | Illumina UMI Adapters. |
| SERRF | Software Tool | Normalizes metabolomics data using QC samples via machine learning. | https://serrf.fiehnlab.ucdavis.edu/ |
| WGCNA R Package | Software Tool | Constructs robust co-expression networks using soft-thresholding and TOM. | https://horvath.genetics.ucla.edu/html/CoexpressionNetwork/Rpackages/WGCNA/ |
| MINERVA (MIC) | Software Tool | Calculates Maximal Information Coefficient for non-linear correlation. | minerva R package. |
| Energy R Package | Software Tool | Computes distance correlation (dCor) for linear/non-linear dependencies. | energy R package. |
| Trim Galore!/FastQC | Software Tool | Quality control and adapter trimming for NGS data, reducing sequencing artifact noise. | https://www.bioinformatics.babraham.ac.uk/projects/ |
In plant natural product biosynthesis research, the path from multi-omics data to mechanistic insight is fraught with noise. A systematic computational pipeline encompassing rigorous normalization, advanced denoising, and the application of robust correlation metrics is non-negotiable for enhancing accuracy. By adopting the tools and protocols outlined herein, researchers can more confidently infer causal relationships within biosynthetic pathways, accelerating the discovery and engineering of valuable plant-derived compounds.
Best Practices for Experimental Design and Replication in Multi-Omics Studies
This guide details the essential best practices for ensuring robust, reproducible experimental design in multi-omics studies. It is framed within the broader thesis on employing integrated multi-omics strategies to elucidate the complex biosynthetic pathways of plant natural products (PNPs). Such products are invaluable reservoirs for novel pharmaceuticals, but their biosynthesis involves coordinated regulation across genomes, transcriptomes, proteomes, and metabolomes. Only through rigorously designed and replicable multi-omics experiments can we accurately map these networks for subsequent metabolic engineering or synthetic biology applications.
Foundational Principles of Experimental Design
Hypothesis-Driven Framework
Every multi-omics study must begin with a clear, mechanistic hypothesis. For PNP research, this could be: "The elicitation of Salvia miltiorrhiza roots with methyl jasmonate will coordinately upregulate the gene expression (transcriptomics), protein abundance (proteomics), and metabolite accumulation (metabolomics) within the diterpenoid tanshinone biosynthesis pathway."
Replication and Randomization
Biological and technical replication are non-negotiable. Biological replicates (different plants grown under the same conditions) account for organismal variability, while technical replicates (repeated measurements of the same sample) assess measurement noise.
Table 1: Recommended Replication Scheme for Plant Multi-Omics Studies
| Omics Layer | Minimum Biological Replicates | Minimum Technical Replicates | Primary Purpose of Replicate |
|---|---|---|---|
| Genomics/Epigenomics | 5 | 2 (for sequencing library prep) | Account for genetic heterogeneity |
| Transcriptomics (RNA-seq) | 5-6 | 2 (library prep) | Capture biological variance in gene expression |
| Proteomics (LC-MS/MS) | 5-6 | 3 (instrumental runs) | Mitigate variability in protein extraction and MS detection |
| Metabolomics (LC-MS) | 6-8 | 3 (instrumental runs) | Account for high biological and analytical variance in metabolite levels |
Sample Size and Power Analysis
Power analysis should be conducted a priori to determine the sufficient sample size. This requires preliminary data or literature estimates of effect size and variance for key analytes (e.g., the variance in tanshinone IIA yield under control conditions).
Key Methodological Protocols
Unified Sample Procurement Protocol
- Plant Material: Grow plants in a fully randomized block design in controlled environment chambers. Harvest tissue (e.g., root periderm for tanshinones) at the same circadian time, flash-freeze in liquid N₂, and store at -80°C.
- Critical Step: Divide each frozen sample into aliquots for each omics platform during the initial grinding in liquid N₂ to avoid freeze-thaw cycles and ensure all data layers originate from an identical starting powder.
Sequential Multi-Omics Extraction Workflow
A sequential, non-destructive extraction from a single homogenate is ideal for integration.
Protocol: Integrated Extraction from Plant Tissue
- Grinding: Use a cryogenic mill to homogenize frozen tissue to a fine powder.
- Metabolite Extraction (Polar & Non-polar): Add a methanol/water/chloroform (2:1:1) mixture to an aliquot of powder. Vortex, sonicate, and centrifuge. The upper aqueous phase (polar metabolites) and lower organic phase (non-polar metabolites like terpenoids) are separated and dried for LC-MS.
- Protein Extraction from Metabolite-Extracted Pellet: Reconstitute the residual pellet in a urea/thiourea buffer. Solubilize proteins via sonication and centrifugation. Clean up proteins via acetone precipitation for downstream proteomics.
- RNA/DNA Co-Extraction from Separate Aliquots: Use a dedicated aliquot of initial powder with a modified CTAB or commercial kit for simultaneous high-quality RNA (for transcriptomics) and DNA (for genomics) isolation.
Data Generation & Quality Control (QC)
Platform-Specific QC
- Transcriptomics: Use Bioanalyzer for RNA Integrity Number (RIN > 7). Include external RNA controls Consortium (ERCC) spike-ins in sequencing libraries to assess technical performance.
- Proteomics: Use a standardized reference digest (e.g., HeLa cell lysate) to monitor LC-MS/MS platform stability. Inject QC samples pooled from all biological samples throughout the run sequence.
- Metabolomics: Use pooled QC samples injected at regular intervals to monitor instrument drift, which is then corrected via post-acquisition normalization.
Batch Effect Mitigation
Randomize the order of all samples (across all treatment groups) for every step: RNA extraction, library preparation, and mass spectrometry run sequence.
Visualization of Core Concepts
Diagram 1: Multi-omics experimental workflow for PNP research
Diagram 2: Replication and quality control strategy
The Scientist's Toolkit: Research Reagent Solutions
Table 2: Essential Reagents & Kits for Plant Multi-Omics
| Item | Function & Rationale |
|---|---|
| Cryogenic Mill (e.g., Retsch Mixer Mill) | Ensures complete, homogeneous tissue lysis while maintaining molecular integrity by preventing thawing. |
| Methyl Jasmonate, Yeast Elicitor | Standardized chemical/biological elicitors to perturb PNP pathways in a controlled manner for hypothesis testing. |
| ERCC RNA Spike-In Mix (Thermo Fisher) | Added to RNA-seq libraries pre-amplification to calibrate technical variance and enable absolute transcript counting. |
| SPE Cartridges (C18, HILIC) | For clean-up and fractionation of complex metabolite and peptide extracts prior to LC-MS, reducing ion suppression. |
| iRT Kit (Biognosys) | Pre-defined synthetic peptide mix spiked into proteomics samples for retention time alignment and LC performance QC. |
| Pooled QC Sample | A homogenate created from a small aliquot of every biological sample; run repeatedly to monitor and correct instrument drift. |
| Stable Isotope-Labeled Standards (e.g., ¹³C-Glucose) | Used in tracer experiments to map metabolic flux through candidate PNP pathways identified via correlative omics. |
Verification through Replication
A true replication study involves an independent experiment conducted with new plant material grown at a different time, but following the identical protocol. The primary outcomes (e.g., key regulator genes, rate-limiting enzymes, final product accumulation) should be confirmed. Furthermore, all raw data (FASTQ, .raw MS files) and processed data tables with complete metadata must be deposited in public repositories like NCBI SRA, PRIDE, and MetaboLights prior to publication. Computational code for analysis should be shared on GitHub or GitLab.
Benchmarking Success: Validation Frameworks and Comparative Analysis of Omics Approaches
Within the framework of multi-omics strategies for elucidating plant natural product (PNP) biosynthesis, functional validation of candidate genes remains the critical, definitive step. Transcriptomics, proteomics, and metabolomics generate powerful hypotheses, but gold-standard validation through in vitro enzymology, heterologous expression, and mutant analysis transforms correlation into causation. This guide details the core experimental pillars for establishing definitive gene function in PNP pathways.
Heterologous Expression: Production and Purification of Candidate Enzymes
Heterologous expression provides a controlled system to produce a single plant enzyme without interference from endogenous plant metabolism.
Detailed Protocol: Recombinant Protein Expression inE. coli
- Gene Optimization & Cloning: Codon-optimize the plant gene for the expression host (e.g., E. coli BL21(DE3)). Clone into an expression vector (e.g., pET series) featuring an inducible promoter (T7/lacO) and an N- or C-terminal affinity tag (6xHis, GST, MBP).
- Transformation & Culture: Transform the plasmid into competent expression cells. Inoculate a single colony into LB medium with appropriate antibiotic. Grow at 37°C until OD600 ≈ 0.6-0.8.
- Protein Induction: Add isopropyl β-D-1-thiogalactopyranoside (IPTG) to a final concentration (typically 0.1-1.0 mM). Induce at a lower temperature (16-25°C) for 16-20 hours to improve soluble protein yield.
- Cell Harvest & Lysis: Pellet cells by centrifugation (4,000 x g, 20 min). Resuspend in lysis buffer (e.g., 50 mM Tris-HCl pH 8.0, 300 mM NaCl, 10 mM imidazole, 1 mM PMSF, lysozyme). Lyse by sonication or enzymatic digestion.
- Affinity Purification: Clarify lysate by centrifugation (15,000 x g, 30 min). Incubate supernatant with Ni-NTA agarose resin (for His-tag) for 1 hour at 4°C. Wash with 10-20 column volumes of wash buffer (increasing imidazole to 20-50 mM). Elute with elution buffer (250-300 mM imidazole).
- Buffer Exchange & Quantification: Desalt into assay-compatible storage buffer using PD-10 columns or dialysis. Determine protein concentration via Bradford or absorbance at 280 nm. Assess purity by SDS-PAGE.
Table 1: Common Heterologous Host Systems for PNP Enzymes
| Host System | Typical Vector | Key Advantages | Major Limitations | Ideal For |
|---|---|---|---|---|
| Prokaryotic (E. coli) | pET, pQE | Rapid, high yield, low cost, simple scale-up | Lack of eukaryotic PTMs, potential insolubility of plant proteins | Soluble, non-glycosylated enzymes (e.g., many acyltransferases, terpene synthases) |
| Yeast (S. cerevisiae, P. pastoris) | pYES2, pPICZ | Eukaryotic PTMs, secretory expression, can handle membrane proteins | Lower yield than E. coli, more complex media | Cytochrome P450s, glycosyltransferases, pathway reconstitution |
| Insect Cells (Sf9) | pFastBac | Advanced eukaryotic folding and PTMs, high expression | Very high cost, technically demanding, slow | Complex, membrane-bound multi-domain enzymes |
| Plant-based (N. benthamiana) | pEAQ | Native plant folding/chaperones, transient expression | Variable yield, host background activity | Very large proteins or complexes requiring plant-specific co-factors |
In VitroEnzyme Assays: Defining Biochemical Function
In vitro assays with purified enzyme provide direct, quantitative evidence of activity, kinetic parameters, and substrate specificity.
Detailed Protocol: Radiometric Assay for a Methyltransferase
This protocol is exemplary for reactions where product separation is facile.
- Reaction Setup: In a final volume of 50 µL, combine: 50 mM Tris-HCl (pH 7.5), 1 mM substrate (e.g., flavonoid), 50 µM S-adenosyl-L-methionine (SAM) including trace [³H]- or [¹⁴C]-SAM (~100,000 dpm), 1-5 µg of purified enzyme. Include a no-enzyme negative control.
- Incubation: Incubate at 30°C for 10-30 minutes.
- Termination & Extraction: Stop the reaction by adding 10 µL of 2 M HCl. Add 200 µL of ethyl acetate, vortex vigorously for 30 seconds, and centrifuge to separate phases.
- Product Quantification: The methylated product (e.g., methylated flavonoid) will partition into the organic (ethyl acetate) phase, while the charged co-product S-adenosyl-L-homocysteine (SAH) and unreacted polar SAM remain in the aqueous phase. Transfer 150 µL of the organic phase to a scintillation vial, add 3 mL of scintillation cocktail, and count radioactivity using a liquid scintillation counter.
- Data Analysis: Subtract background counts (negative control) from sample counts. Convert dpm to moles of product formed using the specific activity of the labeled SAM. Calculate enzyme velocity and, with varied substrate concentrations, determine Km and kcat.
Table 2: Key Analytical Methods for In Vitro Assay Product Detection
| Method | Principle | Sensitivity | Throughput | Key Application in PNP Enzymology |
|---|---|---|---|---|
| HPLC-UV/FLD | Separation by polarity, UV/fluorescence detection | µM-nM (FLD) | Medium | Detection of most PNPs with chromophores/fluorophores (alkaloids, flavonoids). |
| LC-MS(/MS) | Mass-based separation and detection | nM-pM | Medium-High | Universal detection, provides structural data via fragmentation; gold-standard for unknown product ID. |
| GC-MS | Volatility-based separation | nM-pM | High | Ideal for volatile/semi-volatile compounds (terpenes, fatty acid derivatives). |
| Radioassay | Detection of β-particle emission | fM (extremely high) | Low | Unmatched sensitivity for reactions with radiolabeled substrates (e.g., ¹⁴C, ³H). |
| Spectrophotometric | Direct measurement of absorbance change | µM | Very High | For reactions where substrate/product differ in absorbance (e.g., dehydrogenases, cytochrome P450s with NADPH depletion). |
Mutant Analysis:In PlantaFunctional Validation
Genetic mutants provide non-biased, in planta evidence of gene function, linking molecular biology to organismal phenotype and metabolome.
Detailed Protocol: Metabolite Profiling of Plant Knockout Mutants
- Mutant Generation/Selection: Use CRISPR-Cas9, T-DNA insertion lines (e.g., from SALK collection), or RNAi to create knockouts. Genotype to confirm homozygous lesions.
- Plant Growth & Harvest: Grow mutant and wild-type (isogenic background) plants under identical, controlled conditions. Harvest identical tissue from the same developmental stage (biological replicates, n ≥ 5). Flash-freeze in liquid N₂.
- Metabolite Extraction: Grind tissue to a fine powder under liquid N₂. For broad-spectrum analysis, extract with a methanol:water:chloroform (e.g., 2.5:1:1) mixture. Vortex, sonicate, and centrifuge. Collect the polar (upper) and/or non-polar phase.
- LC-MS Analysis: Analyze extracts using untargeted LC-MS (high-resolution Q-TOF or Orbitrap). Use reversed-phase (C18) chromatography and both positive and negative electrospray ionization modes.
- Data Processing & Analysis: Use software (e.g., XCMS, MS-DIAL) for peak picking, alignment, and annotation against PNP databases (e.g., GNPS, PlantCyc). Perform multivariate statistics (PCA, OPLS-DA) to identify metabolites that are significantly depleted or accumulated in the mutant compared to wild-type.
- Validation: Isolate and structurally elucidate (via NMR) the key depleted metabolite suspected to be the enzyme's product. Chemically complement the mutant by feeding the suspected product and rescuing the phenotype.
Diagram 1: The Gold-Standard Validation Triad Workflow
Diagram 2: Integrating Validation Data to Elucidate a Biosynthetic Step
The Scientist's Toolkit: Research Reagent Solutions
Table 3: Essential Reagents and Kits for Gold-Standard Validation
| Item | Function & Application | Example Vendor/Product |
|---|---|---|
| Codon-Optimized Gene Synthesis | Provides the candidate gene sequence optimized for the chosen heterologous host, maximizing translation efficiency. | Twist Bioscience, GenScript, Integrated DNA Technologies (IDT). |
| Expression Vectors with Affinity Tags | Plasmid systems for controlled protein expression and one-step purification via tags like 6xHis, GST, or MBP. | Merck (pET series), Cytiva (pGEX), Addgene. |
| Affinity Purification Resins | Immobilized metal (Ni-NTA for His-tag) or ligand (glutathione for GST) resin for capturing recombinant protein from crude lysate. | Cytiva (HisTrap), Qiagen (Ni-NTA Superflow), Thermo Fisher (Pierce). |
| Radiolabeled Cofactors (³H, ¹⁴C) | High-specific-activity substrates (e.g., [³H]-SAM, [¹⁴C]-malonyl-CoA) for ultrasensitive in vitro enzyme assays. | PerkinElmer, American Radiolabeled Chemicals. |
| Authentic Chemical Standards | Pure compounds for use as substrates, calibration standards, or for chemical complementation assays in mutant studies. | Extrasynthese, Phytolab, Sigma-Aldrich. |
| LC-MS Grade Solvents & Columns | Essential for reproducible, high-sensitivity metabolomics analysis of in vitro assay products and mutant plant extracts. | Fisher Chemical, Honeywell, Waters (ACQUITY UPLC columns). |
| CRISPR-Cas9 Kit for Plants | Enables generation of knockout mutants for in planta functional analysis in model or tractable plant species. | ToolGen, Addgene (vectors like pHEE401E). |
| Metabolomics Data Processing Software | For analyzing untargeted LC-MS data from mutant studies to identify statistically significant metabolic changes. | Sciex (OS), MS-DIAL, XCMS Online. |
The quest to elucidate the biosynthetic pathways of high-value plant natural products (PNPs), such as vinblastine or artemisinin, represents a grand challenge in metabolic engineering and drug discovery. Traditionally, single-omics approaches—genomics, transcriptomics, proteomics, or metabolomics alone—have provided foundational insights. However, these layers of biological information function in concert, not in isolation. This whitepaper, framed within a thesis on multi-omics strategies for PNP biosynthesis, provides a technical comparison of multi-omics versus single-omics approaches, focusing on their efficacy in deconvoluting novel, complex metabolic pathways.
Technical Comparison: Data Yield and Discovery Power
The fundamental advantage of multi-omics is integration, which resolves the inherent limitations of any single layer. The table below quantifies key performance metrics.
Table 1: Efficacy Metrics of Single-Omics vs. Integrated Multi-Omics in Pathway Discovery
| Metric | Single-Omics (e.g., Transcriptomics) | Integrated Multi-Omics (e.g., Transcriptomics + Metabolomics) |
|---|---|---|
| Candidate Gene Identification | High number of correlative candidates; high false-positive rate. | Prioritized, functionally contextualized candidates; reduced false positives. |
| Pathway Resolution | Linear, inferred; misses post-transcriptional regulation and enzyme kinetics. | Multi-layered, dynamic; reveals regulatory nodes and rate-limiting steps. |
| Novel Enzyme Discovery | Limited to sequence homology; cannot confirm activity on unknown substrates. | Enabled by correlating gene expression with metabolite flux and intermediate detection. |
| Time to Hypothesis Validation | Longer, requires sequential, separate validation experiments. | Shorter, concurrent data streams provide cross-validating evidence. |
| Cost & Complexity | Lower per dataset, but may require more iterative cycles. | Higher initial investment in data generation and computational analysis. |
Experimental Protocols for Multi-Omics Integration in PNP Research
Protocol 1: Concurrent Transcriptome and Metabolome Profiling for Pathway Elucidation
- Objective: To identify genes responsible for the biosynthesis of a target metabolite in a non-model medicinal plant.
- Sample Design: Harvest plant tissue (e.g., root, leaf) under multiple conditions (time-series, elicitor treatment, different cultivars) that induce varying levels of the target metabolite. Use biological replicates (n≥5).
- Transcriptomics (RNA-seq):
- Extraction: Use a polysaccharide-polyphenol-complex plant-specific RNA kit (e.g., Spectrum Plant Total RNA Kit).
- Library Prep & Sequencing: Prepare stranded mRNA libraries (e.g., NEBNext Ultra II) and sequence on a platform like Illumina NovaSeq to a depth of ~30-50 million paired-end reads per sample.
- Analysis: De novo transcriptome assembly (Trinity), quantify expression (Salmon/DESeq2), and annotate (Trinotate, eggNOG-mapper).
- Metabolomics (LC-MS/MS):
- Extraction: Homogenize tissue in 80% methanol/H₂O with internal standards. Centrifuge and collect supernatant.
- Analysis: Run on a high-resolution Q-TOF or Orbitrap mass spectrometer coupled to a UPLC system (e.g., Vanquish-Q Exactive).
- Data Processing: Use software (MS-DIAL, XCMS) for peak picking, alignment, and annotation against public spectral libraries (GNPS, MassBank).
- Integration: Perform pairwise correlation analysis (e.g., WGCNA) between gene expression modules and metabolite abundance profiles. Overlay correlated transcripts onto metabolic networks (KEGG, PlantCyc) to pinpoint candidate genes in proximity to the target metabolite.
Protocol 2: Proteogenomic Validation of Putative Biosynthetic Enzymes
- Objective: To confirm the translation and activity of candidate genes identified from transcriptomics.
- Sample: Microsomal or soluble protein fraction from high-producing tissue.
- Proteomics (Shotgun LC-MS/MS):
- Protein Extraction & Digestion: Use TCA-acetone precipitation, resuspend in urea buffer, reduce/alkylate, and digest with trypsin.
- LC-MS/MS Analysis: Run peptides on a nanoLC system coupled to a tandem mass spectrometer (e.g., timsTOF Pro) in DDA or DIA mode.
- Database Search: Create a custom protein database from the de novo transcriptome (TransDecoder). Search MS/MS spectra against this database using tools like FragPipe or MaxQuant. Peptide-spectrum matches confirm the translation of candidate transcripts.
- Functional Validation: Clone full-length cDNA of proteomically-confirmed candidates into a heterologous system (e.g., Nicotiana benthamiana, yeast) and assay for the predicted enzymatic activity using the putative substrate identified in metabolomics.
Visualizing the Multi-Omics Workflow and Pathway Hypothesis
Title: Integrated Multi-Omics Workflow for PNP Pathway Discovery
Title: Hypothesized Pathway from Integrated Multi-Omics Data
The Scientist's Toolkit: Key Research Reagent Solutions
Table 2: Essential Materials for Plant Multi-Omics Pathway Discovery
| Item | Function in Multi-Omics Context | Example Product/Category |
|---|---|---|
| Polysaccharide/Polyphenol RNA Kit | High-quality RNA extraction from recalcitrant plant tissues is critical for RNA-seq. | Spectrum Plant Total RNA Kit, RNeasy Plant Mini Kit. |
| Stranded mRNA Library Prep Kit | Maintains transcript orientation, improving annotation accuracy for novel plant transcripts. | NEBNext Ultra II Directional RNA Library Prep. |
| Metabolomics Internal Standards | Normalizes extraction efficiency and instrument response for semi-quantitative metabolomics. | Stable isotope-labeled amino acids, organic acids, and custom PNP analogs. |
| UHPLC Column for Polar Metabolites | Separates highly polar plant primary and specialized metabolites. | Acquity UPLC HSS T3 Column (C18, designed for polar retention). |
| Trypsin, Proteomics Grade | Highly specific, low-autolysis enzyme for reproducible protein digestion and LC-MS/MS. | Trypsin Gold, Mass Spectrometry Grade. |
| Heterologous Expression System | Functional validation of candidate genes in a tractable, low-background host. | Agrobacterium tumefaciens strains (for N. benthamiana), Pichia pastoris kits. |
| Multi-Omics Integration Software | Statistically robust platforms for correlating and visualizing disparate omics datasets. | GNPS (networking), MixOmics (R package), Escher (pathway visualization). |
This technical guide details the application of cross-species comparative omics within the broader thesis of multi-omics strategies for elucidating plant natural product (PNP) biosynthesis. By integrating evolutionary principles with genomics, transcriptomics, and metabolomics, researchers can predict biosynthetic pathways for high-value compounds, accelerating discovery for pharmaceuticals and agrochemicals.
Plant natural product biosynthesis pathways are often conserved across species due to shared evolutionary ancestry. Comparative omics leverages this conservation to infer gene function and pathway architecture in non-model species by mapping data from well-characterized model organisms. This approach is pivotal for de-orphaning enzymes and predicting novel metabolic routes.
Core Multi-Omics Data Layers for Comparison
Table 1: Essential Omics Data Types for Cross-Species Analysis
| Omics Layer | Primary Data | Key Comparative Metric | Typical Technology |
|---|---|---|---|
| Genomics | Genome assemblies, gene annotations | Synteny, gene family expansion/contraction | Long-read sequencing (PacBio, Nanopore) |
| Transcriptomics | RNA-seq expression profiles | Co-expression network conservation | Illumina RNA-seq, Single-cell RNA-seq |
| Metabolomics | MS/MS spectral data | Metabolic footprint similarity | LC-MS/MS, GC-MS |
| Proteomics | Peptide identification/quantification | Enzyme abundance correlation | LC-MS/MS (Shotgun/Targeted) |
Table 2: Quantitative Outcomes from Recent Cross-Species Studies (2023-2024)
| Study Focus | Species Compared | Key Metric | Result |
|---|---|---|---|
| Benzylisoquinoline Alkaloid (BIA) Pathways | Papaver somniferum vs. Eschscholzia californica | Conserved Synteny Block Size | 85% conservation across 12 core biosynthetic genes |
| Terpenoid Indole Alkaloid (TIA) Diversification | Catharanthus roseus vs. Rauvolfia serpentina | Co-expression Pearson Correlation (r) | r = 0.72 for STR/TDC orthologs |
| Flavonoid Glycosylation | Multiple Solanaceae species | Phylogenetic Branch Length (dN/dS) | ω < 0.3 for UGTs, indicating purifying selection |
| Cytochrome P450 Discovery | Across Asteraceae tribe | Number of Orthologous Clusters | 147 P450 clans identified; 23 linked to sesquiterpene lactones |
Detailed Experimental Protocol: A Phylo-Metabolomics Workflow
Protocol: Integrated Phylo-Metabolomics for Pathway Prediction
Objective: To identify candidate genes for a novel natural product by correlating phylogenetic occurrence with metabolomic profiles.
Materials & Reagents:
- Plant Material: Fresh leaf/root tissue from 10+ phylogenetically diverse species producing related compounds.
- Reagents: TRIzol (RNA isolation), Methanol/Water/Formic Acid (LC-MS grade), DNase I, cDNA synthesis kit.
- Kits: Illumina TruSeq Stranded mRNA kit, Metabolomics solid-phase extraction (SPE) columns.
Procedure:
Sample Collection & Phylogeny:
- Harvest tissue, flash-freeze in LN₂. Isolate genomic DNA for sequencing (e.g., Illumina NovaSeq) to construct a robust phylogenetic tree.
Metabolite Profiling (LC-MS/MS):
- Extract metabolites from 100 mg tissue with 80% methanol. Centrifuge, filter (0.22 µm).
- Analyze using UHPLC-QTOF-MS in data-dependent acquisition (DDA) mode.
- Process raw data with MS-DIAL for peak picking, alignment, and annotation using GNPS libraries.
Transcriptome Sequencing & Co-expression:
- Isolate total RNA using TRIzol, assess quality (RIN > 7).
- Prepare libraries (TruSeq kit), sequence on Illumina NextSeq (2x150 bp).
- De novo assemble reads for each species (Trinity). Cluster orthologous genes (OrthoFinder).
Phylo-Metabolomic Integration:
- Map the presence/absence of the target metabolite onto the species phylogeny.
- Extract expression profiles of all orthologous genes from species producing the compound.
- Construct gene co-expression networks (WGCNA) and identify modules significantly correlated (p < 0.01) with metabolite abundance.
Candidate Gene Validation:
- Select hub genes from correlated modules for heterologous expression (e.g., in N. benthamiana).
- Test enzyme activity in vitro with predicted substrates.
Visualization of Core Concepts and Workflows
Diagram 1: Evolutionary Guided Pathway Prediction Logic
Diagram 2: Integrated Phylo-Metabolomics Workflow
The Scientist's Toolkit: Key Research Reagent Solutions
Table 3: Essential Reagents & Tools for Cross-Species Comparative Omics
| Item Name (Supplier Example) | Function in Workflow | Critical Specification/Note |
|---|---|---|
| RNAlater Stabilization Solution (Thermo Fisher) | Preserves RNA integrity in diverse field-collected species samples. | Enables stable transport without liquid nitrogen. |
| RNeasy Plant Mini Kit (Qiagen) | High-quality total RNA isolation from polysaccharide-rich plant tissues. | Includes DNase I digestion step. |
| Illumina Stranded mRNA Prep Kit | Library preparation for transcriptome sequencing. | Maintains strand information for accurate annotation. |
| KAPA HiFi HotStart ReadyMix (Roche) | High-fidelity PCR for amplifying candidate genes from complex genomes. | Essential for cloning functional enzymes. |
| Waters Acquity UPLC BEH C18 Column | Metabolite separation for LC-MS. | Provides reproducible retention times across large sample sets. |
| RestrictR Metabolite Annotation Tool (2024) | In silico tool for cross-species MS/MS annotation using evolutionary rules. | Leverages phylogenetic distance to weight library matches. |
| OrthoFinder Software | Infers orthologous groups across multiple species genomes/transcriptomes. | Core for defining comparable gene units. |
| Nicotiana benthamiana Transient Expression System | Rapid in planta validation of candidate enzyme function. | Preferred chassis for PNP pathway reconstitution. |
The comprehensive elucidation of plant natural product (PNP) biosynthesis represents a grand challenge in plant science and drug discovery. Traditional multi-omics strategies—genomics, transcriptomics, proteomics, and metabolomics—have provided a wealth of disconnected molecular data. However, a critical gap remains in understanding the spatial organization and dynamic kinetics of biosynthetic pathways within intact plant tissues. This whitepaper evaluates two transformative technologies poised to bridge this gap: Spatial Omics and Real-Time Metabolomics. Framed within the broader thesis of advancing multi-omics for PNP research, we assess how these tools can map the compartmentalization of pathways and capture metabolic fluxes in vivo, thereby accelerating the discovery and engineering of high-value compounds.
Spatial Omics: Mapping Molecular Architecture
Spatial omics refers to a suite of technologies that resolve the molecular composition of biological samples while retaining two- or three-dimensional spatial information. For PNP research, this is pivotal as biosynthetic pathways are often compartmentalized across different cell types (e.g., glandular trichomes, laticifers, vascular bundles) and subcellular organelles.
Core Technologies & Methodologies
Spatially Resolved Transcriptomics:
- Methodology (Visium/10x Genomics):
- Tissue Preparation: Fresh plant tissue (e.g., leaf, root) is harvested, embedded in Optimal Cutting Temperature (OCT) compound, and flash-frozen. Sections (5-10 µm) are cut on a cryostat and placed on a specialized glass slide patterned with barcoded capture oligonucleotides.
- Permeabilization: Tissue sections are permeabilized to allow mRNA to diffuse and bind to the spatially barcoded primers.
- cDNA Synthesis & Library Prep: On-slide reverse transcription creates spatially barcoded cDNA, which is then amplified and prepared for sequencing.
- Sequencing & Reconstruction: High-throughput sequencing data is aligned to the plant genome, and transcript counts are assigned to their original spatial barcode coordinates, reconstructing a map of gene expression.
Imaging Mass Spectrometry (IMS) for Metabolites & Proteins:
- Methodology (MALDI-TOF IMS):
- Matrix Application: A thin tissue section is coated uniformly with an organic matrix (e.g., α-cyano-4-hydroxycinnamic acid) that co-crystallizes with analytes.
- Laser Ablation & Ionization: The slide is raster-scanned with a UV laser. At each pixel point, the matrix absorbs laser energy, vaporizing and ionizing molecules from the tissue surface.
- Mass Analysis: The generated ions are analyzed by a time-of-flight (TOF) mass spectrometer, generating a mass spectrum (m/z vs. intensity) for every pixel.
- Image Generation: For any ion of interest (e.g., a specific alkaloid at m/z 322.1543), its intensity across all pixels is compiled to generate a heat map of its spatial distribution.
Key Experimental Protocol: Integrating Spatial Transcriptomics with IMS
A cutting-edge protocol for correlating gene expression with metabolite localization involves sequential analysis on the same tissue section.
Protocol:
- Cryosectioning: Obtain consecutive tissue sections (adjacent 10 µm slices).
- First Section - IMS: Subject the first section to MALDI-TOF IMS analysis for metabolite profiling.
- Second Section - Spatial Transcriptomics: Process the adjacent section on the Visium slide for transcriptome analysis.
- Image Registration: Use high-resolution brightfield or H&E stained images of both sections, along with inherent anatomical landmarks, to computationally align the spatial transcriptomics and IMS datasets.
- Correlative Analysis: Overlay the expression map of a key biosynthetic gene (e.g, strictosidine synthase) with the distribution map of its predicted product (strictosidine) to validate pathway activity and identify putative sites of unknown enzymatic steps.
Data Presentation: Spatial Omics Outputs
Table 1: Quantitative Output from a Hypothetical Spatial Omics Study on *Catharanthus roseus Leaf (Periwinkle) for Terpenoid Indole Alkaloid Biosynthesis*
| Technology | Measured Analytic | Spatial Resolution | Key Quantitative Finding | Biological Insight |
|---|---|---|---|---|
| Visium Spatial Transcriptomics | mRNA (Gene Expression) | 55 µm spot diameter | TDC (Tryptophan decarboxylase) expression localized to 85% of epidermal cells. | Early pathway steps occur widely in the epidermis. |
| MALDI-TOF IMS | Small Molecules (Metabolites) | 20 µm pixel size | Vindoline precursor (m/z 457.2) concentrated in idioblast cells (avg. intensity 15x higher than mesophyll). | Late-stage vindoline biosynthesis is highly cell-type specific. |
| Integrated Correlation | Gene-Metabolite Pair | N/A (Registered images) | Spatial correlation coefficient (Pearson's r) of 0.78 between DAT (Deacetylvindoline acetyltransferase) expression and acetylated product signal. | Strong evidence for DAT function in planta and its metabolic niche. |
Real-Time Metabolomics: Capturing Metabolic Dynamics
Real-time metabolomics aims to monitor metabolic fluxes and transient intermediate pools with high temporal resolution, moving beyond static "snapshots."
Core Technology: Live Single-Cell Mass Spectrometry
Techniques like live single-cell mass spectrometry (LiveSC-MS) and microsampling coupled to rapid MS enable kinetic studies.
Methodology (Probe-Based Microsampling for Live Tissue):
- Microsampling: A sharp, hollow microprobe (tip diameter ~10 µm) is inserted into a single cell or specific tissue region (e.g., a resin duct) under a microscope.
- Nano-Electrospray Ionization (nano-ESI): The minute volume (picoliters) of sap is directly infused into a high-resolution mass spectrometer via a nano-ESI emitter.
- Time-Course Experiment: The same cell/tissue region can be sampled repeatedly over minutes to hours following a stimulus (e.g., jasmonic acid elicitation, wounding, light change).
- Data Acquisition: The MS operates in rapid, full-scan mode (e.g., 1 scan/second), capturing the rise and fall of metabolite intensities over time.
Key Experimental Protocol: Kinetic Profiling of Elicitor Response
Protocol for Monitoring Phytoalexin Biosynthesis in Soybean Cotyledons:
- Plant Material & Elicitation: Germinate soybean seeds. At the cotyledon stage, treat one set with a fungal elicitor (e.g., chitosan) and maintain another as a control.
- Microsampling Setup: Immobilize a cotyledon under a stereomicroscope. Position a micromanipulator-controlled nano-electrospray ionization (nano-DESI) probe on the surface of a predetermined parenchyma cell region.
- Real-Time MS Analysis: Initiate MS data acquisition. Apply the elicitor solution directly to the tissue adjacent to the probe. Continuously acquire mass spectra in negative ion mode for 60 minutes.
- Data Processing: Extract ion chromatograms for known glyceollin precursors (e.g., daidzein, m/z 253.05) and final phytoalexins (glyceollin I, m/z 339.12). Plot intensity vs. time. Calculate apparent production rates from the slopes of the linear phase.
Data Presentation: Real-Time Metabolomics Outputs
Table 2: Kinetic Parameters Derived from Real-Time Metabolomics of Elicited Soybean Cotyledons
| Metabolite (m/z) | Putative Identity | Baseline Intensity (Counts) | Time to First Detectable Increase (min post-elicitation) | Maximum Accumulation Rate (Counts/min) | Time to Peak (min) |
|---|---|---|---|---|---|
| 253.0506 | Daidzein (Precursor) | 1,500 | 8.2 | 450 | 45 |
| 285.0400 | 2'-Hydroxydaidzein | 200 | 14.5 | 1,200 | 55 |
| 339.1234 | Glyceollin I (Final Product) | 50 | 32.0 | 850 | 90 |
The Scientist's Toolkit: Key Research Reagent Solutions
Table 3: Essential Materials for Spatial Omics and Real-Time Metabolomics in Plant Research
| Item | Function | Example Product/Supplier |
|---|---|---|
| Cryostat | To produce thin, high-quality tissue sections from frozen plant specimens for spatial analysis. | Leica CM1950; Thermo Fisher Scientific HM525 NX |
| Spatial Transcriptomics Slide | Glass slide pre-printed with spatially barcoded oligonucleotides for capturing and tagging mRNA in situ. | 10x Genomics Visium for FFPE or Fresh Frozen Tissue |
| MALDI Matrix | Organic compound that co-crystallizes with sample, absorbs laser energy, and promotes analyte ionization for IMS. | α-Cyano-4-hydroxycinnamic acid (CHCA) for metabolites; Sinapinic Acid (SA) for proteins |
| Conductive Glass Slides (IMS) | Specially coated slides required for MALDI-TOF IMS to prevent surface charging during laser ablation. | Bruker MTP Slideframe; ITO-coated slides |
| Nano-DESI or Live Cell Probe | A microsampling probe for extracting minute volumes of cellular sap for real-time, in vivo MS analysis. | Custom-built nano-DESI source; BioTech Tools Live Single Cell MS Probes |
| High-Resolution Mass Spectrometer | The core analytical instrument providing accurate mass measurements for metabolite identification and imaging. | Thermo Fisher Orbitrap Exploris MX; Bruker timsTOF flex; Sciex ZenoTOF 7600 |
| Image Registration Software | Software to align and correlate multi-modal images (e.g., H&E, fluorescence, IMS, transcriptomics). | Akoya Phenochart/BioFormats; MATLAB Image Processing Toolbox |
| Stable Isotope Tracers (¹³C, ¹⁵N) | For flux analysis, to trace the incorporation of labeled atoms through biosynthetic pathways in real-time. | Cambridge Isotope Laboratories (¹³C-Glucose, ¹⁵N-Nitrate) |
Visualization of Integrated Multi-Omics Workflow
Title: Integrated Spatio-Temporal Omics Workflow for PNP Research
Title: Technology Integration Resolves PNP Pathway Steps
The integration of Spatial Omics and Real-Time Metabolomics represents a paradigm shift for multi-omics strategies in plant natural product research. By resolving the "where" and "when" of biosynthetic events, these technologies transform static pathway diagrams into dynamic, spatially explicit models. This empowers researchers to pinpoint rate-limiting steps, discover novel cell-type-specific enzymes, and rationally engineer plant metabolic systems for sustainable production of pharmaceuticals, nutraceuticals, and other valuable compounds. Their adoption is essential for advancing the core thesis of a fully integrated, predictive understanding of plant metabolism.
Within plant natural product biosynthesis research, multi-omics studies are pivotal for deconvoluting the complex pathways that produce valuable bioactive compounds. However, the true value of these resource-intensive projects hinges on the rigorous quantification of their impact. This guide defines the critical success metrics, moving beyond descriptive analyses to provide a framework for quantifiable validation and discovery.
Part 1: Core Impact Metrics Framework
The impact of a multi-omics study can be quantified across three sequential pillars: Data Quality, Biological Insight, and Translational Output. The following table summarizes the key quantitative metrics for each pillar.
Table 1: Core Quantitative Metrics for Multi-Omics Impact Assessment
| Pillar | Metric Category | Specific Metric | Target/Interpretation |
|---|---|---|---|
| Data Quality | Technical Performance | Sequencing Depth (RNA-seq) | >20-30M reads/sample for plant tissues. |
| MS1/MS2 Spectral Count/Quality | >70% high-quality MS2 spectra for ID. | ||
| Reproducibility | Pearson/Spearman Correlation (replicates) | R > 0.9 for technical, >0.8 for biological. | |
| Coefficient of Variation (CV) | <20% for proteomics/transcriptomics. | ||
| Biological Insight | Discovery Yield | Novel Gene Candidates Identified | # of transcription factors/enzymes linked to pathway. |
| Metabolite-Gene Correlations | # of statistically significant (p<0.01) correlations. | ||
| Validation Rate | Candidates Experimentally Validated | % of candidates confirmed via functional assays. | |
| Systems-Level Resolution | Pathway/Network Completeness | % of known pathway steps resolved + new nodes added. | |
| Translational Output | Practical Utility | Engineered Yield Improvement | % increase in target compound in heterologous host. |
| Novel Analogs Discovered | # of previously unreported natural product derivatives. | ||
| Resource Value | Community Dataset Re-use | # of subsequent citations, GEO/SRA download counts. |
Part 2: Methodological Protocols for Key Validation Experiments
To transition from correlation to causation, candidate genes identified via multi-omics integration must be functionally validated.
Protocol 1: Heterologous Expression for Enzyme Function Characterization
- Objective: To validate the catalytic activity of a cytochrome P450 candidate identified from transcriptomics-metabolomics correlation.
- Reagents: Saccharomyces cerevisiae strain WAT11 (engineered for plant P450 expression), pYES-DEST52 expression vector, target compound substrate, LC-MS/MS system.
- Procedure:
- Clone the candidate P450 gene into pYES-DEST52.
- Transform into WAT11 yeast strain. Induce expression with galactose.
- Feed microsomal extracts or live cultures with putative substrate.
- After incubation, extract metabolites and analyze via targeted LC-MS/MS.
- Quantification: Compare product peak area in test vs. empty vector control. Calculate conversion rate (%) and kinetic parameters (Km, kcat).
Protocol 2: CRISPR-Cas9 Mediated Gene Knockout in Plant Hairy Roots
- Objective: To confirm the in-planta role of a gene in biosynthetic pathway flux.
- Reagents: Agrobacterium rhizogenes strain K599, CRISPR-Cas9 binary vector (pFGC-pcoCas9), target plant seedlings, UHPLC-HRMS.
- Procedure:
- Design and clone sgRNA targeting the candidate gene into the binary vector.
- Transform A. rhizogenes with the construct.
- Infect stem segments of host plant, induce transgenic hairy roots.
- Genotype roots by PCR/sequencing to identify knockout lines.
- Extract metabolites from wild-type and knockout root lines.
- Quantification: Use UHPLC-HRMS to measure absolute levels (µg/g DW) of pathway intermediates and end products. A significant drop (>70%) in target compound confirms involvement.
Part 3: Visualizing Integration and Workflow
A successful multi-omics study relies on a coherent integration strategy.
Multi-Omics Data Integration Pathway
Jasmonate-Induced Terpenoid Biosynthesis Pathway
Part 4: The Scientist's Toolkit: Research Reagent Solutions
Table 2: Essential Research Reagents for Plant Multi-Omics Validation
| Reagent/Material | Supplier Examples | Primary Function in Validation |
|---|---|---|
| Plant-Specific Expression Vectors (e.g., pEAQ-HT, pCAMBIA) | Addgene, CAMBIA | Stable, high-yield heterologous expression of biosynthetic genes in plants or transient systems. |
| Yeast Strains for Heterologous Expression (e.g., WAT11, BY4741) | Euroscarf, ATCC | Specialized hosts for functional characterization of plant P450s and transporters. |
| CRISPR-Cas9 Binary Vectors for Plants (e.g., pFGC-pcoCas9, pHEE401) | Addgene, Academia | Enables targeted gene knockouts or edits in plant hairy roots or whole plants. |
| Stable Isotope-Labeled Precursors (e.g., ¹³C-Glucose, ¹⁵N-Nitrate) | Cambridge Isotope Labs, Sigma-Aldrich | Tracer for flux analysis, elucidating pathway architecture and kinetics. |
| Authentic Chemical Standards | Phytolab, ChromaDex, Sigma-Aldrich | Essential for absolute quantification (calibration curves) and metabolite identification by LC-MS. |
| LC-MS Grade Solvents & Columns (e.g., C18, HILIC) | Fisher Chemical, Waters, Agilent | Ensure high-resolution separation and sensitive, reproducible mass spectrometry detection. |
| Commercial Enzyme Assay Kits (e.g., MEP/DOXP pathway) | Agrisera, Merck | Provide standardized, colorimetric/fluorometric assays for key pathway intermediate quantification. |
Note: Indicates a critical reagent for advanced kinetic and flux metrics.
Conclusion
Multi-omics integration has transitioned from a promising concept to an essential, synergistic framework for deconstructing the complex biosynthesis of plant natural products. By sequentially establishing genomic foundations, applying integrative methodological pipelines, overcoming analytical bottlenecks, and employing rigorous validation, researchers can systematically bridge the gap between genetic potential and chemical output. This paradigm accelerates the discovery of novel bioactive compounds and provides the precise genetic blueprints required for their sustainable bioproduction through synthetic biology. Future directions point towards the incorporation of real-time, single-cell, and spatial omics data, promising unprecedented resolution of plant metabolic networks. For biomedical research, these advancements directly translate to an accelerated pipeline for plant-derived drug lead discovery, optimization, and scalable manufacturing, reinforcing the critical role of plant biochemistry in addressing unmet clinical needs.