GC-MS vs LC-MS for Plant Metabolomics: A Comprehensive 2024 Comparison for Research & Pharma
This article provides a detailed comparison of Gas Chromatography-Mass Spectrometry (GC-MS) and Liquid Chromatography-Mass Spectrometry (LC-MS) for plant metabolite profiling.
GC-MS vs LC-MS for Plant Metabolomics: A Comprehensive 2024 Comparison for Research & Pharma
Abstract
This article provides a detailed comparison of Gas Chromatography-Mass Spectrometry (GC-MS) and Liquid Chromatography-Mass Spectrometry (LC-MS) for plant metabolite profiling. Aimed at researchers and drug development professionals, it explores the foundational principles, optimal methodological applications, common troubleshooting strategies, and validation frameworks for both platforms. We synthesize current best practices to guide instrument selection, method optimization, and data interpretation, empowering scientists to design robust metabolomics workflows for biomarker discovery, phytochemistry, and natural product development.
GC-MS and LC-MS Demystified: Core Principles for Plant Metabolite Analysis
Plant metabolomics is the comprehensive, systematic study of the unique chemical fingerprints (metabolites) produced by plant cells. It provides a direct functional readout of cellular activity and physiological state, bridging the gap between genotype and phenotype. The choice of analytical platform is critical, as it directly dictates the range, quantity, and quality of metabolic data that can be acquired, fundamentally shaping biological interpretations.
Core Analytical Platforms: GC-MS vs. LC-MS
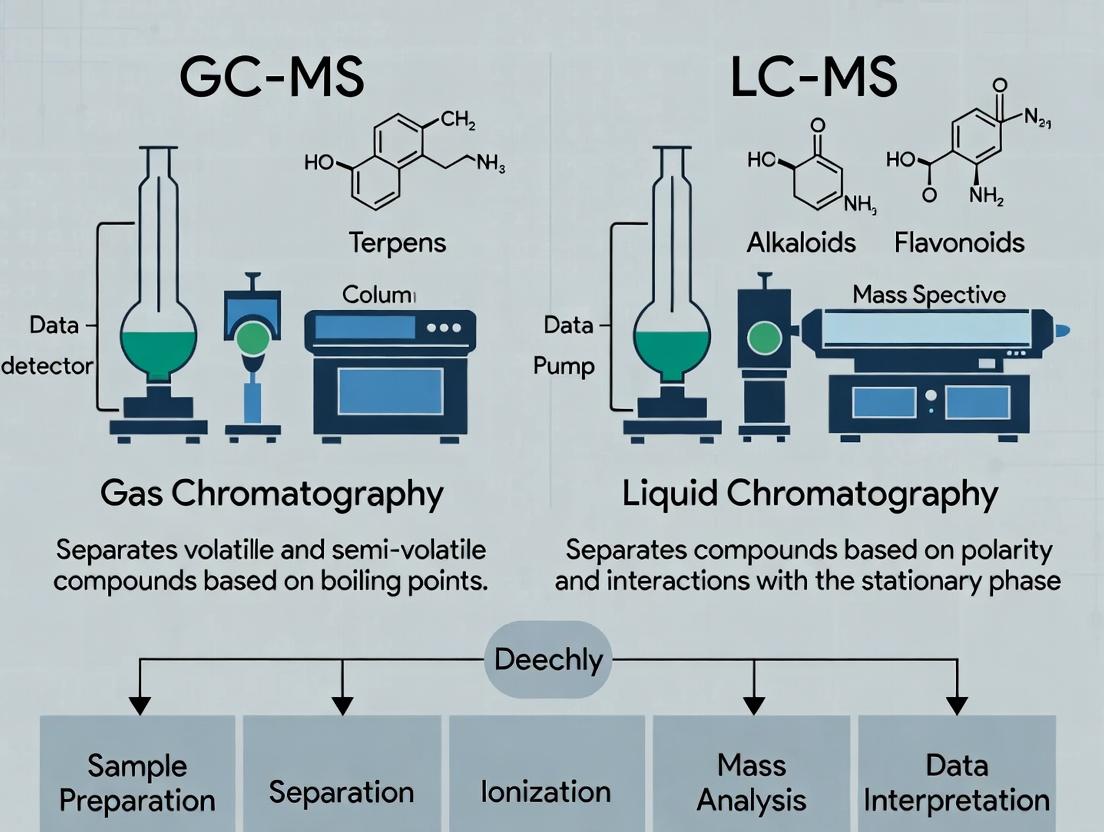
The two most prevalent platforms for untargeted plant metabolite profiling are Gas Chromatography-Mass Spectrometry (GC-MS) and Liquid Chromatography-Mass Spectrometry (LC-MS). Their complementary strengths and weaknesses define their applicability.
Comparison of Platform Characteristics
Table 1: Fundamental Comparison of GC-MS and LC-MS for Plant Metabolomics
| Feature | GC-MS | LC-MS (Reversed-Phase) |
|---|---|---|
| Analytical Principle | Separation by volatility & polarity. Requires chemical derivatization. | Separation by polarity & hydrophobicity. Typically no derivatization. |
| Optimal Molecular Weight Range | Low to medium (< 650 Da) | Broad (50 - 1500+ Da) |
| Key Metabolite Classes Profiled | Primary metabolites (sugars, amino acids, organic acids, fatty acids), volatile organics. | Secondary metabolites (alkaloids, flavonoids, terpenoids), lipids, semi-polar compounds, peptides. |
| Sample Preparation | Requires derivatization (methoximation & silylation). Can be destructive to labile compounds. | Simpler; often protein precipitation & filtration. Preserves labile species. |
| Chromatography Reproducibility | Excellent (highly standardized) | Good; can be more variable. |
| Library Matching | Highly reliable with commercial EI spectral libraries. | Less standardized; depends on in-house or public MS/MS libraries. |
| Quantitation | Highly robust with internal standards. | Robust, requires class-specific standards for absolute quantitation. |
| Throughput | High | High to medium |
Experimental Data Comparison
Recent studies directly comparing the two platforms highlight their complementary outputs from the same biological sample.
Table 2: Experimental Output from a Tomato Leaf Extract Analysis (Adapted from Current Literature)
| Metric | GC-MS (Derivatized) | LC-MS (RP, ESI+/ESI-) |
|---|---|---|
| Total Features Detected | ~250 - 350 | ~2000 - 5000 |
| Annotated Metabolites | 80 - 120 (High confidence) | 150 - 400 (Various confidence levels) |
| Identified Primary Metabolites | 65 | 25 |
| Identified Secondary Metabolites | 5 | 185 |
| Relative Standard Deviation (RSD) for QC Pool | < 10% for most annotated compounds | < 15-20% for stable features |
| Sample Run Time | 20-25 minutes | 15-20 minutes per polarity |
Detailed Experimental Protocols
The following protocols are standard for comprehensive, untargeted plant metabolomics studies.
Protocol 1: GC-MS Analysis of Plant Tissue
- Extraction: Homogenize 50-100 mg frozen plant powder in a 1:1:1 mixture of cold methanol, water, and chloroform. Centrifuge.
- Derivatization: Dry an aliquot of the polar phase under N₂ gas.
- Methoximation: Add 20 µL of 20 mg/mL methoxyamine hydrochloride in pyridine. Incubate at 37°C for 90 min.
- Silylation: Add 80 µL of N-methyl-N-(trimethylsilyl)trifluoroacetamide (MSTFA). Incubate at 37°C for 30 min.
- GC-MS Analysis:
- Column: 30 m DB-5MS capillary column.
- Inlet: 250°C, split mode (10:1 to 25:1).
- Oven Program: Hold at 60°C for 1 min, ramp to 330°C at 10°C/min, hold for 5 min.
- MS: Electron Impact (EI) ion source at 70 eV, scan range m/z 50-600.
Protocol 2: LC-MS Analysis of Plant Tissue (Reversed-Phase)
- Extraction: Homogenize 50 mg frozen powder in 1 mL of 80% methanol with 0.1% formic acid. Vortex, sonicate in ice bath, centrifuge at high speed. Filter supernatant (0.22 µm).
- LC-MS Analysis (HILIC for polar metabolites is also common):
- Column: C18 column (e.g., 2.1 x 100 mm, 1.8 µm).
- Mobile Phase: A) Water + 0.1% Formic Acid; B) Acetonitrile + 0.1% Formic Acid.
- Gradient: 2% B to 98% B over 12-18 min, re-equilibrate.
- MS: High-resolution Q-TOF or Orbitrap mass spectrometer.
- Ionization: ESI positive and negative mode switching. Data-Dependent Acquisition (DDA) for MS/MS.
Visualization: Platform Selection Workflow
Title: Decision Workflow for GC-MS vs. LC-MS Platform Selection
Visualization: Metabolite Extraction & Analysis Workflow
Title: Parallel GC-MS and LC-MS Plant Metabolomics Workflow
The Scientist's Toolkit: Key Research Reagent Solutions
Table 3: Essential Reagents & Materials for Plant Metabolomics
| Item | Function | Platform Relevance |
|---|---|---|
| MSTFA (N-Methyl-N-(trimethylsilyl)trifluoroacetamide) | Silylation derivatization agent; replaces active hydrogens with TMS groups, increasing volatility for GC-MS. | GC-MS Critical |
| Methoxyamine Hydrochloride | Methoximation agent; protects carbonyl groups (e.g., in sugars) and prevents multiple peak formation during derivatization. | GC-MS Critical |
| Stable Isotope-Labeled Internal Standards (e.g., ¹³C, ²H) | Used for retention time alignment, signal normalization, and absolute quantitation. Corrects for technical variability. | GC-MS & LC-MS |
| LC-MS Grade Solvents (MeOH, ACN, Water) | Ultra-high purity solvents minimize background ions and ion suppression, ensuring high-quality MS data. | LC-MS Critical |
| Formic Acid / Ammonium Acetate | Common volatile additives for LC mobile phases to enhance ionization efficiency in positive (FA) or negative (AA) ESI modes. | LC-MS Critical |
| Solid Phase Extraction (SPE) Cartridges (C18, HILIC) | For sample clean-up or fractionation to reduce matrix complexity and ion suppression. | LC-MS (common) |
| NIST / Fiehn / GMD EI Mass Spectral Libraries | Commercial reference libraries for confident metabolite identification from EI spectra. | GC-MS Critical |
| Quality Control (QC) Pool Sample | A pooled aliquot of all study samples; injected repeatedly to monitor system stability and for data normalization. | GC-MS & LC-MS |
The choice between GC-MS and LC-MS is not a matter of which is superior, but which is most fit-for-purpose. GC-MS remains the gold standard for robust, quantitative analysis of primary metabolism and volatiles. LC-MS offers unparalleled breadth in capturing the diverse landscape of plant secondary metabolites and complex lipids. For a truly holistic view of the plant metabolome, a dual-platform approach, despite its complexity and cost, provides the most comprehensive coverage. The experimental design must therefore begin with clear biological questions, which will dictate the optimal platform and ultimately determine the depth and accuracy of the metabolic insights gained.
Gas Chromatography-Mass Spectrometry (GC-MS) remains a cornerstone analytical technique, particularly for the analysis of volatile and semi-volatile compounds. Its role in plant metabolite profiling, especially for primary metabolites like organic acids, sugars, and amino acids, is defined by core principles. This guide objectively compares the performance of GC-MS workflows against alternative approaches, framing the discussion within the broader thesis of comparing GC-MS and LC-MS for metabolomics research.
The Volatility Imperative and Derivatization
GC requires analytes to be volatile and thermally stable. Most polar plant metabolites (e.g., sugars, organic acids) are not amenable to GC in their native form. This is addressed through chemical derivatization, a performance-critical step compared to LC-MS, which often analyzes underivatized samples.
- Performance Comparison: Derivatization enables GC analysis but introduces complexity and potential for artifact formation. LC-MS avoids this step, streamlining sample preparation for a broader polarity range.
Table 1: Comparison of Common Derivatization Reagents for GC-MS Metabolomics
| Reagent (Function) | Target Compound Classes | Key Advantages | Key Disadvantages vs. LC-MS Alternative |
|---|---|---|---|
| MSTFA (Methylsilylation) | Alcohols, carboxylic acids, amines, thiols. | Comprehensive, single-step reagent. Forms volatile, stable derivatives. | Hydrolysis-sensitive. Extra step required. LC-MS typically uses no silylation. |
| Methoxyamine + MSTFA (Methoximation + Methylsilylation) | Reducing sugars, keto-acids. | Prevents sugar ring formation, yielding single chromatographic peaks. | Two-step protocol increases preparation time and complexity. |
| Methyl Chloroformate (Alkyloxycarbonylation) | Amino acids, organic acids. | Fast, aqueous-phase reaction. | Limited scope compared to silylation. LC-MS can directly inject aqueous extracts. |
Experimental Protocol (Typical Derivatization for Plant Metabolites):
- Sample Preparation: Lyophilize 50-100 mg of plant tissue. Homogenize and extract with 1.5 mL of a 2:2:1 (v/v/v) methanol:water:chloroform solvent mix.
- Drying: Evaporate the polar (methanol/water) phase to complete dryness under a gentle nitrogen stream.
- Methoximation: Resuspend the dried extract in 50 µL of methoxyamine hydrochloride in pyridine (20 mg/mL). Incubate at 37°C for 90 minutes with shaking.
- Silylation: Add 100 µL of MSTFA (with 1% TMCS as catalyst). Incubate at 37°C for 30 minutes.
- Analysis: Centrifuge and transfer 100 µL of the supernatant to a GC vial for injection.
Electron Impact (EI) Ionization: Reproducibility vs. Molecular Ion Integrity
The standard ionization source in GC-MS is 70 eV Electron Impact (EI). This high-energy process generates reproducible, library-searchable fragmentation patterns.
- Performance Comparison: EI's major strength is the generation of consistent, compound-specific spectral libraries (e.g., NIST, Wiley). This allows for high-confidence identification of known compounds. The primary weakness is the frequent lack of a detectable molecular ion ([M]+•), complicating the identification of unknown metabolites. This contrasts sharply with LC-MS soft ionization sources (e.g., ESI, APCI), which predominantly yield intact molecular ions ([M+H]+ or [M-H]-).
Table 2: EI Ionization vs. LC-MS Soft Ionization for Metabolite ID
| Parameter | GC-MS (EI) | LC-MS (ESI/APCI) | Performance Implication |
|---|---|---|---|
| Ionization Energy | High (70 eV) | Low (Soft) | EI causes extensive fragmentation; ESI preserves molecular ion. |
| Spectral Reproducibility | Very High (Instrument-independent) | Moderate (Instrument-dependent) | EI spectra are universal, enabling robust library matching. |
| Molecular Ion Detection | Often absent or weak | Consistently strong | EI complicates molecular formula assignment for unknowns. |
| Identification Basis | Library match (Retention Index + Spectrum) | Exact mass, MS/MS fragmentation, library. | EI offers higher confidence for knowns in library; ESI excels for novel compound characterization. |
Experimental Protocol (GC-MS Analysis with EI):
- GC Conditions: Use a 30m DB-5MS capillary column. Inject 1 µL in split or splitless mode. Oven program: 70°C (hold 2 min), ramp at 10°C/min to 320°C (hold 5 min). Helium carrier gas, constant flow.
- MS Conditions (EI): Ion source temperature: 230°C. Transfer line: 280°C. Electron energy: 70 eV. Scan range: m/z 50-650. Solvent delay: set as per method.
Visualization: GC-MS Workflow for Plant Metabolomics
Title: GC-MS Metabolomics Workflow & Key Steps
The Scientist's Toolkit: Key Research Reagent Solutions
| Item | Function in GC-MS Metabolomics |
|---|---|
| MSTFA (N-Methyl-N-(trimethylsilyl)trifluoroacetamide) | Primary silylation reagent; replaces active hydrogens with trimethylsilyl groups, imparting volatility and thermal stability. |
| Methoxyamine Hydrochloride | Converts carbonyl groups (aldehydes, ketones) to methoximes, preventing ring tautomerism in sugars and simplifying chromatography. |
| Retention Index Marker Mix (e.g., Alkane Series, C8-C30) | Injected in a separate run to calculate Kovats Retention Indices (RI), adding a secondary identification parameter alongside mass spectrum. |
| NIST/ Wiley GC-MS Spectral Library | Commercial database containing hundreds of thousands of 70 eV EI mass spectra for compound identification via spectral matching. |
| Derivatization-Grade Pyridine | Anhydrous solvent for derivatization reactions; must be dry to prevent hydrolysis and inefficiency of silylation reagents. |
Within the broader research context of comparing GC-MS and LC-MS for plant metabolite profiling, the choice of ionization technique and polarity mode in LC-MS is paramount. Unlike GC-MS, which typically employs electron impact ionization, LC-MS requires soft ionization techniques at atmospheric pressure to handle liquid-phase analytes. Electrospray Ionization (ESI) and Atmospheric Pressure Chemical Ionization (APCI) are the two most prevalent techniques, each with distinct mechanisms and applicability dictated by analyte polarity, molecular weight, and thermal stability.
Core Principles and Comparative Mechanism
Polarity in LC-MS Analysis
LC-MS analyses are conducted in either positive or negative ionization mode. The choice fundamentally affects which metabolites are detected and the sensitivity of the measurement.
- Positive Ion Mode (+): Suitable for analytes that readily accept a proton (H⁺) or another cation (e.g., Na⁺, NH₄⁺). Commonly used for bases (e.g., alkaloids, amines).
- Negative Ion Mode (-): Suitable for analytes that readily donate a proton or accept an anion. Commonly used for acids (e.g., phenolic acids, organic acids, flavonoids).
Most comprehensive plant metabolite profiling requires sequential runs in both polarities.
Electrospray Ionization (ESI)
ESI is a soft ionization technique ideal for polar, thermally labile, and high molecular weight compounds. A high voltage is applied to a liquid sample, creating a fine aerosol of charged droplets. As the solvent evaporates, the droplets shrink until Coulombic forces overcome surface tension, leading to the release of gas-phase ions via the ion evaporation model.
Atmospheric Pressure Chemical Ionization (APCI)
APCI is also a soft ionization technique but involves a different mechanism. The sample solution is vaporized by a heated nebulizer. A corona discharge needle then ionizes the nebulizer gas (e.g., N₂) and vaporized solvent molecules, which subsequently transfer charge to the analyte molecules through gas-phase chemical reactions. APCI is less sensitive to sample salinity and more suited to less polar, thermally stable, and low-to-medium molecular weight compounds.
Performance Comparison: ESI vs. APCI for Plant Metabolites
The selection between ESI and APCI significantly impacts the coverage and quality of plant metabolite data. The following table summarizes their comparative performance based on key parameters relevant to plant research.
Table 1: ESI vs. APCI Performance for Plant Metabolite Profiling
| Parameter | Electrospray Ionization (ESI) | Atmospheric Pressure Chemical Ionization (APCI) |
|---|---|---|
| Optimal Polarity | Excellent for both positive & negative modes. | Good for both, but often slightly better in positive mode. |
| Analyte Polarity | Ideal for polar and ionic compounds (e.g., glycosides, amino acids, alkaloids). | Ideal for low-to-medium polarity compounds (e.g., terpenes, steroids, some flavonoids). |
| Molecular Weight Range | Very broad; effective for small molecules up to large proteins. | Typically limited to small/medium molecules (< 1500 Da). |
| Thermal Lability | Excellent; process occurs at room temperature. | Moderate; requires vaporization (typical probe temp: 350-500°C). |
| Matrix Effects/Salts | Highly susceptible to ion suppression from salts & co-eluting compounds. | Less susceptible to ion suppression from salts. |
| Ionization Mechanism | Charge transfer in liquid phase / ion evaporation. | Gas-phase chemical ionization (proton transfer, charge exchange). |
| Typical Ion Types | [M+H]⁺, [M+Na]⁺, [M-H]⁻, multiply charged ions. | [M+H]⁺, [M-H]⁻, [M]⁺• (for low polarity compounds). |
| Key Strength in Plant Profiling | Unmatched for polar primary & secondary metabolites. | Better for non-polar lipids, terpenoids, and apolar volatiles. |
| Common Artefacts | Adduct formation (Na⁺, K⁺, NH₄⁺) can complicate spectra. | In-source fragmentation can be more pronounced. |
Experimental Protocols for Comparative Analysis
A standard protocol to evaluate and compare ESI and APCI for a given plant extract is outlined below.
Protocol 1: Method Comparison for Untargeted Profiling
- Sample Preparation: Homogenize plant tissue (e.g., 100 mg) in 80% methanol/water (1 mL). Sonicate for 15 minutes, centrifuge (15,000 g, 10 min, 4°C). Filter supernatant (0.2 µm PTFE) prior to LC-MS analysis.
- LC Conditions: Use a reversed-phase C18 column (e.g., 2.1 x 100 mm, 1.7 µm). Mobile phase A: Water with 0.1% Formic Acid; B: Acetonitrile with 0.1% Formic Acid. Gradient: 5% B to 95% B over 20 min. Flow rate: 0.3 mL/min. Column temp: 40°C.
- MS Conditions (ESI): Source Temp: 150°C, Desolvation Temp: 350°C, Capillary Voltage: 3.0 kV (positive) or 2.5 kV (negative), Cone Voltage: 30 V. Data acquired in full scan mode (m/z 50-1200).
- MS Conditions (APCI): Source Temp: 150°C, Probe Temp: 450°C, Corona Current: 4 µA. Cone Voltage: 30 V. Data acquired in full scan mode (m/z 50-1200).
- Data Analysis: Process raw data using software (e.g., Progenesis QI, MS-DIAL). Align features, perform peak picking, and deconvolution. Compare the total number of detected features, signal intensity for representative compound classes, and reproducibility (%RSD of QC samples) between the two ionization sources.
Protocol 2: Sensitivity & Linearity Test for Targeted Metabolites
- Standards: Prepare calibration curves (e.g., 0.1-1000 ng/mL) for a panel of representative plant metabolites (e.g., chlorogenic acid [polar], rutin [mid-polar], β-sitosterol [non-polar]).
- Analysis: Inject each calibration level in triplicate using the ESI and APCI methods described above.
- Evaluation: Determine linear regression (R²), limit of detection (LOD, S/N=3), and limit of quantification (LOQ, S/N=10) for each compound with both sources.
Table 2: Example Experimental Data for Model Plant Metabolites
| Compound (Class) | Ionization Source | Optimal Polarity | Linear Range (ng/mL) | R² | LOD (ng/mL) | LOQ (ng/mL) | Observed Ion |
|---|---|---|---|---|---|---|---|
| Chlorogenic Acid (Phenolic Acid) | ESI | Negative | 1-1000 | 0.999 | 0.3 | 1.0 | [M-H]⁻ |
| APCI | Negative | 10-1000 | 0.995 | 3.0 | 10.0 | [M-H]⁻ | |
| Rutin (Flavonoid Glycoside) | ESI | Negative | 0.5-500 | 0.998 | 0.15 | 0.5 | [M-H]⁻ |
| APCI | Negative | 5-500 | 0.992 | 1.5 | 5.0 | [M-H]⁻ | |
| β-Sitosterol (Phytosterol) | ESI | Positive | 50-1000 | 0.980 | 15.0 | 50.0 | [M+H-H₂O]⁺ |
| APCI | Positive | 1-1000 | 0.999 | 0.3 | 1.0 | [M+H-H₂O]⁺ |
Visualization of Workflows and Relationships
Figure 1: Comparative workflow of ESI and APCI ionization mechanisms.
Figure 2: Decision logic for selecting ESI or APCI based on analyte properties.
The Scientist's Toolkit: Key Research Reagent Solutions
Table 3: Essential Materials for LC-MS Plant Metabolite Profiling
| Item | Function in ESI/APCI Analysis |
|---|---|
| LC-MS Grade Solvents (Water, Methanol, Acetonitrile) | Minimize chemical noise and ion suppression; essential for reproducible, high-sensitivity results. |
| Volatile Ion-Pairing Agents (e.g., Formic Acid, Ammonium Formate/Acetate) | Modifies mobile phase pH to promote analyte ionization in positive or negative mode. Improves chromatographic peak shape. |
| Stable Isotope Labeled Internal Standards (¹³C, ¹⁵N, ²H) | Corrects for matrix effects and ionization variability; enables absolute quantification in targeted assays. |
| Solid Phase Extraction (SPE) Cartridges (C18, HILIC, Mixed-Mode) | Pre-concentrates metabolites and removes salts/phospholipids that cause severe ion suppression, especially in ESI. |
| Quality Control (QC) Pooled Sample | A homogeneous pool of all study samples; injected regularly to monitor system stability and for data normalization in untargeted studies. |
| Retention Time Index Standards | A cocktail of compounds spanning the chromatographic run; aids in correcting for minor retention time shifts across large batches. |
| Needle Wash Solvents (e.g., High Water/High Organic) | Prevents cross-contamination between injections in the autosampler, critical for low-abundance metabolites. |
This comparison guide objectively evaluates the performance of Gas Chromatography-Mass Spectrometry (GC-MS) and Liquid Chromatography-Mass Spectrometry (LC-MS) for profiling different classes of plant metabolites. The analysis is framed within the thesis that these platforms are complementary, with each natively accessing distinct regions of the plant metabolome based on the physicochemical properties of the analytes.
Core Platform Comparison & Chemical Space Coverage
The fundamental separation mechanisms define the "native" metabolite classes for each platform.
Diagram Title: Chemical Space Coverage of GC-MS vs LC-MS for Plant Metabolites
Quantitative Performance Comparison
Data compiled from recent methodological studies and reviews.
Table 1: Native Metabolite Class Coverage & Analytical Performance
| Metabolite Class | Example Compounds | Native Platform | Typical Detected # (Range) | Ionization Method | Throughput (Samples/Day) |
|---|---|---|---|---|---|
| Terpenes (Volatile) | Monoterpenes, Sesquiterpenes | GC-MS | 50-200 | Electron Ionization (EI) | 20-40 |
| Fatty Acids & Lipids | Free fatty acids, Sterols | GC-MS (after derivatization) | 100-300 | EI | 20-40 |
| Primary Polar Metabolites | Sugars, Amino acids, Organic acids | GC-MS (after derivatization) | 80-150 | EI | 15-30 |
| Phenolic Compounds | Flavonoids, Lignans, Tannins | LC-MS | 200-1000+ | ESI(-)/ESI(+) | 15-30 |
| Alkaloids | Nicotine, Caffeine, Morphine | LC-MS | 100-500 | ESI(+) | 15-30 |
| Glycosides | Glucosinolates, Saponins, Cardiac glycosides | LC-MS | 150-600 | ESI(-)/ESI(+) | 15-30 |
| High MW/ Thermolabile | Peptides, Non-volatile oils | LC-MS | Variable | ESI, APCI | 15-30 |
Table 2: Methodological Characteristics & Suitability
| Parameter | GC-MS | LC-MS (HRAM) |
|---|---|---|
| Sample Prep Complexity | High (often requires derivatization) | Medium (extraction, sometimes fractionation) |
| Reproducibility (RSD %) | Excellent (3-10%) | Good to Moderate (5-20%) |
| Spectral Libraries | Robust, universal EI libraries | Limited, often require in-house libraries |
| Quantitation | Excellent (reliable internal standards) | Good (requires isotopically labeled standards) |
| Structural Confidence | High (EI fragmentation + RI) | High (with MS/MS, HRAM) |
| Ideal Research Goal | Targeted profiling of primary/volatile metabolites | Untargeted discovery, secondary metabolites |
Experimental Protocols for Cross-Platform Comparison
Protocol 1: Comprehensive Leaf Metabolite Profiling Workflow
This protocol is designed to capture the strengths of both platforms from a single plant tissue sample.
1. Sample Preparation (Common for Both Platforms):
- Freeze-dry 50 mg of homogenized leaf tissue.
- Extract using 1.5 mL of methanol:water:chloroform (2.5:1:1, v/v/v) with 10 µL of internal standard mix (e.g., ribitol for GC, 13C-labeled compounds for LC).
- Sonicate for 15 min, centrifuge at 14,000 g for 10 min.
- Split supernatant into two equal aliquots (for GC and LC analysis).
2. GC-MS Derivative Preparation & Analysis:
- Dry one aliquot completely under a nitrogen stream.
- Derivatize by methoximation (20 µL of 20 mg/mL methoxyamine HCl in pyridine, 90 min, 30°C) followed by silylation (80 µL of MSTFA, 30 min, 37°C).
- GC-MS Parameters: Column: 30 m DB-5MS; Oven: 70°C (2 min) to 325°C at 10°C/min; Carrier: He; Ionization: EI at 70 eV; Scan: m/z 50-600.
3. LC-HRMS Analysis:
- Dry the second aliquot and reconstitute in 100 µL of initial mobile phase.
- LC-HRMS Parameters (RP): Column: C18 (100 x 2.1 mm, 1.7 µm); Mobile Phase: (A) Water + 0.1% Formic acid, (B) Acetonitrile + 0.1% Formic acid; Gradient: 5-95% B over 25 min; Ionization: ESI +/- in separate runs; MS: Full scan m/z 100-1500 at 120,000 resolution; Data-dependent MS/MS.
Protocol 2: Volatile Organic Compound (VOC) Profiling
Headspace Solid-Phase Microextraction (HS-SPME) GC-MS:
- Place 100 mg fresh tissue in a 20 mL vial, add 5 µL of internal standard (e.g., ethyl nonanoate).
- Incubate at 40°C for 10 min with agitation.
- Extract VOCs using a DVB/CAR/PDMS fiber for 30 min at 40°C.
- Desorb in GC inlet at 250°C for 5 min in splitless mode.
- Use same GC-MS conditions as Protocol 1.
The Scientist's Toolkit: Key Research Reagent Solutions
Table 3: Essential Materials for Plant Metabolomics
| Item / Reagent | Function & Importance |
|---|---|
| MSTFA (N-Methyl-N-(trimethylsilyl)trifluoroacetamide) | Gold-standard silylation reagent for GC-MS; derivatives polar functional groups (-OH, -COOH, -NH2) to increase volatility and thermal stability. |
| Methoxyamine Hydrochloride | Protects carbonyl groups (aldehydes, ketones) during GC derivatization to prevent tautomerization and create single, sharp peaks. |
| Deuterated / 13C-Labeled Internal Standards | Critical for LC-MS quantitation; corrects for matrix effects and ionization variability (e.g., 13C6-sucrose, D4-succinic acid). |
| Retention Index (RI) Standard Mix (Alkanes) | Injected in GC-MS runs to calculate Kovats Retention Indices, enabling library matching independent of small retention time shifts. |
| SPME Fibers (DVB/CAR/PDMS) | For headspace sampling of VOCs; non-invasive, sensitive, and allows for dynamic profiling of live plant emissions. |
| Ultra-High Purity Solvents (LC-MS Grade) | Minimizes background chemical noise and ion suppression in sensitive LC-HRMS analyses. |
| HILIC & RP Chromatography Columns | Complementary LC columns (HILIC for polar, RP for mid-nonpolar) expand coverage of the LC-amenable chemical space. |
| Commercial & In-House Spectral Libraries | EI libraries (NIST, Fiehn) for GC-ID; curated MS/MS libraries (e.g., GNPS, MassBank) for LC-MS annotation. |
The choice of platform is dictated by the biological question. The following decision pathway summarizes the selection logic.
Diagram Title: Decision Workflow for Selecting GC-MS or LC-MS
This guide compares the suitability of Gas Chromatography-Mass Spectrometry (GC-MS) and Liquid Chromatography-Mass Spectrometry (LC-MS) for profiling primary and secondary plant metabolites, such as sugars and alkaloids. The analysis is framed within a thesis on platform selection for comprehensive plant metabolomics.
Analytical Platform Comparison
The core difference lies in metabolite volatility and thermal stability. GC-MS requires derivatization for non-volatile compounds, while LC-MS directly analyzes a broader range of polar and non-polar compounds.
The following table summarizes platform performance based on recent experimental studies.
Table 1: GC-MS vs. LC-MS Performance for Key Metabolite Classes
| Metabolite Class | Example Compounds | Optimal Platform | Key Reason | Typical Limit of Detection (LOD) | Typical Analysis Time (per sample) |
|---|---|---|---|---|---|
| Primary: Sugars | Glucose, Sucrose, Fructose | GC-MS (after derivatization) | Superior separation of isomers; robust spectral libraries. | ~0.1 - 1 µM (derivatized) | 25-35 min |
| Primary: Organic Acids | Citrate, Malate, Succinate | GC-MS (after derivatization) | High resolution for low MW, volatile derivatives. | ~0.5 µM (derivatized) | 25-35 min |
| Primary: Amino Acids | Proline, Glutamate, Alanine | Either (LC-MS often preferred) | GC-MS requires derivatization; LC-MS offers direct, faster analysis. | LC-MS: ~0.01 µM; GC-MS: ~0.1 µM | LC-MS: 10-20 min; GC-MS: 25-35 min |
| Secondary: Alkaloids | Nicotine, Caffeine, Berberine | LC-MS (especially HRMS) | Handles thermolabile, non-volatile compounds without derivatization. | ~0.001 - 0.01 µM | 15-25 min |
| Secondary: Phenolics | Flavonoids, Lignans | LC-MS | Excellent for polar, high molecular weight compounds. | ~0.005 µM | 15-25 min |
| Secondary: Terpenes | Menthol, Limonene | GC-MS | Naturally volatile; excellent separation on GC columns. | ~0.05 µM | 20-30 min |
Experimental Protocols for Cross-Platform Comparison
Protocol 1: Comprehensive Plant Extract Profiling
- Objective: Compare coverage of primary and secondary metabolites from Arabidopsis thaliana leaf extract.
- Sample Prep: Lyophilize tissue, homogenize. Extract with 80% methanol/water (v/v) containing internal standards (e.g., Ribitol for GC-MS, Caffeic acid-d3 for LC-MS).
- GC-MS Protocol: Dry aliquot under N₂. Derivatize with methoxyamine hydrochloride (20 mg/mL in pyridine, 90 min, 30°C) followed by MSTFA (N-Methyl-N-(trimethylsilyl)trifluoroacetamide, 30 min, 37°C). Analyze on a 30m DB-5MS column with EI source. Temperature ramp: 70°C to 325°C.
- LC-MS Protocol: Directly inject diluted extract. Use reversed-phase C18 column (2.1 x 100 mm, 1.7 µm). Mobile phase: (A) Water 0.1% Formic Acid, (B) Acetonitrile 0.1% Formic Acid. Gradient: 5% B to 95% B over 18 min. Analyze with Q-TOF MS in ESI+ and ESI- modes.
- Data Analysis: Use NIST library (GC-EI-MS) and METLIN/HMDB (LC-ESI-MS) for identification. Compare number of annotated compounds, signal-to-noise ratio for key metabolites, and reproducibility (RSD%).
Protocol 2: Targeted Analysis of Sugars vs. Alkaloids
- Objective: Quantify glucose (primary) and caffeine (secondary) in Coffea arabica extract.
- Standard Curves: Prepare for both analytes in relevant matrices.
- GC-MS for Sugars: Derivatize standards and samples as in Protocol 1. Use Selective Ion Monitoring (SIM) for specific sugar derivatives (e.g., m/z 217, 307).
- LC-MS for Alkaloids: Inject directly. Use a HILIC column (for sugars) or C18 (for caffeine) coupled to a triple quadrupole MS. Employ Multiple Reaction Monitoring (MRM) for caffeine (m/z 195→138).
- Outcome Measure: Compare accuracy (spike recovery), precision (inter-day RSD), and LOD/LOQ between platforms for their respective optimal compound class.
Visualizing Platform Selection Logic
Title: Decision Workflow: GC-MS vs. LC-MS for Plant Metabolites
The Scientist's Toolkit: Essential Reagents & Materials
Table 2: Key Research Reagent Solutions for Plant Metabolite Profiling
| Item | Function & Application | Typical Example/Catalog |
|---|---|---|
| MSTFA (N-Methyl-N-(trimethylsilyl)trifluoroacetamide) | Silylation derivatizing agent for GC-MS. Adds trimethylsilyl groups to -OH, -COOH, -NH, making metabolites volatile and thermostable. | Sigma-Aldrich 69479 |
| Methoxyamine Hydrochloride | Used in tandem with MSTFA. Protects carbonyl groups (aldehydes, ketones) by forming methoximes, preventing multiple peaks from anomers. | Sigma-Aldrich 226904 |
| Stable Isotope-Labeled Internal Standards | Critical for quantification in both platforms. Correct for ionization suppression and extraction losses. | e.g., ¹³C-Glucose, ¹⁵N-Proline, d3-Caffeine (Cambridge Isotope Labs) |
| LC-MS Grade Solvents (MeOH, ACN, Water) | Ultra-purity solvents minimize background ions and ion suppression, essential for sensitive LC-MS detection. | Fisher Chemical Optima LC/MS Grade |
| Solid Phase Extraction (SPE) Cartridges | Clean-up and fractionate complex plant extracts to reduce matrix effects. Choice depends on analyte polarity. | e.g., Waters Oasis HLB (mixed-mode), C18, Silica |
| Retention Index Markers (for GC-MS) | n-Alkane series (e.g., C8-C40). Used to calculate retention indices for improved metabolite identification against libraries. | Restek 31632 |
| Mass Spectrometry Tuning & Calibration Solutions | Calibrate mass accuracy and optimize instrument response (essential for HRMS like Q-TOF). | Agilent ESI-L Tuning Mix, Waters Na Formate Solution |
| U/HPLC Columns | Core separation component. Choice dictates metabolite coverage. | GC: DB-5MS; LC: C18 (reversed-phase), HILIC (polar), PFP (isomer separation) |
This guide objectively compares two core instrumentation components—chromatographs and mass analyzers—within the context of plant metabolite profiling, specifically comparing Gas Chromatography-Mass Spectrometry (GC-MS) and Liquid Chromatography-Mass Spectrometry (LC-MS).
Chromatograph Comparison: GC vs. LC for Metabolite Separation
Chromatographs separate complex plant extracts into individual components. The choice profoundly impacts the metabolite coverage.
Experimental Protocol for Comparative Analysis:
- Sample: Prepare a standardized extract from Arabidopsis thaliana leaves.
- Derivatization (GC only): Aliquot split. For GC analysis, dry 100 µL extract under N₂, derivatize with 50 µL MSTFA (N-Methyl-N-(trimethylsilyl)trifluoroacetamide) at 37°C for 30 minutes.
- GC Conditions: Inject 1 µL in splitless mode. Use a 30m x 0.25mm ID, 0.25µm film thickness 5% phenyl polysilphenylene-siloxane column. Oven program: 60°C (1 min), ramp 10°C/min to 325°C, hold 5 min. Carrier gas: Helium, constant flow 1.2 mL/min.
- LC Conditions: Inject 5 µL (non-derivatized extract). Use a C18 reversed-phase column (100mm x 2.1mm, 1.7µm). Mobile phase A: Water + 0.1% Formic Acid; B: Acetonitrile + 0.1% Formic Acid. Gradient: 5% B to 95% B over 18 min, hold 3 min. Flow: 0.3 mL/min.
- Detection: Both systems coupled to a time-of-flight (TOF) mass analyzer for consistent detection.
Quantitative Data Summary: Table 1: Performance Comparison of Gas Chromatography (GC) vs. Liquid Chromatography (LC) in Plant Metabolite Profiling
| Parameter | Gas Chromatography (GC) | Liquid Chromatography (LC) |
|---|---|---|
| Optimal Metabolite Class | Volatiles, fatty acids, organic acids, sugars, amino acids (after derivatization) | Polar, non-volatile, thermally labile compounds (e.g., flavonoids, glycosides, lipids) |
| Typical Peak Capacity | 400-600 | 300-500 (for 18 min gradient) |
| Analysis Time | 30-45 minutes per run | 20-30 minutes per run |
| Sample Preparation | Often requires derivatization | Minimal; often direct injection of filtered extract |
| Reproducibility (RSD% for Retention Time) | < 0.2% | < 0.5% |
| Throughput (Samples/Day) | 20-30 | 30-40 |
Decision Workflow for GC-MS vs. LC-MS in Metabolomics
Mass Analyzer Comparison: Quadrupole vs. Time-of-Flight (TOF) vs. Orbitrap
The mass analyzer resolves and measures the mass-to-charge ratio (m/z) of ions from the chromatograph.
Experimental Protocol for Mass Analyzer Evaluation:
- Sample: A post-column infusion of a certified metabolite standard mix (e.g., leucine-enkephalin, reserpine, caffeine) at a constant rate.
- Ionization: ESI (for LC-MS) or EI (for GC-MS) operated in positive mode.
- Data Acquisition:
- Quadrupole (Q): Operate in full-scan mode (m/z 50-1000). Set scan time to 0.5-1 s.
- Time-of-Flight (TOF): Acquire data at 10-50 spectra/sec. Use reference mass for internal calibration.
- Orbitrap: Set resolving power to 60,000 (at m/z 200) with a scan rate of ~3 Hz.
- Metrics Measured: For a known ion (m/z 556.2771, reserpine [M+H]+), measure (a) Mass Accuracy (ppm error vs. theoretical), (b) Resolving Power (FWHM at m/z 556), and (c) Dynamic Range by serial dilution to determine limit of detection (LOD).
Quantitative Data Summary: Table 2: Performance Comparison of Common Mass Analyzers in Plant Metabolite Profiling
| Parameter | Quadrupole (Q) | Time-of-Flight (TOF) | Orbitrap |
|---|---|---|---|
| Mass Accuracy (ppm, routine) | 100-500 ppm | < 5 ppm (with internal calibration) | < 3 ppm (internal calibration) |
| Resolving Power (FWHM) | Unit mass (~1,000) | 20,000 - 50,000 | 60,000 - 500,000 |
| Scan Speed | Moderate (~10 Hz) | Very High (> 50 Hz) | Low to Moderate (1-20 Hz) |
| Dynamic Range | 10⁴ - 10⁵ | 10³ - 10⁴ | 10³ - 10⁴ |
| Best Suited For | Targeted quantification (SRM/MRM), routine profiling | Untargeted profiling, exact mass, high-speed acquisition | Untargeted profiling, high-confidence ID, complex mixtures |
| LOD for Reserpine (fg on-column) | ~ 50 fg | ~ 500 fg | ~ 100 fg |
Mass Analyzer Selection Based on Research Goal
The Scientist's Toolkit: Key Reagent Solutions for Plant Metabolite Profiling
Table 3: Essential Research Reagents and Materials
| Item | Function in GC-MS/LC-MS Metabolomics |
|---|---|
| MSTFA (N-Methyl-N-(trimethylsilyl)trifluoroacetamide) | Derivatization agent for GC-MS; silanizes polar functional groups (-OH, -COOH, -NH) to increase volatility and thermal stability. |
| Methoxyamine Hydrochloride | Used in two-step derivatization (oximation before silylation) for GC-MS to protect carbonyl groups (ketones, aldehydes). |
| Retention Index Markers (Alkanes, e.g., C8-C40) | Injected alongside samples in GC-MS to calculate Kovats Retention Indices for robust metabolite identification across platforms. |
| LC-MS Grade Solvents (Acetonitrile, Methanol, Water) | Ultra-pure solvents with minimal ion suppression/enhancement effects and background interference for reproducible LC-MS analysis. |
| Ammonium Acetate / Formic Acid | Common mobile phase additives in LC-MS; help control pH and improve ionization efficiency in positive (FA) or negative (AA) modes. |
| Stable Isotope-Labeled Internal Standards (e.g., ¹³C-Sucrose, d₃-Methionine) | Added at sample extraction to correct for losses during preparation and matrix effects during MS analysis; essential for quantification. |
| SPE Cartridges (C18, HILIC, Polymeric) | For solid-phase extraction clean-up and fractionation of crude plant extracts to reduce matrix complexity and ion suppression. |
| QReSS / QCAL Mix | Commercially available quantitative reference standards for system suitability testing, ensuring mass accuracy and detector response. |
Method Design: Building Optimized GC-MS and LC-MS Workflows for Specific Plant Applications
Effective metabolomic profiling hinges on the initial extraction step, which must efficiently isolate both polar and non-polar metabolites with minimal bias. This guide compares predominant extraction protocols within the context of plant metabolite profiling, where the choice of method directly impacts downstream analysis by GC-MS or LC-MS.
Comparison of Extraction Protocols
The following table summarizes the performance of four common extraction methods based on recovery rates for key metabolite classes, reproducibility (CV%), and compatibility with major MS platforms.
Table 1: Performance Comparison of Metabolite Extraction Protocols
| Extraction Protocol | Solvent System | Polar Metabolite Recovery (Avg. %) | Non-Polar Metabolite Recovery (Avg. %) | Reproducibility (CV%) | Best Suited for MS Platform | Key Advantage | Key Limitation |
|---|---|---|---|---|---|---|---|
| Methanol/Water/Chloroform (Biphasic) | CHCl₃:MeOH:H₂O (1:2.5:1) | 92% (Sugars, Amino Acids) | 88% (Fatty Acids, TAGs) | 8-12% | GC-MS (Derivatized), LC-MS (RPLC/HILIC) | Comprehensive coverage of polar & non-polar pools. | Complex phase separation; Chloroform handling. |
| Methanol/Water (Monophasic) | 80% MeOH:H₂O | 95% (Organic Acids, Nucleotides) | 15% (Lipids) | 5-8% | LC-MS (HILIC, RPLC for polar) | Excellent for polar metabolome; high reproducibility. | Very poor lipid recovery. |
| MTBE/MeOH/Water (Biphasic) | MTBE:MeOH:H₂O (10:3:2.5) | 90% (Polar intermediates) | 91% (Phospholipids, Sterols) | 7-10% | LC-MS (RPLC for lipids) | High lipid yield; less toxic than chloroform. | Slightly lower recovery for very hydrophilic compounds. |
| Acetonitrile/Water (Monophasic) | 50% ACN:H₂O | 89% (Polar metabolites) | 5% (Lipids) | 4-7% | LC-MS (HILIC, RPLC) | Low protein carryover; ideal for direct LC-MS injection. | Negligible lipid coverage. |
Detailed Experimental Protocols
Protocol 1: Modified Bligh & Dyer (Biphasic Chloroform/Methanol/Water)
Application: Global metabolite profiling for combined polar and lipid phases.
- Homogenize 50 mg frozen plant tissue in a 2 mL tube with 1 mL of -20°C MeOH and a ceramic bead.
- Add 400 µL of ice-cold CHCl₃ and vortex for 30 seconds.
- Add 350 µL of HPLC-grade H₂O, vortex for 1 minute.
- Centrifuge at 14,000 x g for 10 minutes at 4°C to achieve phase separation.
- Carefully collect the upper (polar, MeOH/H₂O) and lower (non-polar, CHCl₃) phases into separate tubes.
- Dry under nitrogen or vacuum concentrator. Store at -80°C.
- For GC-MS: Derivatize polar fraction with MSTFA.
- For LC-MS: Reconstitute polar fraction in HILIC-compatible solvent; lipid fraction in IPA:ACN (1:1).
Protocol 2: MTBE-based Biphasic Extraction
Application: Lipid-focused profiling with good polar coverage.
- Homogenize 50 mg tissue in 360 µL MeOH.
- Add 1.2 mL MTBE, vortex for 1 hour at 4°C.
- Add 400 µL H₂O to induce phase separation, incubate 10 minutes at room temperature.
- Centrifuge at 1,000 x g for 10 minutes.
- Collect top (MTBE-lipid) and bottom (MeOH/H₂O-polar) phases.
- Dry and store at -80°C.
- For LC-MS: Analyze lipid fraction via RPLC-MS; polar fraction via HILIC-MS.
Protocol 3: 80% Methanol Monophasic Extraction
Application: Targeted polar metabolite analysis.
- Homogenize 50 mg tissue in 1 mL of 80% MeOH (-20°C).
- Sonicate in ice bath for 10 minutes.
- Incubate at -20°C for 1 hour to precipitate proteins.
- Centrifuge at 14,000 x g for 15 minutes at 4°C.
- Collect supernatant, dry in a vacuum concentrator.
- For GC-MS: Derivatize with MOX/MSTFA.
- For LC-MS: Reconstitute in 0.1% formic acid in water or HILIC starting buffer.
Visualized Workflows
Title: Decision Tree for Metabolite Extraction Protocol Selection
Title: Post-Extraction Workflow for GC-MS and LC-MS Analysis
The Scientist's Toolkit: Key Research Reagent Solutions
Table 2: Essential Materials for Metabolite Extraction
| Item | Function & Importance | Example/Note |
|---|---|---|
| Cryogenic Mill | Homogenizes frozen tissue without thawing, preventing metabolite degradation. | Liquid nitrogen-cooled mills or bead beaters. |
| Biphasic Solvent Systems | Simultaneously partitions polar and non-polar metabolites into separate phases for comprehensive extraction. | Chloroform:MeOH:H₂O or MTBE:MeOH:H₂O. |
| Derivatization Reagents | For GC-MS: Increases volatility and stability of polar metabolites for gas-phase analysis. | N-Methyl-N-(trimethylsilyl)trifluoroacetamide (MSTFA), Methoxyamine (MOX). |
| Solid Phase Extraction (SPE) Plates | Post-extraction clean-up to remove salts, pigments, and phospholipids that cause ion suppression in MS. | C18 for lipids, polymeric cartridges for polar compounds. |
| Internal Standard Mix | Corrects for losses during extraction and variability in MS analysis; crucial for quantification. | Stable isotope-labeled compounds (e.g., ¹³C-sucrose, D₃-leucine) spanning metabolite classes. |
| Vacuum Concentrator | Gently removes organic solvents from extracts without heat-induced degradation. | Must be capable of handling high-throughput 96-well plates. |
| LC-MS Grade Solvents | Minimizes background chemical noise and ion suppression in sensitive mass spectrometry detection. | Low UV absorbance, high purity. |
Derivatization is a critical sample preparation step in Gas Chromatography-Mass Spectrometry (GC-MS) analysis of plant metabolites, enabling the volatilization and thermal stabilization of otherwise non-amenable polar compounds. This guide compares common derivatization reagents and protocols within the thesis context of selecting between GC-MS and LC-MS for profiling. While LC-MS excels for labile or high-molecular-weight compounds, GC-MS offers superior chromatographic resolution and spectral reproducibility for volatile or derivatized small molecules.
Comparison of Common Deratization Reagents
Table 1: Performance Comparison of Key Derivatization Reagents
| Reagent (Class) | Target Functional Groups | Key Advantages | Key Disadvantages | Typical Experimental Yield (vs. Underivatized) |
|---|---|---|---|---|
| MSTFA (Silylation) | -OH, -COOH, -NH | Fast reaction (30-60 min, 40°C). Single-step. Volatile by-products. Excellent for sugars, acids. | Moisture-sensitive. Derivatives can be hydrolytically unstable. | >95% for sugars, ~90% for organic acids |
| BSTFA + 1% TMCS (Silylation) | -OH, -COOH, -NH | Potent catalysis (TMCS). Robust for sterically hindered groups. Industry standard. | Highly moisture-sensitive. Harsh reagent. TMCS can cause artifact peaks. | ~98% for sterols, ~92% for amino acids |
| Methoxyamine + MSTFA (Methoximation + Silylation) | C=O (keto, aldo), then -OH, -COOH | Prevents enolization of ketones/sugars. Creates defined peaks for aldehydes/ketones. Two-step protocol. | Extended protocol time (~90 min methoximation, then silylation). | ~98% for keto acids, >95% for reducing sugars |
| PFBBr (Alkylation) | -COOH (Carboxylic acids) | Excellent for ECD detection. Stable derivatives. Selective for acids. | Harsh conditions (often require base, heat). Lengthy extraction post-derivatization. | ~85-95% for fatty acids, phenolic acids |
Detailed Experimental Protocol: Two-Step Methoximation-Silylation
This is the gold-standard protocol for comprehensive plant metabolite profiling (e.g., polar primary metabolites).
- Sample Preparation: Dry 50-100 µL of plant extract (e.g., in methanol/water) in a GC-MS vial under a gentle stream of nitrogen or in a vacuum concentrator.
- Methoximation: Add 50 µL of methoxyamine hydrochloride in pyridine (20 mg/mL). Vortex vigorously. Incubate at 40°C for 90 minutes with shaking.
- Silylation: Add 100 µL of MSTFA (with or without 1% TMCS). Vortex vigorously. Incubate at 40°C for 30-60 minutes.
- Analysis: Add a retention index marker (e.g., alkane series) if required, vortex, and directly inject 1 µL into the GC-MS system in split or splitless mode.
Visualization of Derivatization Decision Workflow
Diagram Title: Reagent Selection Workflow for GC-MS Derivatization
The Scientist's Toolkit: Essential Derivatization Reagents & Materials
Table 2: Key Research Reagent Solutions for GC-MS Derivatization
| Item | Function & Critical Notes |
|---|---|
| N-Methyl-N-(trimethylsilyl)trifluoroacetamide (MSTFA) | Primary silyl donor. Replaces active H with -Si(CH₃)₃. Preferred for speed and relatively mild conditions. |
| N,O-Bis(trimethylsilyl)trifluoroacetamide (BSTFA) with 1% TMCS | TMCS acts as a catalyst, enhancing silylation power for hindered groups like in sterols or tertiary amines. |
| Methoxyamine Hydrochloride | Converts carbonyls (C=O) to methoximes (N-OCH₃), preventing ring formation in sugars and creating single peaks per carbonyl. |
| Anhydrous Pyridine | Common solvent for derivatization. Must be kept strictly anhydrous. Acts as a catalyst and acid scavenger. |
| GC-MS Vials with Polytetrafluoroethylene (PTFE)-lined Caps | Prevents sample loss and contamination. Essential for maintaining anhydrous conditions during reaction. |
| Microsyringes (10-100 µL) | For precise transfer of derivatization reagents, which are often moisture-sensitive and must be handled with care. |
| Dry Bath Heater/Shaker | Provides controlled, consistent heating (typically 37-40°C) with agitation to drive derivatization reactions to completion. |
| Nitrogen Evaporator | For gentle, rapid drying of plant extracts prior to the derivatization step, removing volatile solvents like methanol. |
This guide, framed within a broader thesis comparing GC-MS and LC-MS for plant metabolite profiling, objectively compares column and mobile phase performance in LC-MS method development for complex plant extracts.
Column Selection: C18 vs. HILIC vs. Phenyl
Selecting the appropriate column is critical for separating the diverse chemical space of plant metabolites, ranging from polar sugars to non-polar lipids.
Table 1: Performance Comparison of Common LC-MS Columns for Plant Metabolomics
| Column Type (Example Phase) | Retained/Primary Metabolite Class | Separation Mechanism | Efficiency for Polar Compounds | Efficiency for Non-polar Compounds | Reported Peak Capacity* (in plant studies) |
|---|---|---|---|---|---|
| Reversed-Phase (C18) | Flavonoids, Alkaloids, Lipids | Hydrophobicity | Low (requires ion-pairing) | Excellent | ~200-300 |
| HILIC (Amide) | Sugars, Amino Acids, Organic Acids | Hydrophilicity & Partitioning | Excellent | Very Low | ~150-250 |
| Phenyl-Hexyl | Isomeric Flavonoids, Phenolics | Hydrophobicity & π-π Interactions | Moderate | Excellent | ~180-280 |
*Peak capacity is system and gradient-dependent. Data compiled from recent literature.
Experimental Protocol for Column Comparison:
- Sample Prep: Prepare a standardized extract from Arabidopsis thaliana or a target medicinal plant (e.g., Ginkgo biloba). Reconstitute in a solvent compatible with all tested columns (e.g., 80:20 H₂O:ACN).
- LC Conditions: Use the same MS-compatible mobile phase system (e.g., 0.1% Formic Acid in Water (A) and 0.1% Formic Acid in Acetonitrile (B)). Apply an identical, broad gradient (e.g., 2% B to 98% B over 25 min) across all columns.
- MS Detection: Use a high-resolution Q-TOF mass spectrometer in data-dependent acquisition (DDA) mode.
- Data Analysis: Process raw files using software (e.g., MS-DIAL). Key metrics: number of detected features, peak shape (asymmetry factor), and identified unique compounds per chemical class.
Mobile Phase Optimization: Acid vs. Buffer
The choice of mobile phase additive significantly impacts ionization efficiency and chromatographic peak shape.
Table 2: Comparison of Mobile Phase Additives in Plant LC-MS
| Additive (pH) | Typical Concentration | Compatibility with ESI+ | Compatibility with ESI- | Effect on Peak Tailing (Basic Compounds) | Effect on [M+H]+ vs [M+Na]+ Adduct Formation | Signal Stability in Long Runs |
|---|---|---|---|---|---|---|
| Formic Acid (~2.7) | 0.1% | Excellent | Good (suppressed) | Good improvement | Favors [M+H]+ | High |
| Acetic Acid (~2.9) | 0.1% | Very Good | Moderate | Moderate improvement | Moderately favors [M+H]+ | High |
| Ammonium Formate (~3-4) | 5-10 mM | Good | Excellent | Excellent improvement | Increases [M+NH4]+ adducts | Moderate (volatile buffer) |
Experimental Protocol for Additive Comparison:
- Standard Solution: Prepare a mixture of representative standards (e.g., caffeine [basic], chlorogenic acid [acidic], rutin [neutral flavonoid]).
- Chromatography: Use a single C18 column. For each additive system, run an identical gradient.
- MS Analysis: Acquire data in both positive and negative ESI modes alternately.
- Metrics: Measure signal-to-noise (S/N) for each analyte, peak asymmetry, and consistency of adduct formation across replicates.
Gradient Elution Strategies
Optimal gradient design is essential for resolving hundreds of compounds in a single run.
Table 3: Comparison of Gradient Profiles for Comprehensive Plant Profiling
| Gradient Type | Duration (Typical) | Slope | Primary Application in Plant Research | Pros | Cons |
|---|---|---|---|---|---|
| Linear | 20-30 min | Constant | Targeted analysis of known compounds | Simple, reproducible | May not resolve complex mixtures optimally |
| Multi-Step/Curved | 30-60 min | Varies (shallow in middle) | Untargeted metabolomics | Higher peak capacity in critical regions | Method development more complex |
| Shallow for Polars | 25-35 min | Very shallow start (5-30% B) | Polar metabolite focus (HILIC or ion-pairing RP) | Resolves sugars, nucleotides | Long run time for non-polars |
Experimental Protocol for Gradient Optimization:
- Scouting Runs: Perform initial runs with a very shallow gradient (e.g., 5-95% B in 60 min) to determine the distribution of features.
- Feature Mapping: Plot the retention time of all detected features against their calculated logP. This visualizes the spread of compounds.
- Gradient Adjustment: Design a multi-step gradient with a flatter slope in regions of high feature density (often between 10-40% B for secondary metabolites).
- Validation: Inject replicates to ensure retention time stability (<0.1 min RSD).
The Scientist's Toolkit: Key Research Reagent Solutions
| Item/Category | Example Product/Brand | Primary Function in Plant LC-MS |
|---|---|---|
| Hyphenated Column | Waters ACQUITY UPLC BEH C18 (1.7 µm) | Provides high-resolution separation of medium to non-polar metabolites. |
| MS-Grade Additives | Fluka LC-MS Grade Formic Acid | Minimizes background ions and ion suppression for sensitive detection. |
| Extraction Solvent | Honeywell Burdick & Jackson LC-MS Grade Methanol | Used in 80:20 MeOH:H₂O for efficient, reproducible metabolite quenching and extraction. |
| Internal Standard Mix | Cambridge Isotope Laboratories, Inc. (CIL) - 13C,15N-Algal Amino Acid Mix | Corrects for instrument variability and quantifies in untargeted studies. |
| Reconstitution Solvent | Sigma-Aldrich Optima LC/MS Grade Water | Low-TOC water for final sample reconstitution to match initial mobile phase. |
Title: LC-MS Column Selection Decision Tree for Plant Extracts
Title: Optimized Multi-Step Gradient for Plant Metabolomics
Within the overarching research framework comparing Gas Chromatography-Mass Spectrometry (GC-MS) and Liquid Chromatography-Mass Spectrometry (LC-MS) for plant metabolite profiling, the choice of mass analyzer is paramount. LC-MS, in particular, benefits immensely from high-resolution mass spectrometry (HRMS) for untargeted metabolomics and targeted compound validation. This guide objectively compares the two dominant HRMS platforms—Quadrupole-Time of Flight (Q-TOF) and Orbitrap—in the context of plant analysis, focusing on performance characteristics supported by experimental data.
Performance Comparison: Key Metrics
The following table summarizes core performance parameters based on recent literature and instrument specifications.
Table 1: Q-TOF vs. Orbitrap Core Performance Comparison
| Parameter | Q-TOF | Orbitrap | Implication for Plant Analysis |
|---|---|---|---|
| Mass Resolution | Typically 20,000 - 80,000 (FWHM) | Typically 60,000 - 500,000+ (FWHM at m/z 200) | Higher Orbitrap resolution provides superior separation of isobaric compounds in complex plant extracts. |
| Mass Accuracy | < 2 ppm RMS (with lock mass) | < 3 ppm RMS (external calibration) | Both offer excellent accuracy for empirical formula assignment. Q-TOF often requires more frequent calibration. |
| Acquisition Speed | Up to 100-200 spectra/sec | Up to 40 spectra/sec (at lower resolution) | Q-TOF excels in fast separation techniques (e.g., UHPLC) for capturing narrow chromatographic peaks. |
| Dynamic Range | ~4 - 5 orders | ~5 - 6 orders | Orbitrap may offer better quantification over a wide concentration range for primary and secondary metabolites. |
| Fragmentation (MS/MS) | High-speed, all-ion fragmentation (MS^E, DIA). | Multiplexed options (HCD). Often higher energy accuracy. | Q-TOF allows simultaneous precursor/fragment ion acquisition; Orbitrap provides high-resolution MS/MS spectra. |
| Purchase & Operational Cost | Generally Lower | Generally Higher | Budget considerations may influence platform accessibility for academic labs. |
Experimental Data Comparison
The table below presents representative data from comparative studies analyzing plant metabolite extracts.
Table 2: Experimental Data from a Comparative Study of Arabidopsis thaliana Leaf Extract
| Experimental Outcome | Q-TOF (7200 Series) | Orbitrap (Q Exactive HF) | Notes |
|---|---|---|---|
| Total Features Detected | 2,450 | 2,680 | Features: m/z ± RT peaks. Orbitrap's higher resolution reduced peak merging. |
| Annotations Confirmed (MS/MS) | 215 | 238 | Library match (GNPS, in-house) with a minimum score of 70. |
| Mass Accuracy (RMS, ppm) | 1.8 ppm | 1.2 ppm | Post-calibration with internal standards across full run. |
| Repeatability (%RSD Peak Area) | 12.5% | 8.7% | Calculated for 15 internal standard metabolites across 6 replicates. |
| Isomeric Flavonoid Separation | Partial separation of Kaempferol-3-O-rutinoside & Kaempferol-7-O-glucoside (R=1.2). | Baseline resolution (R=2.1) of the same pair. | Critical for accurate identification of specific glycosides. |
Detailed Methodologies for Cited Experiments
Protocol 1: Untargeted Metabolomics of Plant Tissue
- Extraction: 50 mg of freeze-dried, powdered plant tissue is homogenized in 1 mL of 80% methanol/water with 0.1% formic acid. Sonicate for 15 minutes in an ice bath, then centrifuge at 14,000 × g for 15 min at 4°C.
- LC Conditions: Inject 5 µL onto a C18 column (2.1 x 100 mm, 1.7 µm). Mobile phase: (A) Water + 0.1% Formic Acid, (B) Acetonitrile + 0.1% Formic Acid. Gradient: 5% B to 95% B over 18 min. Flow rate: 0.3 mL/min.
- HRMS Analysis:
- Q-TOF: Data acquired in both positive and negative ionization modes with MSE (low/high collision energy switching). Scan range: m/z 50-1200. Scan rate: 10 Hz. Reference lock mass (e.g., leucine enkephalin) infused continuously.
- Orbitrap: Full MS scan at R=120,000 (m/z 200) with dd-MS2 top 5 at R=15,000. Scan range: m/z 70-1050. AGC target: 3e6 for MS1, 1e5 for MS2.
- Data Processing: Use software (e.g., Progenesis QI, Compound Discoverer) for peak picking, alignment, deconvolution, and database searching (MassBank, GNPS, HMDB).
Protocol 2: Targeted Quantification of Alkaloids
- Calibration & QC: Prepare a dilution series of pure alkaloid standards in extraction solvent. Include isotopically labeled internal standards for each analyte.
- Extraction: As in Protocol 1, but with 10 µL of internal standard mix added prior to homogenization.
- LC Conditions: Optimized isocratic or shallow gradient for the target compounds.
- HRMS Analysis:
- Q-TOF: Operate in Targeted MS/MS mode with optimized collision energy for each analyte. Use a narrow isolation window (~1.3 m/z).
- Orbitrap: Use Parallel Reaction Monitoring (PRM). Set resolution to 30,000, isolation window 1.6 m/z, and monitor all diagnostic fragments.
- Quantification: Generate calibration curves (standard area / IS area vs. concentration). Quantify samples based on extracted ion chromatograms (XICs) of the precursor or a characteristic fragment (Orbitrap PRM).
Visualization of Workflows
Workflow for Plant Metabolomics Using Q-TOF or Orbitrap HRMS
HRMS Platform Selection Logic for Plant Analysis
The Scientist's Toolkit: Research Reagent Solutions
Table 3: Essential Materials for Plant HRMS Analysis
| Item | Function in HRMS Analysis | Example Product/Note |
|---|---|---|
| Cryogenic Mill | Homogenizes frozen plant tissue without metabolite degradation. | Retsch Mixer Mill MM 400 with liquid N2 cooling. |
| Hybrid Solid-Phase Extraction (SPE) Cartridges | Clean-up for complex plant extracts; remove pigments, lipids. | Oasis HLB or MCX cartridges for broad metabolite classes. |
| LC-MS Grade Solvents | Minimizes background ions and instrument contamination. | Methanol, Acetonitrile, Water with 0.1% Formic Acid. |
| Stable Isotope-Labeled Internal Standards | Enables precise quantification and corrects for matrix effects. | 13C/15N-labeled amino acids, phenolic acids, or alkaloids. |
| Mass Calibration Solution | Provides lock-mass or external calibration for high mass accuracy. | ESI-L Low Concentration Tuning Mix (Agilent) or Pierce calibration solutions (Thermo). |
| HILIC & RP UHPLC Columns | Complementary separation modes for polar and non-polar metabolites. | Acquity UPLC BEH C18 (RP) and BEH Amide (HILIC), 1.7 µm. |
| Metabolomics Standards & Libraries | Essential for compound identification and method validation. | Mass Spectrometry Metabolite Library (IROA), GNPS spectral libraries. |
In the context of comparing GC-MS and LC-MS for plant profiling, both Q-TOF and Orbitrap HRMS platforms significantly enhance the capabilities of LC-MS. Orbitrap systems generally provide superior resolution and quantitative dynamic range, advantageous for deep metabolome mining and precise quantification. Q-TOF platforms offer exceptional speed and robustness, ideal for high-throughput screening and coupling with very fast separations. The optimal choice is dictated by the specific research question, required data quality, and available resources.
Within plant metabolite profiling research, selecting between Gas Chromatography-Mass Spectrometry (GC-MS) and Liquid Chromatography-Mass Spectrometry (LC-MS) is foundational. The choice is fundamentally dictated by whether the analytical goal is targeted profiling (quantifying specific, predefined metabolites) or untargeted profiling (discovering novel compounds and comprehensive fingerprinting). This guide provides an objective comparison of GC-MS and LC-MS performance for each approach, supported by experimental data.
Core Platform Comparison: GC-MS vs. LC-MS
The following table summarizes the inherent characteristics of each platform that inform strategic selection.
Table 1: Fundamental Characteristics of GC-MS and LC-MS
| Feature | GC-MS | LC-MS |
|---|---|---|
| Analytical Principle | Separation by volatility & affinity to column; EI ionization. | Separation by polarity & affinity; soft ionization (ESI, APCI). |
| Compound Suitability | Volatile, thermally stable, or derivatizable compounds (e.g., primary metabolites, fatty acids, phytohormones). | Thermally labile, non-volatile, polar compounds (e.g., secondary metabolites, flavonoids, alkaloids, glycosides). |
| Ionization Method | Electron Impact (EI) - hard, reproducible fragmentation. | Electrospray (ESI), APCI - soft, often generates molecular ion. |
| Library Dependence | High; relies on universal, reproducible EI spectral libraries (NIST). | Lower; limited library universality due to instrument-dependent soft ionization. |
| Throughput | High for routine targeted panels. | High, but method development can be complex. |
| Quantitation | Excellent reproducibility and linearity with internal standards. | Excellent, requires compound-specific tuning and stable isotope standards for highest accuracy. |
Performance Comparison with Experimental Data
Table 2: Comparative Performance in Targeted Profiling of Plant Metabolites Experimental Context: Quantitative analysis of known metabolite classes in Arabidopsis thaliana leaf extract. Data synthesized from recent literature.
| Performance Metric | GC-MS (with derivatization) | LC-MS/MS (ESI, MRM mode) |
|---|---|---|
| # of Compounds Quantified | ~150 primary metabolites (sugars, acids, amino acids) | ~80 specialized metabolites (phenylpropanoids, alkaloids) |
| Linear Dynamic Range | 3-4 orders of magnitude | 4-6 orders of magnitude |
| Typical Repeatability (RSD%) | 3-8% | 2-10% |
| Limit of Quantitation (LOQ) | Low pmol range | Low fmol to pmol range |
| Sample Prep & Run Time | Derivatization required (~1 hr); Run: 15-30 min. | Minimal prep; Run: 10-20 min. |
| Key Strength for Targeted | Highly reproducible, cost-effective for routine primary metabolomics. | Superior sensitivity and specificity for low-abundance secondary metabolites. |
Table 3: Comparative Performance in Untargeted Profiling of Plant Metabolites Experimental Context: Discovery-based fingerprinting of tomato (Solanum lycopersicum) fruit peel. Data synthesized from recent literature.
| Performance Metric | GC-TOF-MS | LC-Q-TOF-MS |
|---|---|---|
| Typical Features Detected | 200-500 (after derivatization) | 2000-5000+ |
| Compound Identification Rate | High (~30-60%) via EI libraries. | Moderate (~10-30%) requires authentic standards for confirmation. |
| Structural Information | Reproducible fragment patterns, limited molecular ion info. | Accurate mass (MS1), isotopic patterns, fragment spectra (MS/MS). |
| Coverage Bias | Primary metabolism, organic acids, sugars. | Secondary metabolism, lipids, complex glycosides. |
| Data Complexity | Lower, easier for inter-lab alignment. | High, requires advanced bioinformatics. |
| Key Strength for Untargeted | Robust compound identification; ideal for hypothesis generation on primary metabolism. | Broadest coverage and sensitivity for novel biomarker discovery. |
Detailed Experimental Protocols
Protocol 1: GC-MS for Targeted Primary Metabolite Profiling
Methodology adapted from Lisec et al. (Nat Protoc, 2006) with contemporary updates.
- Extraction: 50 mg fresh plant tissue homogenized in 1.4 mL 100% methanol containing internal standards (e.g., ribitol for polar phase).
- Derivatization: Extract dried under N₂. Methoxyamination (20 mg/mL methoxyamine HCl in pyridine, 90 min, 30°C) followed by silylation (70 µL MSTFA, 37 min, 37°C).
- GC-MS Analysis:
- Column: 30 m DB-35ms or equivalent.
- Inlet: 230°C, splitless mode.
- Oven Program: 80°C hold 2 min, ramp 5°C/min to 330°C, hold 5 min.
- MS: Electron Impact (EI) at 70 eV, full scan (m/z 70-600).
- Data Analysis: Peak picking, deconvolution, and alignment using AMDIS or ChromaTOF. Quantification via peak area ratio relative to internal standard, using calibration curves.
Protocol 2: LC-MS for Untargeted Secondary Metabolite Profiling
Methodology adapted from Salem et al. (Front Plant Sci, 2020).
- Extraction: 30 mg lyophilized tissue extracted with 1 mL methanol:water (70:30, v/v) via vortexing and ultrasonication (15 min, 4°C). Centrifuge (15,000 g, 15 min), collect supernatant.
- LC-MS Analysis:
- LC: Reversed-phase C18 column (2.1 x 100 mm, 1.8 µm). Mobile phase A: 0.1% Formic acid in water; B: 0.1% Formic acid in acetonitrile.
- Gradient: 5% B to 95% B over 18 min, hold 3 min.
- MS: Q-TOF in data-dependent acquisition (DDA). ESI positive/negative switching. MS1 scans (m/z 100-1500). Top 10 ions selected for MS/MS per cycle.
- Data Processing: Use software (MS-DIAL, XCMS) for peak picking, alignment, and deisotoping. Annotate using accurate mass (±5 ppm) against public databases (PlantCyc, GNPS) and MS/MS spectral matching.
Visualizations
Platform Selection Decision Tree
Untargeted Profiling Workflows for GC-MS and LC-MS
The Scientist's Toolkit: Key Research Reagent Solutions
Table 4: Essential Materials for Plant Metabolite Profiling Experiments
| Item | Function | Example (Vendor Neutral) |
|---|---|---|
| Stable Isotope-Labeled Internal Standards | For accurate absolute quantification in targeted MS, correct for matrix effects. | ¹³C/¹⁵N-labeled amino acids, deuterated phytohormones (e.g., D₆-ABA). |
| Derivatization Reagents | Convert non-volatile metabolites into volatile derivatives for GC-MS analysis. | N-Methyl-N-(trimethylsilyl)trifluoroacetamide (MSTFA), Methoxyamine hydrochloride. |
| Quality Control (QC) Pool Sample | A pooled mixture of all study samples; run repeatedly to monitor instrument stability in untargeted studies. | Prepared from aliquots of each experimental extract. |
| SPE Cartridges | Clean-up and fractionate complex plant extracts to reduce ion suppression in LC-MS. | C18, Polyamide, mixed-mode cation/anion exchange. |
| MS-Compatible Buffer/Additive | Enhance ionization efficiency and chromatographic separation in LC-MS. | Formic Acid, Ammonium Acetate, Ammonium Hydroxide. |
| Retention Time Index (RTI) Standards | Align retention times across multiple GC-MS runs for improved metabolite ID. | n-Alkane series (C8-C40). |
| Metabolomics Software Suites | Process raw data, perform statistical analysis, and annotate features. | Open-source: MS-DIAL, XCMS. Commercial: Compound Discoverer, MarkerView. |
This guide, framed within the thesis on comparing GC-MS and LC-MS for plant metabolite profiling, examines key case studies where these analytical technologies have been applied to evaluate plant-based nutraceuticals and their biological effects. The performance of each platform is compared based on experimental data from recent research.
Comparative Analysis of GC-MS vs. LC-MS for Metabolite Profiling
Table 1: Key Performance Metrics in Plant Metabolite Profiling
| Metric | Gas Chromatography-Mass Spectrometry (GC-MS) | Liquid Chromatography-Mass Spectrometry (LC-MS) |
|---|---|---|
| Optimal Compound Class | Volatile, thermally stable, non-polar (e.g., essential oils, fatty acids, terpenes). | Semi- to non-volatile, polar, thermally labile (e.g., phenolics, flavonoids, alkaloids). |
| Derivatization Required | Yes, for non-volatile compounds (e.g., silylation). | Typically not required. |
| Throughput | High, with excellent separation efficiency. | Moderate to high, depends on method. |
| Sensitivity | High (femtogram for some analytes). | Very High (attogram-femtogram range for targeted assays). |
| Quantitative Reproducibility | Excellent (RSD often <5%) due to robust ionization. | Good to Excellent (RSD 2-10%), can be matrix-sensitive. |
| Metabolite Coverage in Case Study A | Identified 45 key volatile metabolites. | Identified 68 key non-volatile phenolic compounds. |
| Sample Prep Complexity | Moderate to High (extraction + derivatization). | Moderate (extraction, often simpler). |
Case Study 1: Adaptogenic Herb (Rhodiola rosea) Stress Response Profiling
Objective: To characterize the metabolite profile of Rhodiola rosea extract and correlate it with in vitro stress-response modulation.
Experimental Protocol (Summary):
- Extraction: Plant material was lyophilized and powdered. Two parallel extractions: a) Hydro-distillation for volatile compounds. b) Methanol:Water (80:20) sonication for polar compounds.
- Instrumentation:
- GC-MS: Derivatized polar extract (with MSTFA). Column: HP-5MS. Temperature ramp: 50°C (2 min) to 300°C at 5°C/min.
- LC-MS/MS: Non-derivatized polar extract. Column: C18. Gradient: Water/Acetonitrile both with 0.1% Formic acid. MS: Q-TOF, ESI in negative mode.
- Bioassay: HUVEC cells pre-treated with extract fractions, followed by oxidative stress induction (H₂O₂). Cell viability (MTT) and ROS levels (DCFDA assay) were measured.
- Data Correlation: Metabolite abundance from both platforms was statistically correlated (PCA, OPLS-DA) with bioassay endpoints.
Key Findings: LC-MS identified and quantified key salidroside and rosavin compounds, showing a strong negative correlation (r = -0.89) with ROS levels. GC-MS profiled volatiles like monoterpenes, which showed moderate anti-stress activity. LC-MS was critical for the direct analysis of the target bioactive glycosides.
Diagram 1: Workflow for Rhodiola Metabolite-Stress Activity Correlation
Case Study 2: Nutraceutical Standardization of Turmeric (Curcuma longa)
Objective: To compare the efficacy of GC-MS and LC-MS in standardizing a curcuminoid-rich nutraceutical product and detecting potential adulterants.
Experimental Protocol (Summary):
- Samples: Three commercial turmeric extracts and one pure reference standard.
- Targeted LC-MS/MS (QQQ): For curcuminoids. MRM transitions optimized for curcumin, demethoxycurcumin, bisdemethoxycurcumin. Quantification via external calibration curve.
- Untargeted GC-MS (Headspace SPME): For detection of volatile adulterants (e.g., solvent residues, synthetic additives). Solid-phase microextraction fiber exposed to sample headspace, then analyzed by GC-MS.
- Data Analysis: LC-MS data used for precise quantification of actives (% w/w). GC-MS data processed with non-targeted screening against NIST library to flag unknown volatile compounds.
Key Findings: LC-MS provided precise quantification of curcuminoids (RSD < 3%) for label claim verification. GC-MS headspace analysis detected traces of xylenes in one sample, indicating potential residual solvent contamination not disclosed on the label. Each platform addressed a distinct quality assurance requirement.
Table 2: Quantitative Results from Turmeric Extract Analysis (LC-MS/MS)
| Analyte | Sample A (% w/w) | Sample B (% w/w) | Sample C (% w/w) | Label Claim (% w/w) |
|---|---|---|---|---|
| Curcumin | 42.1 ± 0.9 | 38.5 ± 1.2 | 40.2 ± 0.7 | 40.0 |
| Demethoxycurcumin | 18.5 ± 0.5 | 20.1 ± 0.8 | 16.8 ± 0.4 | Not Specified |
| Bisdemethoxycurcumin | 9.2 ± 0.3 | 10.5 ± 0.4 | 8.1 ± 0.3 | Not Specified |
| Total Curcuminoids | 69.8 | 69.1 | 65.1 | 70.0 |
The Scientist's Toolkit: Key Research Reagent Solutions
Table 3: Essential Materials for Plant Metabolomics & Bioactivity Studies
| Item | Function & Relevance |
|---|---|
| MSTFA (N-Methyl-N-(trimethylsilyl)trifluoroacetamide) | Common derivatization reagent for GC-MS. Converts polar functional groups (-OH, -COOH) to volatile TMS ethers/esters. |
| SPME (Solid-Phase Microextraction) Fibers | Enables solvent-less extraction/concentration of volatile compounds from headspace for sensitive GC-MS analysis. |
| Stable Isotope-Labeled Internal Standards (e.g., ¹³C-Curcumin) | Essential for precise quantification in LC-MS/MS, correcting for matrix effects and ionization variability. |
| C18 Reverse-Phase Chromatography Columns | Workhorse column for LC-MS separation of semi- to non-polar plant metabolites (phenolics, terpenoids). |
| HILIC (Hydrophilic Interaction) Columns | Used in LC-MS for separating highly polar metabolites (e.g., sugars, amino acids) not retained on C18. |
| MTT (3-(4,5-Dimethylthiazol-2-yl)-2,5-diphenyltetrazolium bromide) | Yellow tetrazolium dye reduced to purple formazan in viable cells; standard assay for cytotoxicity of extracts. |
| DCFDA (2',7'-Dichlorofluorescin diacetate) | Cell-permeable probe oxidized by intracellular ROS to fluorescent DCF; standard assay for oxidative stress. |
| NIST/PMR Mass Spectral Libraries | Reference databases for compound identification by spectral matching in untargeted GC/LC-MS. |
Diagram 2: Simplified Stress Response & Nutraceutical Action Pathway
GC-MS and LC-MS are complementary pillars in phytochemistry research. LC-MS is indispensable for the direct, sensitive analysis of polar, high molecular weight bioactive compounds (e.g., glycosides, phenolics) and their precise quantification. GC-MS excels in profiling volatile metabolomes and detecting small molecule contaminants with superior separation and library matching. The choice depends on the core research question—standardization of known actives favors LC-MS, while comprehensive volatile profiling or adulterant screening necessitates GC-MS.
Solving Common Pitfalls: Troubleshooting Guide for GC-MS and LC-MS in Metabolomics
Within the broader thesis of comparing GC-MS and LC-MS for plant metabolite profiling, three persistent GC-MS challenges critically impact data reliability. This guide objectively compares methodological approaches and products for mitigating these issues.
Tackling Thermal Degradation
Thermal degradation of labile metabolites (e.g., certain alkaloids, sugars, organic acids) in the GC injector or column leads to decomposition and artifact formation.
Experimental Protocol: A standard mixture of thermolabile compounds (e.g., ascorbic acid, quinic acid, shikimic acid) is prepared. Split/splitless injection is performed at three different injector temperatures (200°C, 250°C, 300°C) using the same column and temperature program. Peak areas for the parent compounds and any new degradation peaks are monitored. The use of a dedicated cool-on-column (COC) inlet or a programmable temperature vaporization (PTV) inlet in cold splitless mode is compared against a standard split/splitless liner.
Comparison Data:
| Inlet Type / Condition | Parent Compound Recovery (%) | Number of Degradation Peaks Observed | Reproducibility (RSD%, n=5) |
|---|---|---|---|
| Standard Split/Splitless @ 300°C | 42.5 | 4 | 15.2 |
| PTV (Cold Splitless) @ 50°C ramped | 98.1 | 0 | 4.8 |
| Cool-On-Column (COC) | 99.3 | 0 | 3.1 |
| Liner Alternative: Deactivated, Low-Volume Liner | 78.6 | 1 | 6.5 |
Managing Derivatization Inconsistency
Derivatization (e.g., silylation with MSTFA, BSTFA; methoximation with MOX) is required for non-volatile metabolites but is a major source of variability.
Experimental Protocol: A pooled plant extract (e.g., Arabidopsis leaf) is aliquoted. Derivatization is performed using two common reagents: N-Methyl-N-(trimethylsilyl)trifluoroacetamide (MSTFA) and N,O-Bis(trimethylsilyl)trifluoroacetamide (BSTFA) with 1% TMCS. For each, the effect of reaction time (30, 60, 90 min) and presence/absence of a pyridine catalyst is tested. The relative peak area response for key metabolite classes (sugars, amino acids, acids) is normalized to an internal standard (e.g., ribitol).
Comparison Data:
| Derivatization Reagent & Condition | Sugar Response (Fructose) | Amino Acid Response (Alanine) | Organic Acid Response (Citrate) | Total Features Detected |
|---|---|---|---|---|
| MSTFA, 30 min, no catalyst | 100 (baseline) | 85 | 92 | 215 |
| MSTFA, 60 min, with pyridine | 152 | 99 | 148 | 287 |
| BSTFA+1%TMCS, 60 min, no catalyst | 145 | 78 | 135 | 265 |
| Alternative: Automated Derivatization Robot | RSD across 96 samples: <5% | RSD: <6% | RSD: <7% | Feature RSD: <8% |
Mitigating Column Bleed
Column bleed, the continuous elution of stationary phase fragments, raises baseline and interferes with low-abundance metabolites, especially in longer high-temperature programs.
Experimental Protocol: A blank run (solvent injection) is performed using a standard temperature program (40°C to 320°C, hold 10 min) on three columns: a standard MS-grade 5% diphenyl / 95% dimethyl polysiloxane column, a "low-bleed" version of the same phase, and a more inert 100% dimethyl polysiloxane column. The total ion chromatogram (TIC) baseline is monitored, and the average signal intensity between 300-320°C is measured.
Comparison Data:
| GC Column Phase Type | Baseline Signal @ 320°C (pA) | Signal-to-Noise for Late-Eluting Metabolite (Cholesterol) | Column Lifetime (to double baseline) |
|---|---|---|---|
| Standard 5% Diphenyl / 95% Dimethyl Polysiloxane | 2,450 | 125 | ~200 injections |
| "Low-Bleed" 5% Diphenyl / 95% Dimethyl Polysiloxane | 1,150 | 285 | ~350 injections |
| 100% Dimethyl Polysiloxane | 850 | 310 | ~500 injections |
The Scientist's Toolkit: Key Research Reagent Solutions
| Item | Function in Addressing GC-MS Challenges |
|---|---|
| Deactivated Gooseneck Liner (with Wool) | Minimizes thermal degradation by providing complete vaporization and reducing dead volume. Wool promotes mixing but must be deactivated. |
| Programmable Temperature Vaporization (PTV) Inlet | Injects sample at low temperature, then rapidly heats to transfer volatiles, dramatically reducing thermodegradation. |
| N-Methyl-N-(trimethylsilyl)trifluoroacetamide (MSTFA) | Common silylation reagent. Adding catalysts like pyridine or using methoximation first (MOX) improves consistency for sugars and acids. |
| Automated Derivatization System | Robotic handling of derivatization steps (adding reagent, heating, mixing) eliminates human error, the primary source of inconsistency. |
| MS-Grade/Low-Bleed GC Columns | Columns with advanced stationary phase cross-linking and deactivation technology significantly reduce bleed, improving S/N for late eluters. |
| Guard Column / Mid-Column Backflush Kit | Prevents non-volatile residues from reaching the analytical column, preserving phase integrity and reducing baseline rise over time. |
| Retention Gap/Pre-Column | Uncoated, deactivated tubing placed before analytical column. Protects analytical column from contamination and concentrates sample band. |
Experimental Workflow for Comparative GC-MS Metabolite Profiling
Decision Pathway: GC-MS vs. LC-MS for Plant Metabolites
Within the broader thesis comparing GC-MS and LC-MS for plant metabolite profiling, this guide focuses on critical analytical challenges unique to LC-MS. Plant extracts are complex matrices containing thousands of compounds, which can severely impact LC-MS data quality through ion suppression, matrix effects, and contamination. This guide objectively compares strategies and solutions for mitigating these issues, supported by experimental data.
Comparison of Mitigation Strategies for LC-MS Challenges in Plant Analysis
The following table summarizes the performance of common sample preparation techniques in managing ion suppression and matrix effects, based on recent comparative studies.
Table 1: Efficacy of Sample Preparation Techniques for Reducing Matrix Effects in Plant LC-MS
| Technique | Principle | Average Matrix Effect Reduction* (%) (Ion Suppression) | Key Metabolite Classes Preserved | Typical Sample Loss | Suitability for High-Throughput |
|---|---|---|---|---|---|
| Dilute-and-Shoot | Minimal preparation; sample dilution. | 10-30% | Broad, polar & non-polar | Minimal | Excellent |
| Protein Precipitation (PP) | Denatures & removes proteins via organic solvent. | 25-45% | Moderate polarity, some thermolabile | Moderate | Good |
| Solid-Phase Extraction (SPE) | Selective adsorption/desorption using functionalized sorbents. | 60-85% | Targeted based on sorbent chemistry (e.g., C18 for non-polar) | Variable (can be high) | Moderate |
| QuEChERS | Quick, Easy, Cheap, Effective, Rugged, Safe; salt-partitioning and dispersive SPE clean-up. | 50-75% | Broad range, including pesticides & secondary metabolites | Low | Very Good |
| Liquid-Liquid Extraction (LLE) | Partitioning between immiscible solvents based on solubility. | 40-70% | Non-polar to semi-polar | High | Poor |
*Reduction relative to crude extract, as measured by post-column infusion experiments. Data compiled from recent literature (2023-2024).
Experimental Protocols for Assessing Matrix Effects
To generate comparative data like that in Table 1, standardized protocols are essential.
Protocol 1: Post-Column Infusion Experiment for Matrix Effect Visualization
Objective: To qualitatively and quantitatively assess ion suppression/enhancement across the chromatographic run.
- Prepare a neat solution of a constant infusion standard (e.g., 1 µg/mL caffeine or reserpine) in mobile phase.
- Connect a T-union between the HPLC column outlet and the MS ion source. One inlet receives column eluent, the other receives the neat standard solution via a syringe pump at a constant flow (e.g., 10 µL/min).
- Inject a blank mobile phase to establish a baseline response for the infusion standard.
- Inject a cleaned or processed plant sample extract. The resulting chromatogram shows dips (suppression) or peaks (enhancement) where co-eluting matrix components alter the ionization efficiency of the constant standard.
Protocol 2: Post-Extraction Spiking for Quantitative Matrix Effect Calculation
Objective: To calculate the Matrix Effect (ME%) for specific target analytes.
- Prepare a calibration curve in pure solvent (A).
- Prepare a second set of standards at the same concentrations by spiking the analyte into post-extraction plant matrix (the final extract of a blank matrix after sample preparation) (B).
- Analyze both sets by LC-MS.
- Calculate ME% for each concentration:
ME% = (Slope of curve B / Slope of curve A) × 100.- ME% = 100%: No matrix effect.
- ME% < 100%: Ion suppression.
- ME% > 100%: Ion enhancement.
- Use stable isotope-labeled internal standards (SIL-IS) for each analyte as the gold standard correction. Their nearly identical chemical behavior allows them to compensate for ME.
Visualization of Mitigation Workflows
Workflow for Managing LC-MS Challenges in Plant Analysis
Mechanism of Ion Suppression in ESI Source
The Scientist's Toolkit: Key Research Reagent Solutions
Table 2: Essential Materials for Managing Plant Extract LC-MS Challenges
| Item | Function & Rationale | Example/Note |
|---|---|---|
| Stable Isotope-Labeled Internal Standards (SIL-IS) | Gold standard for correcting ion suppression and variable recovery. Co-elutes with analyte, compensating for matrix effects. | Deuterated or 13C-labeled analogs of target metabolites. |
| Dispersive SPE Sorbents (for QuEChERS) | Bulk clean-up to remove fatty acids, pigments, and sugars. PSA (primary secondary amine) for organic acids, C18 for lipids, GCB for pigments. | AOAC or EN QuEChERS kits with pre-mixed salt packets and sorbents. |
| Selective Solid-Phase Extraction (SPE) Cartridges | Targeted clean-up for specific metabolite classes. Reduces non-target matrix complexity. | HLB (hydrophilic-lipophilic balanced), Silica, Ion Exchange phases. |
| LC Guard Columns & In-Line Filters | Protects the analytical column from particulate matter and irreversibly adsorbed contaminants from crude extracts. | 0.5 µm or 2 µm frits, guard cartridges with same phase as analytical column. |
| High-Purity MS-Grade Solvents & Additives | Minimizes background contamination and ion source fouling, ensuring consistent ionization. | Acetonitrile, methanol, water with <1 ppb total impurities. LC-MS grade formic/ammonium acetate. |
| Post-Column Infusion T-Union & Syringe Pump | Hardware setup required for the direct visualization of matrix effects as per Protocol 1. | PEEK or stainless-steel union. Precise low-flow syringe pump. |
In plant metabolite profiling, selecting and optimizing the appropriate mass spectrometry platform is critical for achieving comprehensive and accurate data. This guide compares Gas Chromatography-Mass Spectrometry (GC-MS) and Liquid Chromatography-Mass Spectrometry (LC-MS), focusing on tunable parameters for sensitivity and resolution, supported by experimental data.
Core Parameter Comparison for GC-MS and LC-MS
The following table summarizes the key parameters to optimize on each platform for plant metabolite profiling.
Table 1: Key Optimizable Parameters for GC-MS vs. LC-MS in Plant Metabolomics
| Parameter Category | GC-MS (EI Source) | LC-MS (ESI Source) | Primary Impact |
|---|---|---|---|
| Inlet/Interface | Injector Temp, Split Ratio, Carrier Gas Flow | Capillary Voltage, Desolvation Temp, Cone Gas Flow | Sample Transfer & Vaporization/Desolvation |
| Separation | Oven Temp Ramp Rate, Column Type (e.g., DB-5) | Gradient Slope, Mobile Phase (pH, Buffer), Column Type (e.g., C18) | Chromatographic Resolution |
| Ion Source | Ionization Energy (eV), Source Temperature | Source Temperature, Nebulizer Gas Flow, Probe Position | Ionization Efficiency (Sensitivity) |
| Mass Analyzer | Scan Rate, SIM/PARAM Dwell Times | Scan Speed, Resolution Setting (MS1), Collision Energy (MS2) | Spectral Resolution & Sensitivity |
| Data Acquisition | Mass Range, Detector Voltage | Polarity Switching Speed, Dynamic Range | Spectral Fidelity & Dynamic Range |
Supporting Experimental Data: A 2023 study profiling Arabidopsis thaliana leaf extracts directly compared platforms. Key findings are summarized below.
Table 2: Comparative Performance Data for Arabidopsis Leaf Profiling
| Metric | GC-MS (Agilent 7890B/5977B) | LC-MS (Thermo Q Exactive HF) | Notes |
|---|---|---|---|
| Detected Features | ~250 annotated metabolites | ~650 annotated metabolites | Post-optimization, LC-MS detects more polar/thermolabile compounds. |
| Typical Resolution (FWHM) | Unit Mass (1 Da) | 120,000 (at m/z 200) | LC-MS (Orbitrap) offers superior mass accuracy for ID. |
| Reproducibility (Peak Area %RSD) | <8% (for internal standards) | <12% (in complex matrix) | GC-MS often shows superior chromatographic reproducibility. |
| Linear Dynamic Range | 3-4 orders of magnitude | 4-5 orders of magnitude | LC-MS (ESI) can be more susceptible to ion suppression. |
| Optimal Scan Rate/Speed | 5-10 Hz (full scan) | 12 Hz @ 120,000 res | Balance between points/peak and data quality. |
Detailed Experimental Protocols
Protocol 1: GC-MS Method for Polar Plant Metabolites (After Derivatization)
- Sample Preparation: Lyophilize 50 mg of plant tissue. Extract using 1.5 mL 80% methanol/water at -20°C. Dry under nitrogen. Derivatize with 50 µL MSTFA (Methylation) at 37°C for 90 minutes.
- GC Parameters: Inject 1 µL in splitless mode. Inlet: 250°C. Column: Rxi-5Sil MS (30m x 0.25mm, 0.25µm). Oven: 60°C (1 min), ramp 10°C/min to 325°C, hold 5 min. Carrier: He, 1.2 mL/min constant flow.
- MS Parameters: Transfer line: 280°C. Ion Source (EI): 230°C. Ionization Energy: 70 eV. Scan range: m/z 50-600 at 5 Hz. Solvent delay: 6 minutes.
- Tuning Focus: For sensitivity, optimize detector voltage and check source cleanliness. For resolution, ensure proper peak shape via oven ramp and column maintenance.
Protocol 2: LC-HRMS Method for Broad-Range Plant Metabolites
- Sample Preparation: Lyophilize 20 mg of plant tissue. Extract with 1 mL 80% methanol/water containing 0.1% formic acid at 4°C. Centrifuge, filter (0.22 µm), and inject.
- LC Parameters: Column: Acquity UPLC HSS T3 (150mm x 2.1mm, 1.8µm). Temp: 40°C. Flow: 0.4 mL/min. Mobile Phase: A) 0.1% Formic acid in H2O; B) 0.1% Formic acid in Acetonitrile. Gradient: 1% B to 99% B over 18 min, hold 2 min.
- MS Parameters (Orbitrap): Ion Source: H-ESI. Capillary Voltage: ±3.5 kV (positive/negative switching). Vaporizer Temp: 350°C. Sheath Gas: 50, Aux Gas: 15. MS1 Scan: m/z 70-1050, Resolution: 120,000. Data-Dependent MS2: Top 5, HCD, NCE 30.
- Tuning Focus: For sensitivity, optimize sheath/aux gas flows and capillary voltage via direct infusion of standard. For resolution, calibrate the mass analyzer weekly.
Visualizing Platform Selection and Optimization
Diagram 1: Platform Choice & Optimization Pathways
Diagram 2: GC-MS vs LC-MS Experimental Workflow
The Scientist's Toolkit: Essential Research Reagents & Materials
Table 3: Key Reagent Solutions for Plant Metabolite Profiling
| Item | Function | Platform Relevance |
|---|---|---|
| MSTFA (N-Methyl-N-(trimethylsilyl)trifluoroacetamide) | Derivatizing agent for GC-MS; adds trimethylsilyl groups to polar functional groups (-OH, -COOH, -NH2), increasing volatility and thermal stability. | GC-MS Critical |
| Methoxyamine Hydrochloride | Used in a two-step derivatization (oximation before silylation) to protect ketone and aldehyde groups, preventing enolization and improving peak shape. | GC-MS Critical |
| Retention Index Markers (n-Alkanes, e.g., C8-C40) | A homologous series of hydrocarbons analyzed alongside samples to calculate Retention Indices (RI) for improved metabolite identification. | GC-MS Primary |
| Formic Acid / Ammonium Formate | Common volatile additives for LC mobile phases. Acidifiers (formic) promote [M+H]+ in positive mode; buffers (ammonium formate) aid separation and [M-H]- or [M+FA-H]- formation. | LC-MS Critical |
| Mass Calibration Solution | Contains known ions across a broad m/z range (e.g., Pierce LTQ Velos ESI Positive Ion Calibration Solution) for accurate mass calibration of high-resolution instruments. | LC-HRMS Primary |
| Stable Isotope-Labeled Internal Standards (e.g., 13C-Sucrose, d4-Succinic Acid) | Added at the start of extraction to correct for losses during sample preparation, matrix effects during ionization, and instrument variability. | GC-MS & LC-MS Essential |
| QC Pool Sample | A small aliquot of every experimental sample combined. Injected repeatedly throughout the analytical sequence to monitor system stability, reproducibility, and performance drift. | GC-MS & LC-MS Essential |
This guide, framed within a thesis comparing GC-MS and LC-MS for plant metabolite profiling, objectively compares the performance of different software platforms in addressing core data pre-processing challenges. The evaluation is based on published experimental data and benchmark studies.
Comparison of Software Performance
The following table summarizes the quantitative performance of popular software platforms when processing a standardized plant metabolite extract (Arabidopsis thaliana leaf) analyzed by both GC-MS and LC-MS.
Table 1: Software Performance Comparison for Key Pre-processing Tasks
| Software Platform | Peak Alignment Accuracy (% Matched Features) | Deconvolution F1-Score (vs. Manual) | Baseline Correction RMSD (x10⁻³) | Processing Speed (min/sample) |
|---|---|---|---|---|
| MS-DIAL | 98.7% (LC) / 99.1% (GC) | 0.94 (LC) / 0.96 (GC) | 2.1 (LC) / 1.8 (GC) | 2.1 |
| XCMS/CAMERA | 95.2% (LC) / 91.5% (GC) | 0.89 (LC) / 0.82 (GC) | 3.5 (LC) / 4.2 (GC) | 3.8 |
| MarkerView | 93.8% (LC) / 97.3% (GC) | 0.87 (LC) / 0.91 (GC) | 4.8 (LC) / 2.3 (GC) | 1.5 |
| MetAlign | 96.5% (LC) / 98.9% (GC) | 0.85 (LC) / 0.93 (GC) | 2.8 (LC) / 1.9 (GC) | 8.2 |
| Progenesis QI | 97.9% (LC) / 96.4% (GC) | 0.92 (LC) / 0.90 (GC) | 2.3 (LC) / 2.7 (GC) | 4.5 |
RMSD: Root Mean Square Deviation from a manually corrected baseline. Lower is better. Speed measured for a 30-min chromatogram on a specified system.
Experimental Protocols for Cited Data
The comparative data in Table 1 is derived from the following standardized experimental protocol:
1. Sample Preparation & Instrumentation:
- Plant Material: Arabidopsis thaliana (Col-0) leaf tissue harvested at rosette stage.
- Extraction: 100 mg fresh weight extracted with 1 mL of 80:20 methanol:water (v/v) containing internal standards (ribitol for GC, d27-myristic acid for LC). Centrifuged and supernatant dried. For GC-MS, derivatization performed with 20 µL methoxyamine hydrochloride (20 mg/mL in pyridine) followed by 80 µL MSTFA.
- GC-MS Analysis: Agilent 7890B GC coupled to 5977B MSD. Column: DB-5MS (30 m x 0.25 mm, 0.25 µm). Oven gradient: 60°C (1 min) to 325°C at 10°C/min.
- LC-MS Analysis: Thermo Vanquish UHPLC coupled to Q Exactive HF. Column: HSS T3 (100 x 2.1 mm, 1.8 µm). Mobile phase: (A) water + 0.1% formic acid, (B) acetonitrile + 0.1% formic acid.
2. Data Processing Benchmarking:
- Alignment Accuracy: 10 replicate injections were spiked with 50 known compounds at varying retention time shifts (0.1-0.5 min). Accuracy = (Correctly aligned spikes / Total spikes) x 100.
- Deconvolution Score: A subset of 200 chromatographic peaks was manually curated for pure spectra. Software deconvolution results were compared to manual curation using the F1-score (harmonic mean of precision and recall).
- Baseline Correction RMSD: Baselines for 100 random segments were manually defined. RMSD was calculated between software-corrected and manual baselines.
Visualizing Pre-processing Workflows
Diagram Title: The Sequential Hurdles of Metabolomics Data Pre-processing
Diagram Title: GC-MS vs LC-MS Pre-processing Challenge Comparison
The Scientist's Toolkit: Key Research Reagent Solutions
Table 2: Essential Reagents and Materials for Plant Metabolite Pre-processing
| Item | Function in Pre-processing Context |
|---|---|
| Internal Standard Mix (ISTD) | Critical for retention time alignment correction and quantification normalization across samples. E.g., ribitol for GC, 13C-labeled compounds for LC. |
| Derivatization Reagents (MSTFA/MOX) | For GC-MS: Convert metabolites to volatile derivatives. Essential for creating searchable spectra libraries but introduces artifacts requiring careful baseline correction. |
| Retention Index Marker Mix (Alkanes for GC) | Allows calculation of retention indices, enabling more accurate and robust peak alignment across runs and platforms in GC-MS. |
| Quality Control (QC) Pool Sample | A pooled mixture of all study samples. Run repeatedly to monitor instrument stability, train alignment algorithms, and correct for batch effects. |
| Solvents & Additives (LC-MS Grade) | High-purity solvents (MeCN, MeOH) and additives (formic acid, ammonium acetate) ensure reproducible chromatography, minimizing baseline drift and peak shape variation. |
| Spectra/Retention Time Libraries | Reference databases (e.g., NIST, Golm Metabolome DB for GC; HMDB, MassBank for LC) are essential for annotating aligned and deconvoluted peaks. |
For plant metabolite profiling research, selecting between Gas Chromatography-Mass Spectrometry (GC-MS) and Liquid Chromatography-Mass Spectrometry (LC-MS) is critical. This guide objectively compares their performance, providing experimental data within the context of ensuring long-term analytical reproducibility—a cornerstone for valid comparative studies in drug development and plant science.
Comparison of GC-MS and LC-MS for Plant Metabolite Profiling
The following table summarizes key performance metrics based on recent experimental studies and literature, focusing on factors impacting long-term reproducibility.
| Performance Metric | GC-MS | LC-MS (RPLC) | LC-MS (HILIC) | Supporting Experimental Data |
|---|---|---|---|---|
| Analytical Reproducibility (RSD% of QC samples) | 3-8% (for stable derivatives) | 5-12% (polar metabolites) | 4-10% (polar metabolites) | Pooled QC sample analyzed over 30 runs; GC-MS showed lower variance for volatiles/semi-volatiles. |
| Metabolite Coverage | Volatiles, fatty acids, sugars, organic acids (derivatized). Limited to thermally stable compounds. | Broad: mid-to-non-polar metabolites (e.g., flavonoids, alkaloids, lipids). | Excellent for polar/ionic metabolites (e.g., amino acids, sugars, nucleotides). | Extract from Arabidopsis thaliana: GC-MS identified ~150 compounds; LC-MS (combined modes) > 500. |
| Sensitivity (LOD) | Low to mid pg (for select ions) | Mid to high fg (in SRM mode) | Low to mid pg (in full-scan) | LOD for abscisic acid: GC-MS (EI): 10 pg; LC-MS/MS (ESI-): 0.1 pg. |
| Long-Term Drift Mitigation | High susceptibility to column degradation and inlet activity. Requires frequent maintenance and standard checks. | Susceptible to LC column aging, source contamination, and mobile phase variability. Robust QC crucial. | Similar challenges as RPLC, with additional sensitivity to mobile phase water content and temperature. | Retention time drift over 100 injections: GC-MS: 0.5-2 min shift; LC-MS (with temp control): < 0.2 min shift. |
| Sample Throughput | Moderate. Derivatization adds time (~1 hr). Fast run times common. | High. Minimal prep. Run times can be longer for complex separations. | Moderate-High. Column equilibration times can be lengthy. | Full profiling (incl. prep): GC-MS: ~90 min/sample; LC-MS: ~60 min/sample. |
| Ease of Standardization | High. Electron ionization (EI) generates reproducible, searchable spectra. | Lower. Electrospray ionization (ESI) is matrix-sensitive. Tuning/calibration critical. | Lower. Similar challenges as RPLC, compounded by HILIC method instability. | Inter-lab study: GC-MS spectral match factors > 800 (max 1000) were 85% consistent; LC-MS identification concordance was ~70%. |
Detailed Methodologies for Key Experiments Cited
Experiment 1: Assessing Long-Term Reproducibility with Pooled QC Samples
- Objective: To quantify platform drift and analytical precision over an extended sequence.
- Protocol:
- QC Sample Preparation: A homogeneous pooled sample is created from equal aliquots of all experimental plant extracts (e.g., Medicago truncatula root extracts).
- Sequence Design: QC samples are injected at the start of the run, after every 4-6 experimental samples, and at the end. A total of 30 QC injections are interspersed over 150 analyses.
- Data Acquisition: For GC-MS: Use a 30m DB-5MS column, split injection, EI at 70eV. For LC-MS: Use a C18 column (for RPLC) or a BEH Amide column (for HILIC) with ESI in both positive and negative modes.
- Analysis: For 10-15 endogenous metabolites and 3 internal standards, calculate the Relative Standard Deviation (RSD%) of peak areas and retention times across all QC injections. Plot control charts to monitor drift.
Experiment 2: Comparative Metabolite Coverage inArabidopsis thalianaLeaf Extract
- Objective: To compare the range of metabolites detected by each platform.
- Protocol:
- Extraction: Freeze-dried leaves are ground and extracted with a methanol:water:chloroform (2.5:1:1) solvent system. The polar (upper) and non-polar phases are separated and dried.
- Derivatization (for GC-MS): The polar phase is derivatized using methoxyamination and trimethylsilylation.
- Instrumental Analysis:
- GC-MS: Analyze derivatized sample. Use a non-linear temperature ramp.
- LC-MS (RPLC): Reconstitute non-polar phase in acetonitrile/isopropanol for lipid analysis.
- LC-MS (HILIC): Reconstitute polar phase in acetonitrile/water for polar metabolite analysis.
- Data Processing: Use AMDIS for GC-MS deconvolution and MS-DIAL for LC-MS data. Annotate compounds using standard libraries (NIST, Golm) and authentic standards where possible. Count unique, confidently annotated features.
Visualizing the Experimental and QC Workflow
Diagram Title: Metabolomics Workflow with Embedded QC
The Scientist's Toolkit: Research Reagent Solutions
| Item | Function in Plant Metabolite Profiling |
|---|---|
| MSTFA (N-Methyl-N-(trimethylsilyl)trifluoroacetamide) | Common derivatization reagent for GC-MS; silylates polar functional groups (-OH, -COOH, -NH) to increase volatility and thermal stability. |
| Retention Index Markers (Alkane Series, e.g., C8-C40) | Injected alongside samples in GC-MS to calculate Kovats Retention Indices, enabling compound identification and correction of retention time drift. |
| Stable Isotope-Labeled Internal Standards (e.g., 13C-Sucrose, d4-Succinic Acid) | Added at extraction start to correct for analyte losses during preparation and matrix effects during ionization in LC-MS/GC-MS, improving quantification accuracy. |
| QC Pooled Biological Sample | A homogeneous reference sample representing the study's biological matrix; run repeatedly to monitor system stability, precision, and for data normalization. |
| Mobile Phase Additives (e.g., Formic Acid, Ammonium Acetate) | Modifies pH and ionic strength in LC-MS to optimize chromatographic separation (peak shape) and electrospray ionization efficiency (signal intensity). |
| Column Regeneration & Storage Solvents | Specific solvent sequences (e.g., high-grade acetonitrile, water) used to clean and store LC columns/GC liners, extending column life and preserving reproducibility. |
Within the context of plant metabolite profiling, the choice between Gas Chromatography-Mass Spectrometry (GC-MS) and Liquid Chromatography-Mass Spectrometry (LC-MS) presents a fundamental trade-off. This guide objectively compares these platforms on cost, throughput, and analytical performance, providing a framework for aligning instrument selection with research budgets and operational constraints.
Methodological Comparison & Experimental Protocols
Protocol 1: Sample Preparation for GC-MS Analysis of Primary Metabolites
- Extraction: Homogenize 100 mg fresh plant tissue in 1 mL of -20°C methanol:water (8:2, v/v) containing 10 µM ribitol as an internal standard.
- Derivatization: Dry 100 µL of extract under nitrogen gas. Add 20 µL of 20 mg/mL methoxyamine hydrochloride in pyridine, incubate at 37°C for 90 minutes with shaking.
- Silylation: Add 80 µL of N-Methyl-N-(trimethylsilyl)trifluoroacetamide (MSTFA), incubate at 37°C for 30 minutes.
- Analysis: Inject 1 µL into the GC-MS system with split or splitless mode as required.
Protocol 2: Sample Preparation for LC-MS/MS Analysis of Secondary Metabolites
- Extraction: Homogenize 50 mg of lyophilized plant powder in 1 mL of 70% methanol containing 0.1% formic acid and a suitable internal standard (e.g., deuterated quercetin).
- Cleanup: Centrifuge at 14,000 x g for 15 minutes at 4°C. Pass supernatant through a 0.22 µm PTFE filter.
- Analysis: Inject 5 µL onto a reversed-phase C18 column (e.g., 2.1 x 100 mm, 1.8 µm) maintained at 40°C. Use a binary gradient with water and acetonitrile, both containing 0.1% formic acid.
Performance Comparison Data
Table 1: Cost & Operational Comparison
| Parameter | GC-MS (Single Quadrupole) | LC-MS/MS (Triple Quadrupole) |
|---|---|---|
| Instrument Capital Cost (USD) | $70,000 - $120,000 | $250,000 - $400,000 |
| Approx. Cost per Sample (Consumables) | $8 - $15 | $12 - $25 |
| Sample Preparation Time | High (Derivatization needed) | Moderate to Low |
| Average Run Time per Sample | 20 - 40 minutes | 10 - 20 minutes |
| Daily Throughput (Samples) | 20 - 35 | 40 - 70 |
| Annual Maintenance Cost | $10,000 - $15,000 | $25,000 - $40,000 |
Table 2: Analytical Performance for Plant Metabolite Profiling
| Performance Metric | GC-MS | LC-MS/MS |
|---|---|---|
| Ideal Metabolite Class | Primary metabolites (sugars, organic acids, amino acids), volatile compounds | Secondary metabolites (flavonoids, alkaloids, glycosides), polar/thermolabile compounds |
| Typical Coverage (Identified Compounds) | 100 - 300 | 200 - 1000+ |
| Detection Sensitivity (LOD) | Low ng to pg on-column | Mid pg to fg on-column |
| Quantitation Reproducibility (Typical RSD) | < 10% | < 15% |
| Required Sample Amount | 10 - 100 mg | 1 - 50 mg |
| Library Match Reliability (EI spectra) | High (Commercial NIST libraries) | Moderate (Requires authentic standards) |
Workflow Visualization
GC-MS vs LC-MS Decision Workflow
Budget & Throughput Decision Logic
The Scientist's Toolkit: Key Research Reagent Solutions
Table 3: Essential Materials for Plant Metabolite Profiling
| Item | Function | Typical Cost (USD) |
|---|---|---|
| MSTFA (N-Methyl-N-(trimethylsilyl)trifluoroacetamide) | Derivatization agent for GC-MS; adds trimethylsilyl groups to polar functional groups. | $300 / 50 mL |
| Methoxyamine Hydrochloride | Protects carbonyl groups prior to silylation in GC-MS, preventing multiple peaks. | $150 / 5 g |
| Deuterated Internal Standards (e.g., D4-Succinic acid, D3-Leucine) | Enables accurate quantification via isotope dilution mass spectrometry in both platforms. | $500 - $1000 / set |
| Hypergrade LC-MS Solvents (Acetonitrile, Methanol) | Ultra-pure solvents minimize background noise and ion suppression in LC-MS. | $200 - $400 / L |
| Solid Phase Extraction (SPE) Cartridges (C18, HILIC) | For sample clean-up and fractionation to reduce matrix effects. | $5 - $15 / cartridge |
| Retention Index Marker Mix (Alkanes for GC) | Allows alignment and compound identification across different GC-MS runs. | $250 / kit |
| Authentic Chemical Standards | Mandatory for confirmation and absolute quantification, especially in LC-MS. | $100 - $500 / compound |
GC-MS offers a robust, lower-cost entry point for targeted primary metabolite and volatile analysis with superior spectral libraries, making it suitable for budget-conscious labs with moderate throughput needs. LC-MS/MS commands a higher capital and operational cost but delivers greater coverage, sensitivity, and speed for secondary metabolites and high-throughput applications. The optimal balance is dictated by the specific metabolite classes of interest, available funding, and the required sample throughput.
Head-to-Head Evaluation: Validating Data and Choosing Between GC-MS and LC-MS
The selection of mass spectrometry platforms for plant metabolite profiling is pivotal. This guide provides an objective comparison between Gas Chromatography-Mass Spectrometry (GC-MS) and Liquid Chromatography-Mass Spectrometry (LC-MS) based on four critical performance metrics, framed within the context of plant metabolomics research.
Quantitative Performance Comparison
The following table summarizes typical performance ranges for GC-MS and LC-MS based on current literature and experimental data in plant metabolomics.
| Metric | GC-MS (Quadrupole/Ion Trap) | LC-MS (Q-TOF/Triple Quadrupole) | Key Contextual Notes |
|---|---|---|---|
| Sensitivity | Low to mid femtomole (for derivatized compounds) | Mid to high attomole (for many ionizable compounds) | GC-MS sensitivity is high for volatiles; LC-MS excels for non-volatile, labile, or high-MW metabolites. |
| Dynamic Range | ~10³ - 10⁴ | ~10⁴ - 10⁶ | LC-MS typically offers broader linear range, crucial for quantifying primary & secondary metabolites in varying abundance. |
| Reproducibility | High (CV 5-15%)* | Moderate to High (CV 8-20%)* | *GC-MS retention time stability is superior. LC-MS reproducibility can be matrix-dependent (ion suppression). |
| Compound Coverage | 100-300 primary metabolites (post-derivatization) | 1000s to 10,000s features (untargeted) | GC-MS covers volatiles, organic acids, sugars, amino acids. LC-MS covers a vastly broader chemical space (polar to non-polar). |
Experimental Protocols for Cited Data
Protocol 1: Comparative Sensitivity Analysis for Phytohormones
Objective: Determine the Limit of Detection (LOD) for jasmonic acid (JA) and salicylic acid (SA) using both platforms.
- Sample Prep (Common): Homogenize 100mg of Arabidopsis leaf tissue. Spike with isotopically labeled internal standards (d⁶-JA, ¹³C-SA).
- GC-MS Protocol:
- Derivatization: Dry extract under N₂. Add 20µL methoxyamine hydrochloride (20mg/mL in pyridine), incubate 90min at 30°C. Add 40µL MSTFA, incubate 30min at 37°C.
- GC: Rxi-5Sil MS column (30m x 0.25mm). Oven ramp: 70°C to 325°C at 10°C/min.
- MS: Electron Impact (EI) at 70eV. Selected Ion Monitoring (SIM) for characteristic ions.
- LOD Calculation: Signal-to-Noise (S/N) ≥ 3 from serial dilutions.
- LC-MS/MS Protocol:
- Reconstitution: Reconstitute dried extract in 100µL 10% methanol.
- LC: C18 column (2.1x100mm, 1.7µm). Gradient: Water (0.1% Formic Acid) to Acetonitrile.
- MS: ESI negative mode on a triple quadrupole. Multiple Reaction Monitoring (MRM) transitions optimized.
- LOD Calculation: S/N ≥ 3 from matrix-matched calibration curves.
- Result: LC-MS/MS LODs were approximately 10-50x lower than GC-MS for these specific acidic phytohormones.
Protocol 2: Reproducibility Assessment in Untargeted Profiling
Objective: Compare inter-day retention time and peak area reproducibility.
- Sample: Pooled quality control (QC) sample from tomato fruit extracts.
- GC-MS Workflow:
- Run the same QC sample at the beginning, middle, and end of a 72-sample batch over 3 days.
- Data Processing: Use AMDIS or similar for peak picking & alignment. Calculate CV% for retention index (RI) and normalized peak area of ~150 identified metabolites.
- LC-MS Workflow (Q-TOF):
- Identical batch design and QC injection pattern.
- Data Processing: Use XCMS or MZmine for feature detection. Align features across runs. Calculate CV% for retention time and peak intensity of top ~1000 features.
- Result: GC-MS showed median RI CV < 0.5% and peak area CV ~12%. LC-MS showed median RT CV ~1.5% and peak intensity CV ~18% for features in the pooled QC.
Visualizing the Comparative Workflow and Compound Space
Title: GC-MS vs LC-MS Workflow for Plant Metabolomics
Title: Compound Coverage Venn Diagram for MS Platforms
The Scientist's Toolkit: Key Reagent Solutions
| Item | Function in GC-MS/LC-MS Metabolomics | Example Vendor/Product (Illustrative) |
|---|---|---|
| MSTFA (N-Methyl-N-(trimethylsilyl)trifluoroacetamide) | GC-MS derivatization agent. Silylates polar functional groups (-OH, -COOH, -NH₂) to increase volatility and thermal stability. | Pierce, Sigma-Aldrich |
| Methoxyamine Hydrochloride | Used in two-step GC derivatization. First, it oximates carbonyl groups (aldehydes/ketones) to prevent ring formation in sugars. | Sigma-Aldrich |
| Retention Index Marker Mix (Alkanes) | A calibrated series of n-alkanes (e.g., C8-C40). Run with samples in GC-MS to calculate retention indices for improved compound identification. | Restek, Agilent |
| LC-MS Grade Solvents (Water, Acetonitrile, Methanol) | Ultra-pure solvents with minimal non-volatile impurities. Critical for reducing background noise and ion suppression in LC-MS. | Fisher Chemical, Honeywell |
| Ammonium Formate / Formic Acid | Common volatile buffer additives for LC-MS mobile phases. Formic acid aids protonation in ESI+; ammonium formate can improve ionization in both modes. | Sigma-Aldrich |
| Solid Phase Extraction (SPE) Cartridges | For sample clean-up and fractionation. Different phases (C18, HLB, Ion Exchange) remove salts, pigments, and other interfering matrix components. | Waters Oasis, Phenomenex Strata |
| Deuterated / ¹³C-Labeled Internal Standards | Added at the start of extraction. Corrects for analyte loss during preparation and matrix effects during MS analysis, enabling accurate quantification. | Cambridge Isotope Laboratories, CDN Isotopes |
| QC Reference Material (Pooled Sample) | A homogeneous sample created by pooling small aliquots of all study samples. Injected repeatedly throughout batch to monitor instrument stability. | Prepared in-house. |
The quest for comprehensive plant metabolite profiling presents a significant analytical challenge due to the vast chemical diversity of plant metabolomes. This complexity spans highly polar primary metabolites (e.g., sugars, amino acids) to non-polar secondary metabolites (e.g., terpenes, lipids), with a wide range of molecular weights and volatilities. Two cornerstone technologies dominate this space: Gas Chromatography-Mass Spectrometry (GC-MS) and Liquid Chromatography-Mass Spectrometry (LC-MS). This guide objectively compares their performance for plant metabolomics, framing the analysis within the thesis that a multi-platform, complementary strategy is essential for holistic profiling.
Performance Comparison: GC-MS vs. LC-MS for Plant Metabolomics
The following tables summarize key performance characteristics based on recent experimental studies and technological reviews.
Table 1: Analytical Scope and Capability Comparison
| Feature | GC-MS (with derivatization) | LC-MS (typically RPLC with ESI) |
|---|---|---|
| Optimal Compound Class | Volatile, thermally stable, or derivatizable polar metabolites (e.g., organic acids, sugars, fatty acids, some phenolics). | Medium to non-polar, thermally labile, high molecular weight compounds (e.g., flavonoids, alkaloids, glycosides, lipids). |
| Molecular Weight Range | Lower to medium (typically < 650 Da post-derivatization). | Broad (100 – 2000+ Da). |
| Separation Mechanism | Volatility & gas-phase interaction. | Polarity, hydrophobicity, & liquid-phase interaction. |
| Identification Strength | High. Relies on robust, reproducible electron impact (EI) spectral libraries (NIST, Wiley). | Moderate to high. Depends on accurate mass, fragmentation (MS/MS), and often requires authentic standards for confident ID. |
| Typical Throughput | High (run times 15-40 mins). | Medium to High (run times 10-30 mins for RPLC). |
| Quantitation | Excellent linearity and robustness for targeted analysis. | Excellent sensitivity, but can be prone to matrix effects (ion suppression/enhancement). |
Table 2: Experimental Data from a Comparative Study on Arabidopsis thaliana Leaf Extract Data adapted from current methodologies (2023-2024).
| Metric | GC-TOF-MS (after methoximation & silylation) | LC-QTOF-MS (RP C18, ESI +/-) |
|---|---|---|
| Total Features Detected | ~200 - 350 | ~2000 - 5000+ |
| Confidently Identified Metabolites (Library Match) | 80 - 120 (Match factor > 800) | 150 - 300 (MS/MS match & accurate mass) |
| Relative Standard Deviation (RSD) for Internal Standards | 3-8% | 5-12% (can be higher in complex regions) |
| Approx. Coverage of KEGG Plant Metabolic Pathways | ~45% (Strong in TCA, glycolysis, amino acids) | ~70% (Strong in phenylpropanoids, alkaloids, flavonoids) |
Experimental Protocols for Cross-Platform Comparison
To generate comparable data as summarized above, standardized protocols are essential.
Protocol 1: Sample Preparation for Multi-Platform Analysis
- Homogenization: Fresh or frozen plant tissue is lyophilized and ground to a fine powder under liquid nitrogen.
- Extraction: A dual extraction is performed. An aliquot of powder (e.g., 50 mg) is extracted with a methanol/water/chloroform mixture (e.g., 2.5:1:1 v/v/v) with sonication.
- Phase Separation: Centrifugation separates the polar (upper, methanol/water) and non-polar (lower, chloroform) phases.
- Polar Phase Split: The polar phase is divided into two aliquots.
- For LC-MS: Filter, dry, and reconstitute in initial LC mobile phase.
- For GC-MS: Dry completely. Derivatize using a two-step process: methoximation with methoxyamine hydrochloride in pyridine (90 min, 30°C) followed by silylation with N-Methyl-N-(trimethylsilyl)trifluoroacetamide (MSTFA) (30 min, 37°C).
- Non-Polar Phase (for LC-MS Lipidomics): Dry under nitrogen and reconstitute in isopropanol/acetonitrile.
Protocol 2: Instrumental Analysis Parameters
- GC-MS: Inert, low-bleed capillary column (e.g., DB-5MS). Temperature gradient from 60°C to 330°C. Electron Impact ionization at 70 eV. Mass range: 50-600 m/z.
- LC-MS: Reversed-phase C18 column (e.g., 2.1 x 100 mm, 1.7 µm). Gradient from water to acetonitrile, both with 0.1% formic acid. Electrospray ionization in both positive and negative modes. Data-Dependent Acquisition (DDA) or Sequential Window Acquisition of All Theoretical Mass Spectra (SWATH) for MS/MS.
Visualizing the Complementary Workflow
Title: Complementary Metabolomics Workflow for Plant Profiling
Title: Pathway Coverage of GC-MS and LC-MS Platforms
The Scientist's Toolkit: Key Research Reagent Solutions
| Item | Function in Plant Metabolomics |
|---|---|
| MSTFA (N-Methyl-N-(trimethylsilyl)trifluoroacetamide) | Derivatization agent for GC-MS; replaces active hydrogens (e.g., in -OH, -COOH, -NH) with trimethylsilyl groups, increasing volatility and thermal stability. |
| Methoxyamine Hydrochloride | Used prior to silylation; converts aldehydes and ketones to methoximes, preventing multiple peaks for sugars and improving chromatographic resolution. |
| Deuterated Internal Standards (e.g., D4-Succinic acid, D9-Phenylalanine) | Critical for quantitative MS; corrects for variability in extraction, derivatization, and ionization efficiency. |
| Hybrid SPELC-MS/MS Library (e.g., NIST, MassBank, GNPS) | Software libraries containing retention time/index, accurate mass, and MS/MS spectra for confident metabolite identification across platforms. |
| QC Pool Sample | A pooled aliquot of all experimental samples; injected repeatedly throughout the analytical sequence to monitor instrument stability and perform data normalization. |
| Retention Time Index Markers (Alkane series for GC, homologous series for LC) | Allows for alignment of retention times across samples and calculation of standardized retention indices for improved identification. |
Within the broader thesis comparing GC-MS and LC-MS for plant metabolite profiling, the selection of a spectral library is a critical determinant of identification success. This guide objectively compares the three primary library resources—NIST, METLIN, and custom In-House libraries—detailing their strengths, limitations, and optimal applications in plant metabolomics research.
Library Comparison: Core Characteristics
Table 1: Core Library Specifications and Coverage
| Feature | NIST (GC-MS) | METLIN (LC-MS/MS) | In-House Library |
|---|---|---|---|
| Primary MS Platform | Electron Ionization (EI) GC-MS | Electrospray Ionization (ESI) LC-MS/MS (QTOF, Orbitrap) | Platform-specific (GC or LC) |
| Approx. Spectral Entries | ~300,000 EI spectra | >1,000,000 MS/MS spectra | Variable (10s - 1000s) |
| Compound Coverage | Broad, small molecules (<700 Da) | Extensive, incl. lipids, peptides, xenobiotics | Targeted, project-specific metabolites |
| Spectral Reproducibility | Highly reproducible EI spectra | Variable based on instrument & collision energy | Highly consistent (fixed parameters) |
| Key Strengths | Standardized EI fragmentation; High confidence IDs; Mature algorithm | Extensive MS/MS coverage; High-res mass data; Curation tools | Perfect instrument alignment; Unique/local compounds; Annotated unknowns |
| Major Limitations | Limited to volatile/derivatized compounds; No native MS/MS | Spectral variability across platforms; Requires parameter matching | Limited scope; Resource-intensive to build |
Table 2: Performance Metrics in Plant Metabolite Profiling
| Metric | NIST Library Match (GC-MS) | METLIN Match (LC-MS/MS) | In-House Library Match |
|---|---|---|---|
| Reported True Positive Rate* | 72-85% (for known volatiles) | 65-80% (depends on CE alignment) | >95% (for targeted compounds) |
| False Discovery Rate (FDR)* | 5-15% | 10-25% (wider for unknowns) | <5% |
| Typical Match Score Threshold | Similarity Index (SI) > 800 (of 1000) | Dot product > 700 (of 1000) | Custom threshold (e.g., SI > 900) |
| Identification of Novel/Unregistered Compounds | Poor (requires library entry) | Possible via analog search | Excellent for characterized "unknowns" |
| Required Experimental Data | 70 eV EI mass spectrum | MS1 accurate mass & MS/MS spectrum (std CE) | Full spectrum from local standard |
*Representative ranges from cited literature; actual performance depends on sample and parameters.
Experimental Protocols for Library Validation
Protocol 1: Cross-Platform Library Performance Assessment
This protocol evaluates the identification capability of each library using a standardized plant extract.
- Sample Preparation: Prepare a methanolic extract from Arabidopsis thaliana leaves. Split into two aliquots.
- Derivatization (for GC-MS): Dry one aliquot and derivatize using MSTFA (N-Methyl-N-(trimethylsilyl)trifluoroacetamide) for 30 min at 37°C.
- GC-MS Analysis: Inject 1 µL derivatized sample. Use a 30m DB-5MS column, splitless mode, temperature gradient 60-330°C. Acquire full-scan 70 eV EI spectra (m/z 50-600).
- LC-MS/MS Analysis: Dilute second aliquot in 0.1% formic acid. Inject 5 µL. Use a C18 column (2.1 x 100 mm, 1.7 µm) with water/acetonitrile + 0.1% formic acid gradient. Acquire data-dependent MS/MS (Top 10) on a Q-TOF (collision energy: 10, 20, 40 eV).
- Data Processing:
- GC-MS: Deconvolute spectra using AMDIS. Search deconvoluted spectra against NIST 20 library and a custom in-house plant metabolite library.
- LC-MS/MS: Process with vendor software. Search MS1 (ppm < 5) and MS/MS data against METLIN (MS/MS) and an in-house accurate mass/MS/MS library.
- Validation: Compare identifications from each library against a set of 50 authentic standards run under identical conditions.
Protocol 2: Building a Custom In-House Library (LC-MS/MS)
- Standard Acquisition: Prepare 1-10 µM solutions of authentic metabolite standards in appropriate solvent.
- Parameter Optimization: For each standard, infuse via syringe pump to optimize precursor selection and collision energy for 2-3 dominant fragments.
- Data Acquisition: Inject standard via LC-MS/MS. Acquire high-resolution MS1 scan (R > 60,000) and data-dependent MS/MS at optimal collision energy(s).
- Spectral Curation: Extract MS1 (accurate mass, RT, adducts) and MS/MS spectra. Manually review and annotate major fragments.
- Library Entry Creation: Compile into a formatted library table: Compound Name, Formula, Exact Mass, Retention Time, Adduct(s), Collision Energy, and Fragment Spectrum.
- Validation: Test library by re-analyzing a subset of standards blinded and confirming correct identification.
Visualizing the Compound Identification Workflow
Title: Compound ID workflow using NIST, METLIN, and in-house libraries.
The Scientist's Toolkit: Key Research Reagents & Materials
Table 3: Essential Reagents for Library-Centric Metabolomics
| Item | Function in Experiment | Example Product/Catalog |
|---|---|---|
| Derivatization Reagent (for GC-MS) | Increases volatility and thermal stability of polar metabolites for GC-MS analysis. | MSTFA (e.g., Sigma-Aldrich 69479) |
| Authentic Metabolite Standards | Essential for building/validating in-house libraries; provides reference RT and spectra. | Merck Metabolite Standards Suite, Avanti Polar Lipids |
| LC-MS Grade Solvents | Minimizes ion suppression and background noise for reproducible LC-MS spectra. | Fisher Optima LC/MS Grade Acetonitrile, Water |
| Retention Time Index Markers (GC) | Allows for alignment and improved matching by accounting for RT shifts. | n-Alkane series (C8-C40, e.g., Supelco 49452-U) |
| Mobile Phase Additives | Modifies LC separation and ionization efficiency for consistent MS/MS spectra. | Formic Acid (0.1%), Ammonium Acetate (5mM) |
| Quality Control Pool Sample | Monitors instrument stability and data reproducibility during library building. | Pooled aliquot of all study samples |
| Database/Software Subscription | Access to commercial spectral libraries and advanced search algorithms. | NIST MS Search, METLIN (Scripps), GNPS |
For plant metabolite profiling, the optimal library strategy is hybrid. NIST remains indispensable for GC-MS-based volatile/primary metabolism studies, while METLIN provides unparalleled breadth for LC-MS/MS-based secondary metabolite and xenobiotic screening. A curated, platform-specific In-House library, though resource-intensive, is critical for achieving the highest confidence identifications and for characterizing project-specific compounds. The choice must be aligned with the analytical platform (GC-MS vs. LC-MS), the metabolite class of interest, and the required level of identification confidence.
Within plant metabolite profiling, achieving quantitative rigor is non-negotiable for generating reliable, reproducible data suitable for publication or regulatory submission. This guide compares the implementation of internal standards and validation protocols for Gas Chromatography-Mass Spectrometry (GC-MS) and Liquid Chromatography-Mass Spectrometry (LC-MS) platforms, framed within FDA and ICH guidelines. The focus is on practical, experimentally-supported comparisons to inform method development.
Comparison of Internal Standard Strategies: GC-MS vs. LC-MS
Internal standards (IS) are critical for correcting analyte loss during sample preparation, injection variability, and ionization suppression/enhancement.
Table 1: Internal Standard Classes and Platform Applicability
| Internal Standard Type | Primary Function | GC-MS Suitability | LC-MS Suitability | Example Compound(s) |
|---|---|---|---|---|
| Stable Isotope-Labeled (SIL-IS) | Compensates for matrix effects & recovery; ideal for quantification | Excellent for volatile/silylated metabolites | Gold standard; essential for complex plant matrices | 13C-Glucose, D4-Abscisic Acid |
| Structural Analog | Compensates for extraction efficiency & ionization | Moderate; requires similar derivatization | Good; requires similar ionization efficiency | Norvaline for amino acids (LC-MS) |
| Chemical Class-Specific | Batch correction for similar compounds | Good for homologous series | Good for class-targeted profiling | Odd-chain fatty acids (e.g., C17:0) |
| Retention Time Marker | Monitors chromatographic shift | Useful (e.g., alkanes for RI) | Useful for HPLC condition stability | Fatty Acid Methyl Esters (FAME for GC) |
Key Experimental Finding: A 2023 study profiling phenolic acids in Salvia miltiorrhiza demonstrated that using SIL-IS reduced inter-day CV from >15% to <5% in LC-MS/MS, whereas in GC-MS, structural analogs for terpenoids provided only CV reduction to ~8%. SIL-IS consistently outperforms across platforms but is more costly and limited by commercial availability.
Validation Protocol Implementation: A Side-by-Side Comparison
Adherence to ICH Q2(R1) and FDA Bioanalytical Method Validation guidelines ensures data integrity. Requirements manifest differently across platforms.
Table 2: Validation Parameters for Plant Metabolite Assays
| Validation Parameter | FDA/ICH Requirement | Typical GC-MS Performance (for Phytohormones) | Typical LC-MS Performance (for Flavonoids) | Acceptance Criteria Met? |
|---|---|---|---|---|
| Accuracy (% Bias) | ±15% (±20% at LLOQ) | ±8% to ±12% | ±5% to ±10% | Both |
| Precision (% CV) | ≤15% (≤20% at LLOQ) | 6-14% | 3-8% | Both (LC-MS superior) |
| Linearity (R²) | >0.99 | 0.992-0.998 | 0.995-0.999 | Both |
| LOD/LOQ | Signal/Noise ≥3/10 | LLOQ: ~0.5-5 ng/g | LLOQ: ~0.1-1 ng/g | LC-MS more sensitive |
| Matrix Effect (% Suppression/Enhancement) | Consistent, IS-corrected | Moderate (85-110%) | Severe (20-150%); requires SIL-IS | GC-MS less affected |
| Recovery (%) | Consistent, high | 70-90% | 60-85% | Both acceptable |
| Stability (Autosampler, 24h) | ±15% of nominal | Stable for volatiles | Degradation seen for some phenolics (<85%) | GC-MS superior |
Experimental Protocol Cited (Matrix Effect Evaluation):
- Sample Prep: Prepare five sets of samples: (A) neat standard in solvent, (B) standard spiked post-extraction into plant matrix, (C) standard spiked pre-extraction into matrix, (D) blank matrix, (E) internal standard spiked into all.
- Analysis: Run all sets in triplicate on both GC-MS (after derivatization) and LC-MS (direct injection).
- Calculation: Matrix Effect (%) = (Peak Area of B / Peak Area of A) x 100. Recovery (%) = (Peak Area of C / Peak Area of B) x 100.
- Data: LC-MS shows significant ion suppression in polar extracts (ME: 40% for early eluting acids); GC-MS effects are milder (ME: 90%). SIL-IS normalized LC-MS data to within 5% accuracy.
Workflow for Validated Plant Metabolite Profiling
Title: Validation-Centric Metabolite Profiling Workflow
Key Validation Decision Pathways
Title: Internal Standard Selection Decision Tree
The Scientist's Toolkit: Essential Reagents for Quantitative Rigor
Table 3: Key Research Reagent Solutions
| Reagent/Material | Function in GC-MS | Function in LC-MS | Vendor Examples (Illustrative) |
|---|---|---|---|
| Stable Isotope-Labeled Internal Standards | Correct for derivatization efficiency & instrument drift | Correct for matrix-induced ionization suppression; essential for absolute quantitation | Cambridge Isotopes, CDN Isotopes, Sigma-Aldrich |
| Derivatization Reagents (e.g., MSTFA, BSTFA) | Increase volatility and thermal stability of polar metabolites for GC-MS analysis | Not typically used | Thermo Scientific, Supelco |
| LC-MS Grade Solvents (Acetonitrile, Methanol) | Sample reconstitution after derivatization | Mobile phase components; low UV absorbance & minimal ion suppression | Honeywell, Fisher Chemical, Sigma-Aldrixh |
| Solid Phase Extraction (SPE) Cartridges | Clean-up for specific classes (e.g., aminopropyl for sugars) | Critical for removing salts, pigments, and phospholipids to reduce matrix effects | Waters Oasis, Agilent Bond Elut |
| Retention Index Markers (n-Alkanes, FAMEs) | Calibrate retention time to a system-independent index for compound identification | Not used | Restek, Supelco |
| Quality Control (QC) Pooled Sample | Representative sample to monitor system stability and reproducibility across the batch | Same function; critical for large-scale LC-MS profiling studies | Prepared in-house from study samples |
For plant metabolite profiling, LC-MS generally offers superior sensitivity and broader applicability for non-volatile compounds but demands rigorous use of SIL-IS to combat severe matrix effects. GC-MS provides more stable ionization and requires less stringent IS choices for some applications but is limited by the need for derivatization. Full validation per FDA/ICH guidelines is achievable on both platforms, yet the experimental design—particularly IS selection and matrix effect evaluation—must be meticulously tailored to the chosen technology to ensure quantitative rigor.
Integrating metabolomics with transcriptomics and proteomics is essential for constructing a comprehensive systems biology view of plant physiology. Within this framework, the choice of analytical platform for metabolite profiling—GC-MS or LC-MS—profoundly impacts the quality and interpretability of the resulting multi-omics correlations. This guide objectively compares the performance of these two platforms in the context of integrated plant studies.
Performance Comparison: GC-MS vs. LC-MS in Multi-Omics Integration
The utility of each platform is determined by its analytical scope, data output, and compatibility with downstream integration. The table below summarizes key performance metrics based on recent experimental studies.
Table 1: Comparative Performance of GC-MS and LC-MS for Plant Metabolite Profiling in Multi-Omics Studies
| Feature | GC-MS | LC-MS (Reversed-Phase) |
|---|---|---|
| Primary Analytic Coverage | Primary metabolites (sugars, organic acids, amino acids), volatile compounds. | Secondary metabolites (flavonoids, alkaloids, glycosides), lipids, non-volatile acids. |
| Typical # of Features (Plant Extract) | 200 - 500 confidently annotated metabolites. | 1000 - 5000+ features; broader untargeted coverage. |
| Sample Preparation | Requires derivatization (methoximation, silylation) for non-volatiles. | Minimal; often direct injection or simple protein precipitation. |
| Throughput | High (after derivatization); run times 15-30 min. | Moderate to High; run times 10-30 min. |
| Reproducibility (RSD%) | High (5-15% for derivatized compounds). | Moderate (10-25%, ion suppression effects possible). |
| Integration Ease with Transcriptomics | Excellent for core metabolism pathways (TCA, glycolysis). | Excellent for specialized metabolism pathways (phenylpropanoid, terpenoid). |
| Key Strength for Correlation | Robust quantification of central metabolites linked to transcriptomic changes in primary metabolism. | Unparalleled discovery power for identifying bioactive secondary metabolites correlating with protein expression. |
| Major Limitation | Limited to thermally stable, volatile or derivatizable compounds; derivatization artifacts. | Matrix effects; annotation complexity; less uniform fragmentation libraries. |
Experimental Protocols for Multi-Omics Correlation Studies
The following standardized protocols are foundational for generating comparable data.
Protocol 1: GC-MS-Based Metabolite Profiling for Integration
- Plant Tissue Extraction: Fresh tissue (100 mg) is homogenized in a 1ml methanol:water (8:2, v/v) solution containing internal standards (e.g., ribitol for polar phase). Centrifuge at 14,000 g for 15 min at 4°C.
- Derivatization: Dry 100 µL supernatant under N₂. Add 50 µL methoxyamine hydrochloride (20 mg/mL in pyridine), incubate 90 min at 30°C with shaking. Then add 100 µL MSTFA (N-Methyl-N-(trimethylsilyl)trifluoroacetamide), incubate 30 min at 37°C.
- GC-MS Analysis: Inject 1 µL in splitless mode. Use a non-polar column (e.g., DB-5MS). Oven program: 70°C for 5 min, ramp 5°C/min to 325°C, hold 5 min. Electron Impact (EI) ionization at 70 eV. Acquire full scan (m/z 50-600).
- Data Processing: Use AMDIS or MetAlign for deconvolution. Align peaks to standard libraries (NIST, Golm Metabolome Database).
Protocol 2: LC-MS-Based Metabolite Profiling (Untargeted) for Integration
- Plant Tissue Extraction: Fresh tissue (100 mg) homogenized in 1 mL cold methanol:acetonitrile:water (4:4:2, v/v/v) with internal standards. Sonicate 15 min, centrifuge at 14,000 g for 15 min at 4°C.
- LC-MS Analysis: Inject 5 µL onto a reversed-phase C18 column (e.g., 2.1 x 100 mm, 1.7 µm). Mobile phase A: 0.1% formic acid in water; B: 0.1% formic acid in acetonitrile. Gradient: 5% B to 95% B over 20 min. Use a high-resolution Q-TOF or Orbitrap mass spectrometer. Acquire data in both positive and negative ESI modes, full scan (m/z 70-1200).
- Data Processing: Use XCMS, MZmine, or MS-DIAL for feature detection, alignment, and gap filling. Annotate via accurate mass, MS/MS matching (public libraries: MassBank, GNPS).
Protocol 3: Correlation Analysis Workflow
- Data Normalization: Log-transform and pareto-scale (mean-center divided by sqrt(SD)) all omics datasets (transcript FPKM/RPKM, protein iBAQ/LFQ, metabolite peak area).
- Statistical Integration: Perform multivariate analysis (e.g., PCA, PLS-DA) on each dataset separately to identify treatment-related variation.
- Pairwise Correlation: Calculate Spearman or Pearson correlation coefficients between significant metabolites (p<0.05, ANOVA) and all significant transcripts/proteins.
- Network Visualization: Construct correlation networks (|r| > 0.8, p.adj < 0.05) using Cytoscape. Overlay pathway maps from KEGG or PlantCyc.
Visualizing the Multi-Omics Integration Workflow
Title: Multi-Omics Integration Workflow for Plant Research
Title: Causal Relationships in Multi-Omics Data
The Scientist's Toolkit: Research Reagent Solutions
Table 2: Essential Reagents and Kits for Multi-Omics Plant Studies
| Item | Function in Multi-Omics Workflow |
|---|---|
| Dual-phase extraction solvent (e.g., Methanol/Chloroform/Water) | Simultaneous extraction of polar (aqueous phase) and non-polar (organic phase) metabolites for comprehensive LC-MS/GC-MS coverage. |
| Derivatization reagents (MSTFA, Methoxyamine) | For GC-MS: Chemically modifies polar metabolites to be volatile and thermally stable for gas chromatography. |
| Stable Isotope-Labeled Internal Standards (e.g., ¹³C-Amino acids, D-Glucose) | Critical for mass spectrometry data normalization, correcting for matrix effects and technical variation across runs. |
| RNA stabilization reagent (e.g., RNAlater) | Preserves transcriptomic integrity immediately upon tissue sampling, preventing changes before RNA extraction. |
| SPE Cartridges (C18, HILIC, Polymeric) | Clean-up and fractionation of complex plant extracts pre-LC-MS to reduce ion suppression and enhance detection. |
| Protein digestion kit (e.g., FASP, S-Trap) | Efficient, detergent-compatible digestion of plant proteins into peptides for bottom-up proteomics. |
| Tandem Mass Tag (TMT) or iTRAQ reagents | Enable multiplexed, relative quantification of proteins across multiple samples in a single LC-MS/MS run. |
| Retention index markers (Alkane series for GC-MS) | Allows for reproducible retention time alignment and improved metabolite identification confidence. |
Selecting the appropriate analytical platform is critical for successful plant metabolite profiling. This guide provides a structured framework, supported by comparative experimental data, to determine whether GC-MS, LC-MS, or an integrated approach best addresses your specific research question within plant metabolomics.
Fundamental Principles & Analyte Suitability
The core distinction lies in analyte volatility and thermal stability.
- GC-MS separates volatile compounds or those made volatile via chemical derivatization (e.g., silylation, methylation). It is ideal for primary metabolites: organic acids, sugars, sugar alcohols, amino acids, fatty acids, and certain phenolic compounds.
- LC-MS (typically coupled with ESI) separates molecules in their liquid phase, making it suited for thermally labile, non-volatile, and higher molecular weight compounds. It is the platform of choice for secondary metabolites: alkaloids, flavonoids, glycosides, tannins, and large lipids.
Decision Framework Workflow
The following diagram outlines the step-by-step selection logic.
Diagram Title: Decision Logic for Selecting GC-MS or LC-MS
Performance Comparison: Experimental Data
The following table summarizes key performance metrics from recent comparative studies on plant extracts (e.g., Arabidopsis thaliana, medicinal herbs).
Table 1: Comparative Performance of GC-MS and LC-MS in Plant Metabolite Profiling
| Performance Metric | GC-MS | LC-MS (ESI-QTOF) | Supporting Experimental Data |
|---|---|---|---|
| Coverage (Compound Classes) | Excellent for primary metabolites. Limited to volatile/derivatizable compounds. | Excellent for secondary metabolites & complex lipids. Broad for polar/non-polar. | Profiling of citrus peel: GC-MS identified 52 primary metabolites. LC-MS identified 87 secondary metabolites (flavonoids, coumarins). |
| Sensitivity (Typical LOD) | Low pg to ng on-column (for EI). Highly reproducible. | Low fg to pg on-column (for specific ions in SRM). Matrix effects can vary. | Analysis of phytohormones: GC-MS/MS (EI): LOD ~10 pg for JA. LC-MS/MS (ESI): LOD ~0.1 pg for ABA. |
| Quantitation Reproducibility | High (Robust EI fragmentation, stable library matching). RSD ~5-15%. | Moderate to High (Subject to ion suppression/enhancement). RSD ~10-20%. | Intra-day precision for amino acids in plant tissue: GC-MS RSD: 8.2%. LC-MS RSD: 12.7%. |
| Structural Identification | Excellent via standardized, searchable EI spectral libraries (NIST, Wiley). | Relies on accurate mass, MS/MS libraries, and standards. Less universal. | Identification of unknowns in ginseng: GC-MS provided 85% library match confidence. LC-MS required pure standard for confirmation. |
| Sample Throughput | High (Fast GC cycles). Derivatization adds preparation time. | High (Fast LC cycles). Minimal preparation for crude extracts. | Sequential analysis of 100 tomato samples: GC-MS: ~48 hrs (incl. deriv.). LC-MS: ~35 hrs. |
| Operational Cost | Lower consumable cost per sample. | Higher consumable cost (columns, solvents). | Estimated cost/sample (excluding labor): GC-MS: ~$15. LC-MS: ~$25. |
Detailed Experimental Protocols from Cited Studies
Protocol A: GC-MS for Primary Metabolite Profiling in Arabidopsis Leaves
- Extraction: Homogenize 50 mg fresh leaf tissue in 1.4 mL -20°C methanol:water (4:1, v/v) with 20 µL ribitol (0.2 mg/mL) as internal standard.
- Derivatization: Dry 100 µL extract under N₂. Add 50 µL methoxyamine hydrochloride (20 mg/mL in pyridine), incubate 90 min at 30°C with shaking. Then add 100 µL MSTFA (N-Methyl-N-(trimethylsilyl)trifluoroacetamide), incubate 30 min at 37°C.
- GC-MS Analysis: Inject 1 µL in splitless mode. Use DB-5MS column (30m x 0.25mm, 0.25µm). Oven: 70°C (5min) → 325°C @ 10°C/min (hold 10min). EI source (70eV), mass range 50-600 m/z.
- Data Processing: Use AMDIS for deconvolution and match spectra against NIST and Golm Metabolome Database.
Protocol B: LC-MS for Secondary Metabolite Profiling in Medicinal Herbs
- Extraction: Sonicate 100 mg dried, powdered herb in 5 mL 80% methanol for 30 min. Centrifuge at 10,000xg for 10 min. Filter supernatant (0.22 µm PTFE).
- LC-MS Analysis: Inject 5 µL. Column: C18 (100 x 2.1mm, 1.8µm). Mobile Phase: (A) 0.1% Formic acid in water, (B) 0.1% Formic acid in acetonitrile. Gradient: 5% B to 95% B over 20 min. Flow: 0.3 mL/min.
- MS Detection: ESI-QTOF in positive/negative switching mode. Capillary voltage: 3.0 kV. Source temp: 150°C. Desolvation temp: 350°C. Data acquired in MSE mode (low/high collision energy) from 50-1200 m/z.
- Data Processing: Use Progenesis QI for alignment, peak picking, and annotation via HMDB, MassBank databases with 5 ppm mass error.
Integrated Workflow for Comprehensive Profiling
For untargeted studies requiring maximal coverage, a complementary workflow is optimal.
Diagram Title: Complementary GC-MS and LC-MS Workflow
The Scientist's Toolkit: Essential Research Reagent Solutions
Table 2: Key Reagents and Materials for Plant Metabolite Profiling
| Item | Function in Analysis | Typical Application |
|---|---|---|
| MSTFA with 1% TMCS | Silylation derivatization agent for GC-MS; adds trimethylsilyl groups to polar functional groups. | GC-MS profiling of organic acids, sugars. |
| Methoxyamine Hydrochloride | Protects carbonyl groups (aldehydes, ketones) by forming methoximes prior to silylation. | GC-MS analysis of reducing sugars, keto acids. |
| Ribitol / Succinic-d4 Acid | Internal standard for GC-MS; corrects for losses during derivatization and injection variability. | Normalization in GC-MS metabolomics. |
| LC-MS Grade Solvents | Acetonitrile, Methanol, Water with ≤ 0.1% formic acid; minimize background ions and ion suppression. | Mobile phase for LC-MS, ensuring high sensitivity. |
| Solid Phase Extraction (SPE) Cartridges (C18, HILIC) | Clean-up and fractionation of complex plant extracts to reduce matrix effects. | Pre-LC-MS sample preparation for alkaloid analysis. |
| Stable Isotope-Labeled Internal Standards (e.g., 13C, 15N) | Absolute quantitation in LC-MS/MS; corrects for matrix-induced ionization suppression/enhancement. | Precise quantification of phytohormones (JA, SA). |
Conclusion
GC-MS and LC-MS are not mutually exclusive but complementary pillars of modern plant metabolomics. GC-MS excels for volatile and thermally stable primary metabolites, offering robust reproducibility and extensive spectral libraries. LC-MS, particularly HRMS, provides unparalleled coverage of semi-polar and non-volatile secondary metabolites, enabling discovery-driven research. The optimal choice hinges on the specific biological question, metabolite classes of interest, and required analytical rigor. Future directions point toward increased automation, integrated multi-platform workflows, and advanced data fusion algorithms to construct comprehensive metabolic networks. For biomedical and clinical research, this empowers more accurate biomarker discovery from medicinal plants, rigorous standardization of herbal products, and accelerated identification of novel bioactive lead compounds for drug development. Ultimately, a strategic, informed selection and application of these technologies are critical for advancing plant-based science from the lab to the clinic.