GC-MS Analysis of Essential Oils: A Comprehensive Guide for Biomedical Research and Drug Development
This article provides researchers, scientists, and drug development professionals with a detailed, current guide to Gas Chromatography-Mass Spectrometry (GC-MS) for essential oil analysis.
GC-MS Analysis of Essential Oils: A Comprehensive Guide for Biomedical Research and Drug Development
Abstract
This article provides researchers, scientists, and drug development professionals with a detailed, current guide to Gas Chromatography-Mass Spectrometry (GC-MS) for essential oil analysis. It covers the foundational principles of separation and identification, best-practice methodologies for sample preparation and data acquisition, advanced troubleshooting for complex matrices, and critical validation strategies for ensuring reproducible, publication-ready results. By integrating theory with practical application, this resource aims to enhance analytical rigor in characterizing essential oils for pharmacological and clinical research.
Decoding the Chemistry: Core Principles of GC-MS for Essential Oil Profiling
Within the framework of a broader thesis on Gas Chromatography-Mass Spectrometry (GC-MS) principles for essential oil analysis research, this whitepaper elucidates the intrinsic synergy between the separation power of Gas Chromatography (GC) and the identification capabilities of Mass Spectrometry (MS). This tandem technique is indispensable for researchers, scientists, and drug development professionals requiring precise compositional analysis of complex volatile mixtures, such as essential oils, where comprehensive characterization of terpenes, sesquiterpenes, and oxygenated derivatives is paramount.
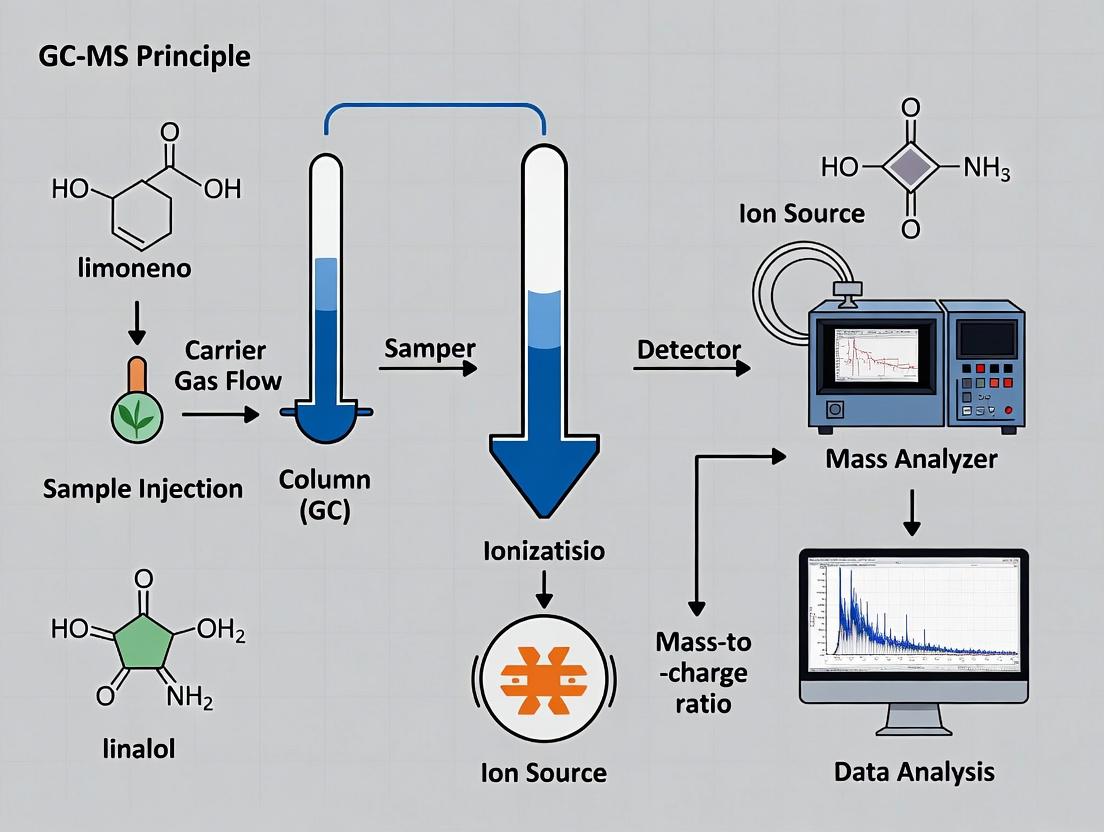
Core Principle: The GC-MS Interface
The GC functions as a high-resolution separation module, partitioning complex vaporized samples into discrete chemical bands based on their differential partitioning between a mobile gas phase and a stationary phase within a capillary column. The MS serves as a selective and sensitive detection module, fragmenting these eluted analytes and measuring their mass-to-charge (m/z) ratios. The critical link is the interface, which efficiently transfers eluates from the atmospheric pressure GC column to the high-vacuum MS ion source, typically a heated transfer line. This seamless transfer is the foundation of the technique's synergy.
Technical Workflow and Methodologies
Standard Experimental Protocol for Essential Oil Analysis
- Sample Preparation: Essential oil sample (e.g., lavender, peppermint) is diluted 1:100 (v/v) in a suitable solvent (e.g., hexane, dichloromethane). An internal standard (e.g., n-Alkane mix for retention index calculation) is added at a known concentration.
- GC Conditions:
- Injector: Split/Splitless, temperature: 250°C, split ratio: 50:1.
- Column: Fused silica capillary column (e.g., 5% phenyl / 95% dimethyl polysiloxane), 30m length, 0.25mm ID, 0.25µm film thickness.
- Oven Program: 50°C (hold 2 min), ramp at 5°C/min to 250°C (hold 5 min). Carrier Gas: Helium, constant flow: 1.0 mL/min.
- MS Conditions:
- Interface Temperature: 280°C.
- Ion Source: Electron Ionization (EI) at 70 eV, temperature: 230°C.
- Quadrupole Mass Analyzer: Temperature: 150°C.
- Scan Mode: Full scan, m/z range: 40-500 amu.
- Spectral Library: NIST Mass Spectral Library.
Data Interpretation Protocol
- Chromatogram Deconvolution: Software algorithms separate co-eluting peaks.
- Spectral Matching: Unknown mass spectra are compared against reference libraries (NIST, Wiley). A match factor >800 (out of 1000) is typically considered a confident tentative identification.
- Retention Index (RI) Calibration: Calculated using a homologous n-alkane series run under identical conditions. Comparing experimental RI with literature RI values provides a second, orthogonal identification parameter.
- Quantification: Using internal standard calibration curves for target compounds or area percent normalization for general profiling.
Quantitative Data in Essential Oil Analysis
The power of GC-MS is demonstrated by its ability to generate comprehensive quantitative profiles. Below are illustrative data tables from a hypothetical analysis of two essential oils.
Table 1: Major Constituents Identified in Lavender (Lavandula angustifolia) Oil
| Compound Name | Chemical Class | Retention Time (min) | Retention Index (Exp.) | % Relative Abundance | Primary Characteristic Ions (m/z) |
|---|---|---|---|---|---|
| Linalool | Monoterpene alcohol | 12.5 | 1095 | 38.2 | 71, 93, 121 |
| Linalyl acetate | Monoterpene ester | 17.8 | 1256 | 32.5 | 93, 121, 136 |
| β-Caryophyllene | Sesquiterpene | 24.3 | 1418 | 5.7 | 91, 133, 189 |
| Terpinen-4-ol | Monoterpene alcohol | 14.1 | 1174 | 3.1 | 71, 111, 136 |
Table 2: Comparative Analysis of Peppermint (Mentha × piperita) and Spearmint (Mentha spicata) Oils
| Parameter | Peppermint Oil | Spearmint Oil |
|---|---|---|
| Primary Ketone | Menthol (35-45%) | Carvone (50-70%) |
| Key Monoterpene | Menthone (15-25%) | Limonene (10-20%) |
| Typical Total Ion Chromatogram (TIC) Peaks | ~35-50 major peaks | ~25-40 major peaks |
| Diagnostic Ion (m/z) | 123 (for p-menthane skeleton) | 150 (for carvone) |
| Method Detection Limit (MDL) for Key Compound | 0.01 µg/mL (Menthol) | 0.01 µg/mL (Carvone) |
Visualizing the GC-MS Workflow and Data Analysis
GC-MS Essential Oil Analysis Workflow
GC-MS Data Interpretation Pathway
The Scientist's Toolkit: Key Research Reagent Solutions
Table 3: Essential Materials for GC-MS Analysis of Essential Oils
| Item / Reagent | Function / Purpose | Example / Specification |
|---|---|---|
| Internal Standard Mix (n-Alkanes) | Calibrates retention times to calculate Retention Indices (RI), enabling compound identification independent of minor run condition shifts. | C8-C30 n-Alkane mixture in hexane. |
| Certified Reference Standards | Provides absolute identification and enables accurate quantification via calibration curves for target analytes. | >98% pure menthol, limonene, linalool, etc. |
| High-Purity Solvents | Used for sample dilution and cleaning. Must be MS-grade to avoid introducing background ions that interfere with analysis. | MS-grade Hexane, Dichloromethane. |
| Derivatization Reagents (e.g., MSTFA) | For analyzing non-volatile or thermally labile components. Increases volatility and stability for GC analysis. | N-Methyl-N-(trimethylsilyl)trifluoroacetamide. |
| Deactivated Liner & Septa | Ensures inert sample pathway, preventing thermal degradation or adsorption of active compounds (e.g., terpene alcohols) in the injector. | Glass wool packed, single taper liner; High-temperature septa. |
| Standard Mass Spectral Libraries | Digital databases of reference spectra for automated and manual spectral matching, crucial for tentative identification. | NIST 2023, Wiley 11th Edition, Essential Oil-specific libraries. |
This whitepaper, framed within a broader thesis on Gas Chromatography-Mass Spectrometry (GC-MS) principles for essential oil analysis research, details the intrinsic compatibility of volatile terpenoids and phenylpropanoids with GC-MS methodology. Their physicochemical properties align perfectly with the operational parameters of GC-MS, making them the archetypal analytes for this powerful hyphenated technique in phytochemical and pharmaceutical research.
Core Chemical Properties and GC-MS Suitability
The ideal volatility, thermal stability, and molecular mass range of these compound classes are summarized in the table below.
Table 1: Physicochemical Properties of Essential Oil Compound Classes Aligned with GC-MS
| Property | Monoterpenoids | Sesquiterpenoids | Phenylpropanoids | GC-MS Suitability Rationale |
|---|---|---|---|---|
| Molecular Weight Range | 136-204 g/mol | 204-300 g/mol | 148-294 g/mol | Optimal for EI ionization and quadrupole mass range. |
| Vapor Pressure (at 25°C) | High (e.g., Limonene: ~1.7 kPa) | Moderate (e.g., β-Caryophyllene: ~0.02 kPa) | Low-Moderate (e.g., Eugenol: ~0.01 kPa) | Ensures efficient vaporization in GC inlet without decomposition. |
| Boiling Point Range | 150-200°C | 230-280°C | 230-265°C | Fits standard GC oven temperature gradients (50-300°C). |
| Thermal Stability | Generally High | High | Moderate to High (some prone to oxidation) | Withstand GC column temperatures without degradation. |
| Polarity | Non-polar (Hydrocarbons) to Moderate (Oxygenated) | Non-polar to Moderate | Moderate (due to phenol/ether groups) | Compatible with standard non-polar/mid-polar stationary phases (e.g., 5% Phenyl polysiloxane). |
Experimental Protocols for GC-MS Analysis of Essential Oils
Protocol 1: Sample Preparation and Injection
- Dilution: Accurately weigh ~10 mg of essential oil into a 10 mL volumetric flask. Dilute to mark with high-purity GC-MS grade hexane or dichloromethane, achieving a concentration of ~1 mg/mL.
- Filtration: Pass the solution through a 0.22 μm PTFE syringe filter into a 2 mL GC vial with a polymer screw cap and PTFE/silicone septum.
- Injection (Split/Spitless): Use a programmed temperature vaporization (PTV) or standard split/splitless inlet. For comprehensive analysis, a split ratio of 1:10 to 1:50 is common. For trace components, use splitless mode (30-60 s purge-off time). Injection volume is typically 1 μL.
Protocol 2: Standard GC-MS Operational Parameters
- Gas Chromatograph: Equipped with an autosampler.
- Column: Fused silica capillary column (30 m length x 0.25 mm ID x 0.25 μm film thickness) coated with 5% phenyl / 95% dimethyl polysiloxane stationary phase (e.g., DB-5MS, HP-5MS).
- Carrier Gas: Helium (purity 99.999%), constant linear velocity of 1.0 mL/min.
- Oven Program: Initial 50°C (hold 2 min), ramp at 4°C/min to 280°C (hold 10 min). Total run: 70.5 min.
- Inlet Temperature: 250°C.
- Mass Spectrometer: Operated in Electron Ionization (EI) mode at 70 eV.
- Ion Source Temperature: 230°C.
- Quadrupole Temperature: 150°C.
- Scan Range: m/z 40-400 amu at a scan rate of ~5 scans/second.
- Solvent Delay: Set to 3 minutes to protect the detector filament.
Protocol 3: Data Analysis and Compound Identification
- Deconvolution: Use instrument software (e.g., AMDIS) to deconvolute overlapping chromatographic peaks.
- Library Search: Compare the deconvoluted mass spectrum of each peak against commercial (NIST, Wiley) and specialized essential oil mass spectral libraries. A match factor >850 (out of 1000) is typically considered a good preliminary identification.
- Retention Index (RI) Confirmation: Co-inject a homologous series of n-alkanes (C8-C40) under identical conditions to calculate the Linear Retention Index (LRI) for each peak. Compare experimental LRI values with published RI databases (e.g., NIST, FFNSC) for the same stationary phase. A compound is positively identified when both mass spectrum and RI match literature values.
The Scientist's Toolkit: Key Research Reagent Solutions
Table 2: Essential Materials for GC-MS Analysis of Essential Oils
| Item | Function | Specification/Example |
|---|---|---|
| GC-MS Grade Solvents | Sample dilution and mobile phase; minimal impurities prevent background noise. | Hexane, Dichloromethane, Methanol. |
| n-Alkane Standard Mix | Calculation of Linear Retention Indices (LRI) for compound identification. | C8-C40 straight-chain alkanes in hexane. |
| Internal Standards | Quantification and correction for injection variability. | Deuterated compounds (e.g., Naphthalene-d8) or non-native terpenes (e.g., Cedrene). |
| Capillary GC Columns | Stationary phase for compound separation based on boiling point/polarity. | 5%-Phenyl polysiloxane (e.g., DB-5MS), Polyethylene Glycol (WAX). |
| Reference Standards | Definitive identification and calibration for quantitative analysis. | Certified pure compounds (e.g., (-)-α-Pinene, Eugenol, Linalool). |
| Syringe Filters | Removal of particulate matter to protect the GC column and inlet. | 0.22 μm pore size, PTFE membrane, solvent compatible. |
| Deactivated Inlet Liners | Provide a clean, inert vaporization chamber; crucial for active compounds. | Single taper, wool-packed (for splitless) or unpacked (for split). |
Visualizing the Analytical Workflow and Compound Biosynthesis
GC-MS Essential Oil Analysis Workflow
Biosynthetic Pathways to Target Volatiles
Within the context of Gas Chromatography-Mass Spectrometry (GC-MS) analysis of essential oils, understanding the function and optimization of four core instrument components is critical for achieving high-resolution separation, sensitive detection, and accurate compound identification. This whitepaper provides an in-depth technical guide to the inlet, column, ion source, and mass analyzer, framed within the rigorous demands of phytochemical research and drug development from natural products.
The inlet serves as the interface between the sample introduction system and the chromatographic column. Its primary function is to vaporize the liquid sample instantaneously and transfer it as a narrow band onto the column.
Key Modes & Experimental Protocol for Essential Oils:
- Split Mode: Used for concentrated samples (>0.1% component). A defined split ratio (e.g., 50:1) diverts most of the sample to waste, preventing column overload.
- Protocol: Inject 1 µL of a 1% (v/v) essential oil dilution in hexane with a split ratio of 50:1. Inlet temperature: 250°C.
- Splitless Mode: Used for trace analysis. The entire sample enters the column for a set period (purge-off time, typically 0.5-2 min), maximizing sensitivity.
- Protocol: For analyzing minor constituents, inject 1 µL of a 0.01% dilution in splitless mode with a 1.0 min purge-off time. Inlet: 250°C.
- On-Column Injection: Directly deposits liquid sample onto the column, ideal for thermally labile compounds.
Quantitative Data: Inlet Parameters for Essential Oil Analysis
| Parameter | Typical Range | Optimal Value for Common Oils | Function & Impact |
|---|---|---|---|
| Temperature | 200-300°C | 250°C | Ensures complete, instantaneous vaporization. |
| Split Ratio | 10:1 to 200:1 | 50:1 | Controls amount of sample entering column; prevents overload. |
| Purge Flow Rate | 0-50 mL/min | 20 mL/min (splitless) | Removes residual solvent vapor after purge-off time. |
| Purge-off Time | 0.5 - 2.0 min | 1.0 min | Time split vent is closed in splitless mode. |
The Column: Chromatographic Separation
The column is the heart of the GC, where the complex essential oil mixture is separated into its individual components based on differential partitioning between the mobile gas phase and the stationary phase.
Key Parameters & Experimental Protocol:
- Stationary Phase: Mid-polarity columns (e.g., 5% phenyl / 95% dimethyl polysiloxane) offer the best universal separation for terpenes and oxygenated terpenoids.
- Dimensions: Length, Internal Diameter (ID), and film thickness dictate efficiency, capacity, and resolution.
- Temperature Programming: Critical for separating a wide boiling point range. A common gradient for essential oils: 50°C (hold 2 min), ramp at 5°C/min to 250°C (hold 5 min).
Quantitative Data: Column Selection Criteria
| Parameter | Common Options for EO Analysis | Impact on Separation |
|---|---|---|
| Length | 30 m or 60 m | Longer = higher resolution, longer run time. |
| Internal Diameter (ID) | 0.25 mm or 0.32 mm | Narrower ID = higher efficiency, lower capacity. |
| Film Thickness | 0.25 µm or 1.0 µm | Thicker film = higher capacity for volatiles, longer retention. |
| Stationary Phase | 5%-phenyl methylpolysiloxane, Wax (PEG) | Polarity must match analyte polarity for optimal selectivity. |
The Ion Source: Generation of Gas-Phase Ions
The ion source converts neutral molecules eluting from the GC column into gas-phase ions. Electron Ionization (EI) is the standard for essential oil analysis.
Electron Ionization (EI) Protocol:
- Molecules enter the source under vacuum (~10⁻⁵ Torr).
- They are bombarded by a beam of high-energy electrons (typically 70 eV).
- An electron is dislodged, forming a radical cation (M⁺•).
- The excess energy causes reproducible fragmentation, generating a characteristic "fingerprint" spectrum.
Quantitative Data: Ion Source Parameters
| Parameter | Standard Setting (EI) | Effect of Variation |
|---|---|---|
| Electron Energy | 70 eV | Standard spectral libraries use 70 eV; lower energy reduces fragmentation. |
| Source Temperature | 230-280°C | Prevents condensation; higher temps can induce thermal decomposition. |
| Emission Current | 50-350 µA | Impacts sensitivity and long-term stability. |
| Electron Multiplier Voltage | 1200-1800 V (varies) | Higher voltage increases signal gain (detector sensitivity). |
The Mass Analyzer: Separation and Detection of Ions
The mass analyzer separates ions based on their mass-to-charge ratio (m/z). Quadrupole analyzers are most prevalent in routine GC-MS for essential oils.
Quadrupole Operation Protocol:
- Ions are accelerated into a space defined by four parallel rods.
- Applying DC and RF voltages to the rods creates a dynamic electric field.
- Only ions of a specific m/z have a stable trajectory through the rods to the detector at a given moment.
- The voltages are rapidly scanned across a range (e.g., 40-500 m/z) to detect all ions.
Quantitative Data: Common Mass Analyzer Types
| Analyzer Type | Key Principle | Resolving Power | Best For (EO Context) |
|---|---|---|---|
| Quadrupole | Mass filtering by stable trajectories in oscillating fields | Unit (1,000) | Routine quantification, targeted analysis, library matching. |
| Time-of-Flight (TOF) | Measurement of ion flight time over a fixed distance | High (5,000-20,000) | Deconvolution of co-eluting peaks, exact mass for formula. |
| Quadrupole-Time-of-Flight (Q-TOF) | Quadrupole precursor selection + TOF analysis | Very High (>20,000) | Structural elucidation of unknowns via MS/MS fragmentation. |
Visualizing the GC-MS Workflow for Essential Oil Analysis
Title: GC-MS Essential Oil Analysis Workflow
The Scientist's Toolkit: Key Reagents & Materials for GC-MS of Essential Oils
| Item | Function & Application |
|---|---|
| High-Purity Solvents (Hexane, Dichloromethane) | Dilution of concentrated oils to prevent column/Detector overload; extraction solvent. |
| Alkanes (C7-C30) | Used in Kovats Retention Index calculation to normalize compound retention times across systems. |
| Internal Standards (e.g., Alkyl Benzenes, Deuterated Compounds) | Added in known quantity for semi-quantitative analysis to correct for injection variability. |
| Silylation Reagents (e.g., MSTFA, BSTFA) | Derivatization of polar functional groups (e.g., in terpene alcohols) to improve volatility and peak shape. |
| Stationary Phase Capillary Columns (5%-Phenyl Polysiloxane, PEG) | The core separation medium; choice dictates selectivity and resolving power for terpenoids. |
| Calibration Gas (PFTBA) | Perfluorotributylamine; standard for mass axis calibration and tuning instrument performance. |
| Inlet Liners (Deactivated Glass) | Houses the vaporized sample; must be clean and deactivated to prevent catalytic decomposition. |
| Septum (High-Temp, Low-Bleed) | Seals the inlet; prevents leaks and must not introduce interfering background compounds. |
Within the broader context of research utilizing Gas Chromatography-Mass Spectrometry (GC-MS) for essential oil analysis, interpreting the resulting mass spectra is paramount. This in-depth guide focuses on the core principles of fragmentation patterns, which serve as molecular fingerprints, enabling the identification and structural elucidation of volatile compounds like monoterpenes, sesquiterpenes, and oxygenated derivatives present in complex essential oil matrices.
Fundamentals of Electron Ionization and Fragmentation
In standard GC-MS using Electron Ionization (EI, 70 eV), a molecule (M) is bombarded with high-energy electrons, resulting in the ejection of an electron and the formation of a radical cation molecular ion (M⁺•). This excited species rapidly undergoes fragmentation via cleavage of chemical bonds, governed by principles of radical and charge site stability, to produce characteristic ions.
Key Fragmentation Rules for Terpenoids
- Alpha-Cleavage (α-cleavage): Favored adjacent to heteroatoms (e.g., oxygen in alcohols, ketones) or branched carbon atoms, driven by radical site stabilization.
- McLafferty Rearrangement: A specific, multi-step fragmentation involving a γ-hydrogen transfer via a six-membered transition state, common in carbonyl-containing compounds like ketones and aldehydes.
- Retro-Diels-Alder (RDA): A concerted fragmentation critical in the identification of cyclohexene ring systems, ubiquitous in many sesquiterpenes.
- Loss of Neutral Small Molecules: Common losses include H₂O (alcohols), CH₃• (methyl groups), CO (aldehydes, ketones), and CH₃COOH (acetates).
The following tables summarize key quantitative fragmentation data for representative compound classes in essential oils.
Table 1: Characteristic Fragment Ions and Neutral Losses for Major Terpene Classes
| Compound Class (Example) | Molecular Ion (m/z) | Base Peak / Key Fragment Ions (m/z) | Diagnostic Neutral Losses | Common Essential Oil Constituents |
|---|---|---|---|---|
| Monoterpene Hydrocarbons (Limonene) | 136 | 93, 121, 136 | 15 (CH₃), 43 (C₃H₇) | Limonene, Pinene, Myrcene |
| Oxygenated Monoterpenes (Menthol) | 156 | 71, 81, 95, 123 | 18 (H₂O), 31 (CH₃O) | Menthol, Linalool, Terpinen-4-ol |
| Sesquiterpene Hydrocarbons (β-Caryophyllene) | 204 | 41, 69, 93, 133, 161 | 15 (CH₃), 43 (C₃H₇) | β-Caryophyllene, α-Humulene |
| Aldehydes (Citral) | 152 | 41, 69, 84, 109 | 29 (CHO), 44 (CO₂ from oxid.) | Citral (Geranial/Neral), Cinnamaldehyde |
| Ketones (Carvone) | 150 | 82, 108, 150 | 18 (H₂O), 42 (CH₂CO) | Carvone, Menthone, Fenchone |
Table 2: Library Match Statistical Reliability Indicators
| Spectral Match Factor | Range | Interpretation for Confident ID (>80% Purity) |
|---|---|---|
| Reverse Match Factor (RMF) | 0 - 1000 | Values > 900 indicate high probability of correct identification. |
| Probability / Match Quality (%) | 0 - 100% | >90% is excellent, 80-90% good, <80% requires verification. |
| Peak Purity Index | 0 - 1 | Values closer to 1 indicate a pure, co-elution-free spectrum. |
Experimental Protocol: GC-MS Analysis for Essential Oil Fingerprinting
Methodology: Sample Preparation and Instrumental Analysis
1. Sample Preparation:
- Dilution: Dilute 10 - 50 µL of essential oil in 1 mL of a suitable GC-MS grade solvent (e.g., hexane, dichloromethane, methanol) to achieve a concentration of ~1% (v/v). Filter through a 0.22 µm PTFE syringe filter to remove particulates.
2. GC-MS Instrumental Conditions (Typical Protocol):
- Gas Chromatograph: Equipped with a non-polar to mid-polar capillary column (e.g., DB-5MS, 30m x 0.25mm ID x 0.25µm film thickness).
- Injection: Split mode (split ratio 10:1 to 50:1), 1 µL injection volume. Injector temperature: 250°C.
- Oven Program: 50°C (hold 2 min), ramp at 5°C/min to 280°C (hold 5-10 min). Total run time ~55 min.
- Carrier Gas: Helium, constant flow of 1.0 mL/min.
- Mass Spectrometer: EI source at 70 eV. Ion source temperature: 230°C. Quadrupole analyzer temperature: 150°C.
- Scan Range: m/z 40 - 500 (or up to m/z 600 for sesquiterpenoids). Solvent delay: ~2-3 minutes.
3. Data Analysis Workflow:
- Deconvolution: Use software (e.g., AMDIS, ChromaTOF) to separate co-eluting peaks.
- Library Search: Compare deconvoluted spectra against commercial (NIST, Wiley) and specialized terpene libraries.
- Quantification: Use peak area normalization (assuming 100% total) or internal standard calibration with compounds like nonane or cymene.
The Scientist's Toolkit: Essential Research Reagents & Materials
| Item | Function in GC-MS Essential Oil Analysis |
|---|---|
| GC-MS Grade Solvents (Hexane, Dichloromethane) | High-purity solvent for sample dilution, minimizing background chemical noise. |
| Alkanes Standard Mix (C8-C40) | Used for determination of Kovats Retention Indices (RI), a critical confirmatory parameter. |
| Internal Standards (e.g., n-Alkanes, Alkyl Benzenes) | Added to sample for semi-quantitative analysis, correcting for injection volume variability. |
| Silylation Reagents (e.g., MSTFA, BSTFA) | Derivatize polar compounds (e.g., phenols, acids) to improve volatility and chromatographic behavior. |
| Solid Phase Microextraction (SPME) Fibers | For headspace sampling, enabling analysis of volatile components without solvent. |
| Retention Index Calibration Software | Calculates RI values from alkane standard runs for comparison with literature databases. |
| Specialized Terpene Mass Spectral Libraries | Commercial or in-house libraries focused on natural products for improved matching accuracy. |
Visualization of Core Concepts
GC-MS Analysis Workflow for Essential Oils
EI Fragmentation Pathways to a Mass Spectrum
Spectrum Interpretation Logic Flow
Navigating Spectral Libraries (NIST, Wiley) and Retention Index Databases for Compound ID
Within the framework of GC-MS research for essential oil analysis, the definitive identification of compounds is a critical step, extending far beyond a simple spectral match. This whitepaper provides an in-depth technical guide to navigating commercial spectral libraries and leveraging retention index (RI) databases to achieve confident, high-fidelity compound identification.
The Dual Pillars of Confident Compound ID
In essential oil analysis, where complex matrices of isomers and terpenes are common, reliance solely on mass spectral similarity is insufficient. Confidence is built on two pillars:
- Mass Spectral Match: Comparison of the unknown spectrum against a reference library, resulting in a similarity score (e.g., Match Factor, Reverse Match).
- Retention Index Agreement: Comparison of the experimentally derived Kovats Retention Index of the unknown against a curated database of reference RIs, measured on a standardized stationary phase.
Core Spectral Libraries & RI Databases: Structure and Comparison
Table 1: Primary Commercial Spectral Libraries for GC-MS
| Library Name | Approx. Spectra | Key Features | Best For |
|---|---|---|---|
| NIST Mass Spectral Library | ~300,000 | Includes electron ionization (EI) spectra, RI data for many compounds, and search algorithms (PBM, Probability-Based Matching). | General unknown ID, method development, high-confidence matching with RI filtering. |
| Wiley Registry of Mass Spectral Data | ~700,000 | Extensive collection of EI spectra, including many natural products and novel compounds. | Screening for rare or unusual compounds, when NIST search yields low-confidence results. |
Table 2: Key Retention Index Databases for Essential Oils
| Database Name | RI Entries | Stationary Phase | Key Features & Source |
|---|---|---|---|
| NIST RI Database | Integrated with NIST Library | Primarily non-polar (e.g., HP-5 equivalent) | Compiled from literature & NIST data; allows RI filtering during search. |
| Adams Essential Oils Library | ~2,000 compounds | Non-polar (5% phenyl polysiloxane) | Curated by Dr. Robert P. Adams; considered a gold standard for terpenes & phenylpropanoids. |
| FFNSC (Flavor & Fragrance Natural & Synthetic Compounds) | ~3,300 compounds | Both polar (Wax) and non-polar | Comprehensive for flavor/fragrance analysis; includes MS and RI data. |
Experimental Protocol: Integrated GC-MS Compound ID with RI Confirmation
Objective: To unequivocally identify a compound in a peppermint (Mentha × piperita) essential oil sample.
Materials & Reagents: See The Scientist's Toolkit below.
Methodology:
Sample Preparation: Dilute 10 µL of peppermint oil in 1 mL of chromatography-grade hexane (1:100 v/v). Filter through a 0.22 µm PTFE syringe filter.
n-Alkane Standard Solution Preparation: Prepare a homologous series of C8-C20 (or C30, depending on expected elution range) n-alkanes in hexane at ~10 ng/µL each.
GC-MS Instrument Parameters:
- Column: Equity-5 or equivalent (5% phenyl, 95% dimethyl polysiloxane), 30m x 0.25mm ID, 0.25µm film thickness.
- Oven Program: 50°C (hold 2 min), ramp at 3°C/min to 240°C (hold 5 min).
- Injector: 250°C, split mode (split ratio 50:1).
- Carrier Gas: Helium, constant flow at 1.0 mL/min.
- MS Transfer Line: 280°C.
- MS Source: 230°C.
- Electron Energy: 70 eV.
- Mass Scan Range: 40-400 m/z.
Data Acquisition:
- Run the n-alkane standard mixture. Record retention times (RT).
- Run the prepared peppermint oil sample under identical conditions.
Data Processing & Compound ID Workflow:
Diagram Title: Workflow for Confident GC-MS Compound Identification
Key Calculations:
- Kovats Retention Index Calculation: For an unknown compound eluting between adjacent n-alkanes with z and z+1 carbon atoms:
RI = 100 * [ (log(RT_unknown) - log(RT_z)) / (log(RT_(z+1)) - log(RT_z)) ] + 100*zWhere RT is the retention time.
- Interpretation: A candidate from the spectral library search (e.g., menthol) is confirmed only if its experimental RI matches the reference RI from a trusted database (e.g., Adams) within an acceptable tolerance (±5-10 index units on a non-polar column).
The Scientist's Toolkit: Essential Research Reagents & Materials
| Item | Function & Specification |
|---|---|
| n-Alkane Standard Mix (C8-C20/30) | Used to calculate experimental Kovats Retention Indices. Must be chromatographically pure. |
| Chromatography-Grade Solvents (Hexane, Dichloromethane) | For sample dilution and preparation. Low UV absorbance and MS background. |
| Reference Essential Oils | Certified authentic oils from reputable suppliers (e.g., Sigma-Aldrich, plant nurseries) for method validation. |
| GC-MS Capillary Column | Non-polar (5% phenyl polysiloxane, e.g., HP-5MS) for RI matching to standard databases. Polar column (polyethylene glycol) for orthogonal separation. |
| PTFE Syringe Filters (0.22 µm) | For particulate removal from samples prior to injection, protecting the GC column and liner. |
| Deactivated Glass Inserts & Liners | Ensure inert sample vaporization, preventing thermal degradation of labile terpenes. |
| Commercial & Curated RI Databases (Adams, FFNSC) | Reference standards for retention behavior. More reliable than in-house generated RI lists alone. |
From Sample to Spectrum: A Step-by-Step GC-MS Protocol for Essential Oils
In Gas Chromatography-Mass Spectrometry (GC-MS) analysis of essential oils, sample preparation is the critical determinant of analytical success. This technical guide details the three core techniques—dilution, derivatization, and Solid-Phase Microextraction (SPME)—framed within a thesis on leveraging GC-MS principles for high-fidelity essential oil research. Optimal preparation mitigates matrix effects, enhances volatility and thermal stability of target analytes, and ensures reproducible, sensitive detection crucial for drug development and phytochemical profiling.
Dilution: The Foundation of Quantitative Analysis
Proper dilution prevents column overload, reduces matrix interference, and brings analyte concentrations within the instrument's linear dynamic range.
Experimental Protocol: Serial Dilution for Calibration
- Stock Solution: Accurately weigh 10 mg of pure essential oil or target analyte (e.g., linalool, eugenol). Dissolve in 10 mL of suitable solvent (e.g., hexane, methanol) to yield a 1000 µg/mL stock.
- Serial Dilution: Perform a series of 1:10 dilutions. Transfer 1 mL of stock to a 10 mL volumetric flask and dilute to mark with solvent (100 µg/mL). Repeat to prepare standards of 10, 1, 0.1, and 0.01 µg/mL.
- GC-MS Analysis: Inject 1 µL of each standard in split mode (split ratio 10:1 to 50:1). Plot peak area vs. concentration to construct a calibration curve.
Table 1: Common Solvents for Essential Oil Dilution
| Solvent | Polarity Index | Boiling Point (°C) | Best For | Caveat |
|---|---|---|---|---|
| Hexane | 0.1 | 69 | Non-polar terpenes (limonene, pinene) | Low elution power for oxygenates. |
| Dichloromethane | 3.1 | 40 | Broad-range, volatile compounds | Toxic, requires careful handling. |
| Ethyl Acetate | 4.4 | 77 | Mid-polarity compounds (esters, aldehydes) | Can react with active compounds. |
| Methanol | 5.1 | 65 | Polar oxygenated compounds (alcohols, acids) | High boiling point may cause ghost peaks. |
Derivatization: Enhancing Detectability
Derivatization modifies functional groups (e.g., -OH, -COOH) to improve volatility, thermal stability, and chromatographic behavior.
Experimental Protocol: Silylation of Phenolic Compounds
- Reagent: N-Methyl-N-(trimethylsilyl)trifluoroacetamide (MSTFA) with 1% trimethylchlorosilane (TMCS).
- Procedure: To 100 µL of a dried essential oil extract containing phenolics (e.g., thymol, carvacrol), add 100 µL of pyridine and 100 µL of MSTFA. Vortex for 30 seconds. Heat at 60°C for 30 minutes. Cool to room temperature and directly inject 1 µL into the GC-MS.
- Outcome: Replaces active hydrogen with a trimethylsilyl group, converting polar phenols into volatile TMS ethers.
Table 2: Common Derivatization Reagents for GC-MS
| Reagent Type | Target Functional Group | Product | Typical Conditions |
|---|---|---|---|
| MSTFA | -OH, -COOH, -NH | Trimethylsilyl (TMS) ether/ester | 60-70°C, 15-30 min |
| BSTFA | -OH, -COOH, -NH | Trimethylsilyl (TMS) ether/ester | 60-70°C, 15-30 min |
| Methyl-8 (TMSDMT) | -COOH, acidic -OH | Methyl esters/TMS ethers | Room temp, 30 min |
Solid-Phase Microextraction (SPME): Solventless Extraction & Enrichment
SPME integrates sampling, extraction, concentration, and injection. A coated fiber absorbs/adsorbs analytes from headspace (HS-SPME) or direct immersion (DI-SPME), ideal for volatile profiling.
Experimental Protocol: HS-SPME for Volatile Profiling
- Fiber Conditioning: Condition a DVB/CAR/PDMS (Divinylbenzene/Carboxen/Polydimethylsiloxane) 50/30 µm fiber in the GC injector port at 270°C for 30 min as per manufacturer instructions.
- Sample Equilibration: Place 1 mL of undiluted essential oil or 100 mg of plant material in a 20 mL headspace vial. Seal with a PTFE/silicone septum. Equilibrate at 60°C in a heating block for 10 min with agitation.
- Extraction: Expose and insert the conditioned fiber into the vial headspace. Extract for 30 min at 60°C.
- Desorption: Retract the fiber and immediately insert it into the GC-MS injector port (250°C) for 5 min in splitless mode for thermal desorption.
Table 3: SPME Fiber Selection Guide for Essential Oils
| Fiber Coating | Thickness | Polarity | Target Compounds in Essential Oils |
|---|---|---|---|
| PDMS | 100 µm | Non-polar | Hydrocarbons (terpenes), non-polar volatiles. |
| PDMS/DVB | 65 µm | Bipolar | Alcohols, ketones, esters. General purpose. |
| CAR/PDMS | 75 µm | Bipolar | Very small, volatile molecules (C3-C8). |
| DVB/CAR/PDMS | 50/30 µm | Bipolar | Broadest range: C3-C20 volatiles. Optimal for complex mixtures. |
The Scientist's Toolkit: Key Reagent Solutions
| Item | Function & Rationale |
|---|---|
| DVB/CAR/PDMS SPME Fiber | Triphasic coating for exhaustive extraction of a wide molecular weight range of volatiles (C3-C20). |
| MSTFA with 1% TMCS | Silylation reagent; TMCS acts as a catalyst for complete derivatization of sterically hindered groups. |
| Chromatographic Solvents (HPLC Grade) | High-purity solvents minimize interfering background signals during GC-MS analysis. |
| Alkane Standard Solution (C7-C30) | Used for determination of linear retention indices (LRI) for accurate compound identification. |
| Deactivated Glass Wool & Liner | Provides an inert surface in the GC inlet, preventing thermal degradation of labile compounds. |
| Internal Standard (e.g., Nonane, Chlorobenzene-d5) | Added at known concentration to correct for injection volume variability and extraction inefficiencies. |
Integrated Workflow & Decision Pathway
Decision Workflow for Essential Oil Prep
The synergistic application of dilution, derivatization, and SPME forms the cornerstone of robust sample preparation for GC-MS analysis of essential oils. Selection depends on sample nature, target analyte physicochemical properties, and required sensitivity. Dilution ensures quantitative accuracy, derivatization extends the analytical scope to polar compounds, and SPME offers a powerful, green approach for volatile profiling. Mastery of these techniques, as framed within rigorous GC-MS principles, is indispensable for generating reliable data in pharmaceutical and botanical research.
Within the broader context of research on Gas Chromatography-Mass Spectrometry (GC-MS) principles for essential oil analysis, the selection of an appropriate gas chromatographic column is paramount. The complex nature of terpene and terpenoid mixtures—characterized by a wide range of volatilities, polarities, and structural isomers—demands a systematic approach to column choice. This technical guide provides an in-depth analysis of the three critical column parameters—stationary phase, length, and internal diameter—and their impact on resolution, analysis time, and detection limits for terpenes.
Stationary Phase Chemistry
The stationary phase is the primary determinant of selectivity, governing the interaction with analyte molecules based on polarity and structure.
Key Stationary Phases for Terpene Analysis
| Stationary Phase | Common Brand Names | Polarity | Key Terpene Applications | Temperature Limits (°C) |
|---|---|---|---|---|
| 5% Phenyl / 95% Dimethylpolysiloxane | DB-5, HP-5, Rxi-5Sil MS | Non-Polar | General terpene profiling, hydrocarbons (limonene, pinene) | -60 to 325/350 |
| 35% Phenyl / 65% Dimethylpolysiloxane | DB-35, HP-35ms | Mid-Polarity | Oxygenated terpenes (linalool, menthol), complex mixtures | -40 to 340/360 |
| Polyethylene Glycol (PEG) | DB-WAX, HP-INNOWax | Polar | Separation of polar oxygenates (alcohols, esters, aldehydes) | 20 to 250/260 |
| 50% Phenyl / 50% Dimethylpolysiloxane | DB-17, HP-50+ | Intermediate | Isomer separation (e.g., α- vs. β-thujone) | -40 to 280/300 |
Experimental Protocol: Column Selectivity Screening
- Objective: To determine the optimal stationary phase for separating a target terpene mixture.
- Procedure:
- Prepare a standardized test mixture containing hydrocarbon monoterpenes (α-pinene, limonene), oxygenated monoterpenes (linalool, 1,8-cineole), and sesquiterpenes (caryophyllene).
- Analyze the mixture on 3-4 different column chemistries (e.g., 5% phenyl, 35% phenyl, and WAX) of similar dimensions (30m x 0.25mm ID, 0.25µm film thickness).
- Use identical, optimized temperature programs and instrument conditions (injector, detector, carrier gas flow).
- Measure the resolution (Rs) between critical isomer pairs and the peak symmetry of oxygenated compounds.
- Data Interpretation: The phase yielding baseline resolution (Rs > 1.5) for the most critical pair and symmetric peaks for polar terpenes is selected for further optimization.
Column Length and Internal Diameter
These dimensions directly impact efficiency, carrier gas flow, analysis time, and loading capacity.
Performance Characteristics by Column Dimensions
| Column Dimension (L x ID) | Theoretical Plates (N) | Carrier Gas Flow (He, psi) | Relative Analysis Time | Key Application in Terpene Analysis |
|---|---|---|---|---|
| 30m x 0.25mm | ~150,000 | 10-15 (constant flow) | Standard | High-resolution profiling of complex oils (e.g., citrus, cannabis) |
| 60m x 0.25mm | ~300,000 | 20-30 | Long | Separation of challenging sesquiterpene isomers or complex matrices |
| 30m x 0.32mm | ~100,000 | 5-10 | Standard | Higher sample capacity for quantitating major/minor components |
| 15m x 0.25mm | ~75,000 | 8-12 | Fast | Rapid screening of major terpenes or quality control |
Experimental Protocol: Optimizing for Speed vs. Resolution
- Objective: To evaluate the trade-off between analysis time and resolution using different column lengths.
- Procedure:
- Select two columns with the same stationary phase and ID but different lengths (e.g., 30m and 60m).
- Analyze a test mixture containing two co-eluting terpenes (e.g., α-pinene and camphene).
- Adjust the temperature program ramp rate proportionally to the length (e.g., a 60m column may use a slower ramp) to achieve optimal efficiency.
- Calculate the resolution (Rs) between the critical pair and record the total run time for each column.
- Data Interpretation: The 60m column will provide higher resolution (Rs) but require a significantly longer analysis time. The choice depends on the required separation power versus throughput needs.
Integrated Method Development Workflow
The selection process must be systematic and consider the research goals.
GC Method Development Workflow for Terpenes
The Scientist's Toolkit: Key Research Reagent Solutions
| Item | Function/Description |
|---|---|
| C7-C40 Saturated Alkane Standard | Used for calculating Kovats Retention Indices (RI) for terpene identification, independent of column dimensions. |
| Terpene Standard Mixture (e.g., USP) | Certified reference material for method development, calibration, and identification based on retention time. |
| Deactivated Liner with Wool | Glass insert for the GC injector; wool promotes homogeneous vaporization of complex, non-volatile samples like essential oils. |
| High-Purity Helium Carrier Gas (≥99.999%) | Mobile phase; high purity minimizes baseline noise and detector damage, especially for MS detection. |
| Split/Splitless Inlet Seals | Regular maintenance ensures leak-free operation and reproducible sample introduction. |
| Methyl Siloxane Conditioning Solution | Used for conditioning new columns and removing contaminants from installed columns. |
| Retention Gap/Guard Column | Short (1-5m) segment of deactivated tubing installed before the analytical column to trap non-volatile residues. |
In GC-MS research for essential oil analysis, column selection is a foundational step that dictates the success of the separation. A non-polar or low-polarity phase (5-35% phenyl) is often optimal for general terpene profiling, while polar phases target specific oxygenated compounds. A 30m x 0.25mm column serves as an excellent starting point, with length adjusted for difficult separations and ID modified for capacity or speed. A systematic, experimentally-driven approach—guided by the defined analytical thesis and utilizing standard test mixtures—ensures the development of a robust, reproducible GC method capable of resolving the intricate chemical signatures of terpenes.
Optimizing Temperature Gradients and Carrier Gas Flow for Peak Resolution
This technical guide is framed within the broader research thesis: "Advancing the Precision of Chemotype Identification in Complex Essential Oil Matrices via Systematic Optimization of GC-MS Instrumental Parameters." The unparalleled complexity of essential oils, often containing hundreds of monoterpenes, sesquiterpenes, and oxygenated derivatives, presents a significant analytical challenge. The primary bottleneck is the co-elution of structurally similar compounds, leading to misidentification and inaccurate quantification. This whitepaper details the synergistic optimization of the two most critical parameters in capillary Gas Chromatography (GC)—the temperature gradient and the carrier gas linear velocity—to maximize peak resolution (R) and, by extension, the accuracy of subsequent Mass Spectrometry (MS) analysis.
Fundamental Principles and Optimization Targets
Peak Resolution (R) is governed by the fundamental equation: [ R = \frac{\sqrt{N}}{4} \cdot \frac{\alpha - 1}{\alpha} \cdot \frac{k}{k + 1} ] Where:
- N = Column efficiency (theoretical plates), optimized by carrier gas flow.
- α = Relative volatility (selectivity), primarily influenced by stationary phase chemistry.
- k = Retention factor (capacity), predominantly controlled by the temperature program.
The temperature gradient and carrier gas flow are interdependent levers for optimizing N and k. A well-optimized method balances analysis time with the required resolution for critical peak pairs.
Optimizing the Carrier Gas Flow (Helium, Hydrogen, or Nitrogen)
The carrier gas linear velocity (u) directly impacts column efficiency (N), as described by the Van Deemter equation. The optimal linear velocity (u_opt) minimizes the height equivalent to a theoretical plate (HETP).
Experimental Protocol for Determining u_opt:
- Instrument: Standard GC-MS with a 30m x 0.25mm x 0.25µm 5% phenyl-polysiloxane column.
- Method: Set a constant, moderate oven temperature (e.g., 60°C for essential oils). Disable the temperature gradient.
- Procedure: Inject a test mixture containing early-, mid-, and late-eluting terpenes (e.g., α-pinene, limonene, caryophyllene) at a series of constant carrier gas flow rates. Convert measured flow to linear velocity using the column dimensions.
- Data Analysis: For each peak in the test mix, calculate the theoretical plate count (N). Plot HETP (H = L/N, where L is column length) versus linear velocity (u) for a key mid-eluting compound (e.g., limonene). The velocity at the minimum of this curve is u_opt.
Table 1: Comparison of Carrier Gas Properties for Essential Oil Analysis
| Gas | Optimal Linear Velocity (cm/s) | Van Deemter Curve Profile | Key Advantage for Essential Oils | Primary Consideration |
|---|---|---|---|---|
| Helium (He) | 25-35 | Broad minimum, forgiving | Excellent resolution, inert, safe | Cost and supply volatility |
| Hydrogen (H₂) | 35-55 | Steep, sharp minimum | Faster analysis, optimal efficiency | Flammability; requires generator |
| Nitrogen (N₂) | 12-20 | Low, flat minimum | Low cost, safe | Slower analysis; lower efficiency |
Diagram 1: Flow Optimization and Method Development Workflow (100 chars)
Designing the Temperature Gradient Program
The temperature program manages analyte retention (k) and selectively influences the separation of compounds with different boiling points and polarities.
Experimental Protocol for Gradient Optimization:
- Initial Conditions: Set carrier gas flow to the determined u_opt.
- Scouting Run: Perform a fast gradient (e.g., 40°C to 300°C at 20°C/min) to identify the approximate elution window of the target compounds.
- Segmented Gradient Design: Divide the run into segments based on scouting data.
- Initial Hold: 3-5 minutes at 40-50°C to focus volatile monoterpenes.
- Ramp 1: Moderate rate (3-5°C/min) through the primary elution zone of monoterpenes.
- Intermediate Hold: Optional hold to resolve a critical pair (e.g., limonene/β-phellandrene).
- Ramp 2: Steeper rate (8-12°C/min) through higher boiling sesquiterpenes.
- Final Bake-Out: High temperature hold to elute any heavy compounds and clean the column.
- Iterative Refinement: Adjust ramp rates and introduce/alter hold times based on the resolution of critical peak pairs identified in each run.
Table 2: Effect of Temperature Ramp Rate on Peak Characteristics
| Ramp Rate (°C/min) | Analysis Time | Peak Width | Peak Capacity (Peaks/run) | Risk of Co-elution |
|---|---|---|---|---|
| Slow (1-3) | Long | Narrow | High | Low for compounds in that zone |
| Moderate (5-8) | Balanced | Moderate | Good | Moderate, requires optimization |
| Fast (10-20) | Short | Broad | Reduced | High in complex mixtures |
Synergistic Tuning: Integrated Method Development
The final optimization requires simultaneous adjustment of flow and temperature. Modern GC-MS systems often use retention time locking and method translation software, but understanding the manual principles is key.
Integrated Experimental Protocol:
- Lock the carrier gas at a constant pressure/flow corresponding to u_opt.
- Use a standardized test mixture relevant to essential oils (e.g., alkane series, terpene standards).
- Run the initial temperature gradient. Calculate resolution (R) for all adjacent peak pairs.
- If early peaks are poorly resolved: Increase the initial hold time or decrease the first ramp rate.
- If late peaks are too broad & resolution suffers: Consider a slightly higher final ramp rate or a higher final temperature.
- If critical pair resolution is insufficient mid-run: Introduce an isothermal hold at the temperature just before their elution.
- Validate the final optimized method on a real, complex essential oil sample (e.g., Pogostemon cablin or Citrus aurantium).
Diagram 2: GC-MS Parameter Interaction for Peak Resolution (95 chars)
The Scientist's Toolkit: Essential Research Reagent Solutions
Table 3: Key Materials and Reagents for Method Development
| Item | Function in Optimization | Example/Note |
|---|---|---|
| Alkane Standard Solution (C8-C40) | Determines Kovats Retention Indices (RI) for compound identification independent of small parameter shifts. | Must be analyzed under identical optimized conditions. |
| Terpene Standard Mixture | Provides known retention times and peak shapes for calibration of the temperature program for target compound classes. | Should include mono- and sesquiterpene hydrocarbons and oxygenated derivatives. |
| Deactivated Guard Column / Retention Gap | Protects the analytical column from non-volatile residues in essential oils, maintaining optimal flow and efficiency. | 1-5m of 0.25mm deactivated fused silica. |
| High-Purity Carrier Gas & Trap Filters | Ensures consistent, oxygen- and moisture-free gas flow. Critical for maintaining column integrity and stable baseline. | Use in-line moisture/oxygen traps; essential for H₂ generators. |
| Certified Reference Essential Oils | Provides a complex, real-world matrix with known approximate composition to validate method robustness and resolution. | e.g., NIST or reputable commercial standards for lavender, peppermint. |
| Data System with GC Method Translation Software | Allows predictive scaling of methods when changing column dimensions or carrier gas type while preserving elution order. | e.g., Agilent Method Translation, Shimadzu Method Scaling. |
This technical guide details the critical mass spectrometry (MS) parameter optimization for Gas Chromatography-Mass Spectrometry (GC-MS) analysis of essential oils, framed within a broader thesis on advancing analytical fidelity in phytochemical research. Precise tuning of Electron Impact (EI) ionization conditions, mass scan ranges, and solvent delay times is paramount for achieving comprehensive metabolite profiling, accurate identification, and reliable quantification in complex essential oil matrices for research and drug discovery applications.
Essential oils represent complex mixtures of volatile and semi-volatile organic compounds, including monoterpenes, sesquiterpenes, and aromatic phenylpropanoids. GC-MS is the cornerstone analytical technique for their deconvolution. The separation power of GC coupled with the identification capability of MS provides a robust platform. However, the analytical outcome is heavily dependent on the meticulous optimization of MS parameters to balance sensitivity, spectral quality, and compound library match fidelity.
Electron Impact (EI) Ionization Optimization
EI is the standard hard ionization technique in GC-MS, producing reproducible, library-searchable mass spectra by bombarding analytes with 70 eV electrons.
Key Tunable Parameters & Effects
| Parameter | Typical Range for Essential Oils | Optimal Setting Rationale | Impact on Spectra |
|---|---|---|---|
| Electron Energy | 50-70 eV | 70 eV (Standard) | Maximizes fragmentation for library matching; lower energies reduce fragmentation, potentially enhancing molecular ion visibility. |
| Emission Current | 50-350 µA | 100-200 µA | Higher currents increase ion yield and sensitivity but may shorten filament life. Optimal balance is instrument-specific. |
| Ion Source Temperature | 200-300 °C | 230-270 °C | Ensures volatilized analytes remain in gas phase, prevents condensation. Too high may promote thermal decomposition. |
Experimental Protocol: EI Source Tuning and Calibration
Objective: To optimize EI source parameters for maximum sensitivity and correct mass assignment using a perfluorotributylamine (PFTBA) tuning standard. Procedure:
- Introduce PFTBA via the built-in vaporizer or by injecting 1 µL via GC inlet.
- Set initial parameters: 70 eV, 150 µA emission, 250 °C source temperature.
- Initiate the autotune sequence of the mass spectrometer. This automatically adjusts lens voltages to maximize the signal for key reference ions (e.g., m/z 69, 219, 502 for many instruments).
- Post-autotune, manually verify the relative abundances of the PFTBA key ions against the manufacturer's specification table. Adjustments may be required to meet standard abundance criteria (e.g., m/z 219/220 ratio).
- Perform a mass calibration check using the same standard to ensure mass accuracy is within ±0.1 amu.
Defining Optimal Mass Scan Ranges
Selecting the appropriate mass-to-charge (m/z) scan range prevents unnecessary data collection and improves detection limits for low-abundance ions.
Recommended Scan Ranges by Compound Class
| Essential Oil Compound Class | Recommended Scan Range (m/z) | Rationale |
|---|---|---|
| Monoterpene Hydrocarbons (e.g., Limonene, Pinene) | 40-160 | Molecular ions typically ≤136; fragments dominate lower mass range. |
| Oxygenated Monoterpenes (e.g., Linalool, Menthol) | 40-180 | Molecular ions ≤154; includes key oxygen-containing fragments. |
| Sesquiterpene Hydrocarbons (e.g., Caryophyllene) | 40-220 | Molecular ions ≤204. |
| Sesquiterpene Alcohols (e.g., Bisabolol) | 40-240 | Molecular ions ≤222. |
| Phenylpropanoids (e.g., Eugenol, Anethole) | 40-180 | Molecular ions ≤164; characteristic benzene ring fragments. |
| General Untargeted Profiling | 40-300 | Captures all common essential oil components with margin. |
Experimental Protocol: Determining Scan Range via Pre-Scan
Objective: To empirically determine the necessary scan range for a specific essential oil sample. Procedure:
- Perform an initial GC-MS run with a broad scan range (e.g., m/z 35-500).
- Process the total ion chromatogram (TIC) and extract the mass spectrum of the most intense peak.
- Identify the highest m/z fragment with significant relative abundance (>1%) and note the molecular ion if present.
- Set the lower limit to m/z 40 (to exclude common background ions like N₂, O₂, Ar) and the upper limit to 20-30 amu above the highest significant m/z observed.
- Validate the new range with a second injection, ensuring no high-mass ions of interest are truncated.
Solvent Delay Timing
The solvent delay is a critical time period during which the MS detector is turned off to prevent saturation by the solvent peak, protecting the filament and electron multiplier.
Determining Optimal Solvent Delay Time
| Parameter | Consideration | Calculation Method |
|---|---|---|
| Solvent Type | Hexane, Dichloromethane, Ethyl Acetate | Different boiling points affect elution time. |
| Column Dimensions | Length, Inner Diameter (ID), Film Thickness | Impacts retention time of solvent. |
| Inlet Pressure/Flow | Carrier Gas Linear Velocity | Higher flow speeds elution. |
| Oven Temperature Program | Initial Hold Time/Ramp Rate | Lower initial temp delays solvent elution. |
Formula for Estimation:
Solvent Delay ≈ (Column Void Time * 1.5) + Initial Hold Time
Column Void Time can be calculated from column dimensions and flow rate or measured via an unretained compound (e.g., methane).
Experimental Protocol: Empirical Solvent Delay Determination
Objective: To accurately determine the solvent delay time for a specific method. Procedure:
- Under the final chromatographic conditions, inject 1 µL of pure solvent.
- Start the MS data acquisition in full scan mode from time zero.
- Monitor the total ion current (TIC) trace. The solvent will produce a large, sharp peak.
- Note the time at which the TIC returns to baseline after the solvent peak. Add a safety margin of 0.1-0.2 minutes.
- Program this time as the "solvent delay" in the MS method. The detector will remain off until this time elapses.
Integrated Workflow for Parameter Optimization
Title: GC-MS Parameter Optimization Workflow for Essential Oils
The Scientist's Toolkit: Key Research Reagent Solutions
| Item | Function in GC-MS Analysis of Essential Oils |
|---|---|
| PFTBA (Perfluorotributylamine) | The universal mass calibration and tuning standard for EI sources. Provides key ions across a wide mass range for verifying sensitivity, resolution, and mass accuracy. |
| n-Alkane Series (C8-C40) | Used for calculating Kovats Retention Indices (RI), a critical secondary parameter for compound identification that is independent of the MS system. |
| Deuterated Internal Standards | Compounds like Toluene-d8 or Naphthalene-d8. Spiked into samples to correct for injection volume variability, sample preparation losses, and instrument drift. |
| Silylation Reagents | e.g., MSTFA, BSTFA. Derivatize polar compounds (e.g., alcohols, acids) in oxygenated oils to improve their volatility, thermal stability, and chromatographic peak shape. |
| Polar & Non-Polar Certified GC Columns | e.g., 5% Phenyl Polysiloxane, 100% Dimethyl Polysiloxane. Used to confirm identifications by comparing compound elution order and RI on stationary phases of different polarities. |
| Ultra-Pure Solvents | Hexane, Dichloromethane, Ethyl Acetate. Used for sample dilution. Must be residue-free to avoid artifact peaks in the chromatogram. |
| Commercial & Custom Essential Oil Libraries | NIST, Wiley, Adams libraries. Databases of EI mass spectra and RI values essential for automated and manual compound identification. |
| Retention Index Marker Mix | Pre-mixed solution of n-alkanes at known concentrations for precise RI determination during sample runs. |
Within the context of a thesis on Gas Chromatography-Mass Spectrometry (GC-MS) principles for essential oil analysis, robust data processing is paramount. The complexity of essential oil matrices, often containing dozens of co-eluting terpenoids and oxygenated derivatives, demands a rigorous analytical workflow. This guide details the core computational and statistical processes—peak integration, deconvolution, and semi-quantitative reporting—that transform raw chromatographic data into reliable, interpretable results for researchers, scientists, and drug development professionals.
Peak Detection and Integration
Peak integration is the foundational step, quantifying the area under each chromatographic peak, which is proportional to the amount of the analyte.
Protocol: Algorithmic Peak Integration
- Baseline Correction: Apply a rolling ball or polynomial fitting algorithm to the total ion chromatogram (TIC) to correct for instrument drift and column bleed. Subtract the baseline from the raw signal.
- Peak Detection (First Derivative Method):
- Calculate the first derivative of the baseline-corrected TIC.
- Identify peak start and end points where the derivative crosses zero.
- Set a signal-to-noise threshold (typically 3:1 or 10:1) to discriminate true peaks from noise.
- Integration: Calculate the area under the peak (AUP) for each detected peak using the trapezoidal rule:
Area = Σ [ (x_{i+1} - x_i) * (y_i + y_{i+1}) / 2 ]across all data points (i) from peak start to end.
Peak Deconvolution
Deconvolution is critical for resolving overlapping peaks in complex essential oil chromatograms, where individual component spectra are entangled.
Protocol: Automated Mass Spectral Deconvolution and Identification System (AMDIS) Workflow
- Data Import: Load the GC-MS data file (.D, .RAW, .QGD) into deconvolution software (e.g., AMDIS, ChromaTOF, or open-source tools like MZmine).
- Parameter Setting:
- Component Width: Estimate based on chromatographic peak width (e.g., 8-12 seconds).
- Resolution: Set to "High."
- Shape Requirements: Set to "Medium" to allow for asymmetric peaks.
- Sensitivity: Adjust to match the complexity of the sample; higher sensitivity for more components.
- Deconvolution Execution: The algorithm (e.g., the model function of AMDIS) analyzes successive mass scans, extracts pure component spectra by identifying unique ions and their evolution over time, and constructs reconstructed ion chromatograms (RICs) for each resolved component.
- Library Matching: Compare deconvoluted pure spectra against reference libraries (NIST, Wiley, in-house). Accept matches with a similarity index (SI) > 800/1000 and a purity factor > 70%.
Semi-Quantitative Analysis
Semi-quantitative reporting provides relative abundance data, essential when authentic standards are unavailable for all components.
Protocol: Relative Percentage and Internal Standard Method
- Internal Standard (IS) Calibration: Spike a known concentration of a non-interfering compound (e.g., n-alkane, internal standard like nonadecane) into each sample prior to injection.
- Relative Response Factor (RRF) Estimation (Optional): For key target analytes with available standards, calculate RRF relative to the IS:
RRF = (Area_{analyte} / Conc_{analyte}) / (Area_{IS} / Conc_{IS}). - Percentage Calculation: For each identified component (i), calculate its relative percentage using the area normalization method:
% Component_i = (Area_i / Σ(Areas of all integrated peaks)) * 100. If using an IS, calculate concentration:Conc_i = (Area_i / Area_{IS}) * (Conc_{IS} / RRF_i). - Reporting: Express results as mean ± relative standard deviation (RSD) for replicate analyses.
Data Presentation
Table 1: Semi-Quantitative Report of a Lavender Essential Oil Analysis
| Peak No. | Retention Time (min) | Compound Name | Similarity Index | Area Counts | Relative % | RSD% (n=3) |
|---|---|---|---|---|---|---|
| 1 | 9.87 | α-Pinene | 945 | 1,245,789 | 12.5 | 1.8 |
| 2 | 12.34 | β-Myrcene | 921 | 876,543 | 8.8 | 2.3 |
| 3 | 14.56 | Limonene | 963 | 2,123,456 | 21.3 | 1.5 |
| 4* | 15.12/15.23 | Linalool (deconvoluted) | 932 | 1,567,890 | 15.7 | 2.1 |
| 5 | 18.90 | Linalyl acetate | 988 | 3,456,789 | 34.7 | 0.9 |
| Total Identified | 9,270,467 | 93.0 |
*Peak resolved via deconvolution from a co-eluting terpene.
Table 2: Comparison of Deconvolution Algorithms for Overlapping Terpenoids
| Algorithm | Avg. Purity Factor | Avg. Similarity Index | Processing Time per Sample (s) | Success Rate (% Resolved) |
|---|---|---|---|---|
| AMDIS Model Function | 84 | 912 | 45 | 95 |
| Multivariate Curve Resolution (MCR) | 91 | 895 | 180 | 98 |
| Independent Component Analysis (ICA) | 78 | 870 | 120 | 88 |
Mandatory Visualization
GC-MS Data Analysis Core Workflow
Peak Deconvolution Signaling Pathway
The Scientist's Toolkit
Table 3: Key Research Reagent Solutions for GC-MS Essential Oil Analysis
| Item | Function/Benefit |
|---|---|
| C7-C30 Saturated Alkane Standard | Used for determination of Kovats Retention Indices (RI), critical for compound identification alongside mass spectra. |
| Internal Standard (e.g., Nonadecane, Hexadecane) | Added in known concentration before analysis to correct for injection volume variability and sample loss during preparation. |
| NIST/Adams/Wiley Mass Spectral Libraries | Commercial databases containing reference spectra and RI for essential oil components, used for automated matching. |
| Deconvolution Software (AMDIS, ChromaTOF) | Specialized algorithms to mathematically resolve overlapping peaks and extract pure component spectra. |
| Stationary Phase Reference Mixtures | Test mixtures (e.g., Grob mix) to verify column performance, resolution, and inertness before analyzing precious samples. |
| Derivatization Reagents (e.g., MSTFA) | For polar compounds not amenable to direct GC analysis, they increase volatility and stability. |
Solving Analytical Challenges: Troubleshooting GC-MS for Complex Essential Oil Matrices
Within the framework of a broader thesis on the application of Gas Chromatography-Mass Spectrometry (GC-MS) principles for essential oil analysis research, the reliability of chromatographic data is paramount. Peak tailing, carryover, and baseline drift are three pervasive technical challenges that compromise data integrity, leading to inaccurate compound identification, erroneous quantification, and reduced reproducibility. For researchers, scientists, and drug development professionals, systematically diagnosing and remedying these issues is critical for ensuring the validity of compositional analyses, stability studies, and biomarker discovery in complex matrices like essential oils. This in-depth guide provides a technical examination of these artifacts, offering current diagnostic protocols and experimental solutions.
Peak Tailing
Peak tailing, characterized by an asymmetrical peak shape with a prolonged trailing edge, reduces resolution and quantification accuracy. In essential oil analysis, tailing often indicates undesirable secondary interactions between polar analytes (e.g., phenols, alcohols) and active sites in the GC system.
Primary Causes & Diagnostic Experiments:
| Cause | Diagnostic Experiment | Quantitative Metric (Acceptable Range) |
|---|---|---|
| Active Sites in Inlet/Liner/Column | Analyze a test mixture of 1-Octanol and n-Decane. | Tailing Factor (Tf) for Octanol > Decane (Tf < 1.5 is ideal) |
| Column Overload | Inject a series of dilutions of a target analyte. | Peak Tailing decreases with lower injection volume/concentration. |
| Inappropriate Injector Temperature | Run samples at varying injector temperatures. | Optimal Tf achieved at a specific temperature (e.g., 250°C). |
| Poorly Deactivated Column | Compare performance of brand-new vs. well-used column on the same test mix. | Significant reduction in Tf for polar compounds on a used column. |
Detailed Experimental Protocol: Active Site Diagnostic Test
- Reagents: Prepare a test solution containing n-decane (non-polar) and 1-octanol (polar) at approximately 100 ng/µL each in hexane.
- GC-MS Parameters: Use a mid-polarity column (e.g., 35% phenyl dimethylpolysiloxane). Set inlet to 250°C, split mode (50:1). Oven program: 50°C (hold 2 min), ramp 10°C/min to 250°C.
- Procedure: Inject 1 µL of the test mixture. Integrate both peaks and calculate the Tailing Factor (Tf) at 10% peak height: Tf = (a + b) / 2a, where 'a' is the front half-width and 'b' is the back half-width.
- Interpretation: A Tf for 1-octanol significantly > 1.5 and greater than that for n-decane indicates active sites.
Corrective Actions:
- Replace/Recondition Inlet Liner: Use a deactivated, single-taper liner with wool for essential oils.
- Trim Column: Cut 10-50 cm from the front end of the analytical column to remove contaminated/deactivated stationary phase.
- Use Guard Columns: Install a 1-5 m deactivated retention gap.
- Proper Column Conditioning: Follow manufacturer protocols before initial use.
- Optimize Sample Derivatization: For severe tailing of polar compounds (e.g., acids), employ derivatization agents like BSTFA.
Carryover
Carryover manifests as the appearance of analyte peaks in a blank solvent run immediately following a high-concentration sample. It leads to false positives and overestimation of trace components, a critical concern in profiling low-abundance compounds in essential oils.
Primary Causes & Diagnostic Experiments:
| Cause | Diagnostic Experiment | Quantitative Metric (Acceptable Threshold) |
|---|---|---|
| Contaminated Syringe | Perform consecutive blank injections with the same syringe. | Peak area in blank < 0.1% of peak area in previous sample. |
| Incomplete Vaporization in Liner | Inject a high-boiling point compound (e.g., C30 hydrocarbon) followed by blanks. | Presence of the compound in subsequent blank runs. |
| Adsorption in Flow Path | Inject a high-concentration "sticky" compound (e.g., sesquiterpene alcohol) and run a sequence of heated blanks. | Carryover persists for multiple runs. |
Detailed Experimental Protocol: System Carryover Test
- Reagents: High-concentration standard (e.g., 1000 µg/mL Methyl Salicylate in hexane) and pure hexane (blank).
- GC-MS Parameters: Standard analytical method for essential oils.
- Procedure: (1) Inject the high-concentration standard. (2) Immediately perform three consecutive injections of the pure hexane blank. (3) Analyze the blank chromatograms for the presence of methyl salicylate.
- Interpretation: Any peak for the standard in the first blank > 0.1% of its original area indicates significant carryover requiring intervention.
Corrective Actions:
- Optimize Inlet Purge Flow and Time: Increase the split flow and/or the purge activation time to flush the liner more thoroughly.
- Change Liner Type: Switch to a high-performance liner designed for difficult matrices (e.g., "cup" design with frit).
- Implement Rigorous Solvent Wash Cycles: Program the autosampler for extensive post-injection syringe washes (e.g., 3-5 washes with a strong solvent like dichloromethane followed by sample solvent).
- Perform System Bake-Out: After a sequence of high-concentration samples, run a blank and hold the column at its maximum temperature for 10-20 minutes.
Baseline Drift
Baseline drift is a continuous upward or downward shift in the detector signal over the course of a chromatogram, complicating peak integration and identification of late-eluting compounds crucial for comprehensive essential oil profiles.
Primary Causes & Diagnostic Experiments:
| Cause | Diagnostic Experiment | Quantitative Metric (Observation) |
|---|---|---|
| Column Bleed (Oven Temperature Dependent) | Run a temperature program to the column's upper limit with no injection. | Baseline rise correlates with temperature; excessive increase indicates high bleed. |
| Contaminated Gas Supply/Filter | Replace the gas filter (trap) and observe baseline. | Reduction in baseline noise and drift. |
| MS Source/Dirty Detector | Compare baseline from a new, well-tuned instrument to the instrument in question. | Gradual increase in baseline offset and noise over time/use. |
Detailed Experimental Protocol: Column Bleed Assessment
- Reagents: None required (no injection).
- GC-MS Parameters: Set the oven program to mimic a typical essential oil method (e.g., 50°C to 280°C at 10°C/min, hold 10 min). Use standard carrier gas flows.
- Procedure: (1) Ensure the column is properly connected. (2) Start the method without making an injection. (3) Acquire the TIC (Total Ion Chromatogram).
- Interpretation: A smooth, gradually rising baseline is normal column bleed. A large, irregular, or noisy rising baseline indicates a contaminated column, degraded stationary phase, or air leak.
Corrective Actions:
- Condition/Trim Column: Properly condition a new column. Trim the front end if contaminated.
- Use High-Purity Gases and Traps: Employ carrier gas purifiers (oxygen/moisture/hydrocarbon traps) and ensure gas cylinder purity (≥ 99.9995%).
- Lower Final Oven Temperature: Operate 10-20°C below the column's maximum temperature limit.
- Perform Regular MS Maintenance: Clean the ion source, replace the filament, and clean/replace the electron multiplier as per manufacturer schedules.
- Check for Leaks: Perform a routine leak check, especially after column installation.
The Scientist's Toolkit: Research Reagent Solutions
| Item | Function in GC-MS Analysis of Essential Oils |
|---|---|
| Deactivated Inlet Liners (with Wool) | Minimizes activity for polar compounds; wool homogenizes vaporization and traps non-volatile residues. |
| High-Purity Solvents (HPLC/GC Grade) | Reduces background contamination and spurious peaks from solvent impurities. |
| Alkane Standard Mix (C8-C40) | For calculating Linear Retention Indices (LRI), essential for compound identification in essential oils. |
| Silylation Derivatization Reagents (e.g., BSTFA + 1% TMCS) | Derivatizes hydroxyl and carboxyl groups, reducing polarity, improving peak shape, and thermal stability. |
| Oxygen/Moisture Traps | Installed on carrier gas lines to prevent column degradation and baseline rise. |
| Performance Test Mixtures | Contains compounds (e.g., fatty acid methyl esters) to assess resolution, tailing, and carryover. |
| Deactivated Retention Gap/Guard Column | Protects the analytical column from matrix contamination, extending its life. |
| MS Calibration Standard (e.g., PFTBA) | Used to tune and calibrate the mass spectrometer for accurate mass assignment. |
Visualizing the Diagnostic and Correction Workflow
In Gas Chromatography-Mass Spectrometry (GC-MS) analysis of essential oils, complex matrices frequently result in co-elution, where two or more compounds share an identical chromatographic retention time. This presents a significant challenge for accurate qualitative identification and quantitative determination. Within the broader thesis on GC-MS principles for essential oil research, this whitepaper addresses this core analytical hurdle. We explore advanced software-based deconvolution and hardware-driven heart-cutting techniques as sophisticated solutions to resolve overlapping peaks, thereby ensuring the fidelity of chemical profiling critical for research and drug development.
Advanced Deconvolution Software
Deconvolution algorithms mathematically separate overlapping mass spectra, attributing fragment ions to their correct parent analyte without physical separation.
Core Algorithms and Software Solutions
Modern software employs algorithms like the Automated Mass Spectral Deconvolution and Identification System (AMDIS), Unique Mass (Unique Ion) methods, and multivariate curve resolution (MCR).
Table 1: Comparison of Key Deconvolution Software (2023-2024 Data)
| Software/Algorithm | Primary Method | Key Metric (Avg. Purity Gain*) | Typical Use Case in EO Analysis |
|---|---|---|---|
| AMDIS (NIST) | Model-based, peak factorization | 25-40% | Untargeted profiling of complex sesquiterpene hydrocarbons |
| MassHunter (Agilent) | Spectral Deconvolution | 30-50% | Targeted quantification of co-eluting oxygenated monoterpenes |
| ChromaTOF (LECO) | High-Speed Deconvolution | 35-55% | Comprehensive 2D GC-MS (GCxGC-TOFMS) data processing |
| ACD/MS Manager | MCR with constraints | 20-35% | Isolation of trace allergens in lavender oil |
| Purity Gain: Estimated increase in spectral purity post-deconvolution for moderately overlapped peaks (Rs ~0.5). |
Experimental Protocol: Software Deconvolution Workflow
Protocol Title: Deconvolution of Co-eluting Peaks in Peppermint Oil Using AMDIS.
- Sample Preparation: Dilute Mentha piperita essential oil in HPLC-grade n-hexane to a concentration of 1% (v/v).
- GC-MS Analysis:
- Column: Equity-5 (30 m × 0.25 mm ID, 0.25 µm film).
- Oven Program: 60°C (hold 2 min), ramp at 3°C/min to 240°C.
- Inlet: 250°C, split ratio 50:1.
- MS: EI at 70 eV, scan range m/z 40-400.
- Data Processing: Import raw data file (.D) into AMDIS.
- Deconvolution Settings:
- Component Width: 12.
- Adjacent Peak Subtraction: One.
- Resolution: Medium.
- Sensitivity: Very High.
- Shape Requirements: Medium.
- Library Search: Deconvoluted spectra are automatically searched against the NIST 2020 and an in-house terpene library. Match factor thresholds >80% (reverse fit) are considered positive identifications.
- Validation: Compare the integrated area of deconvoluted component peaks with those from traditional integration of the Total Ion Chromatogram (TIC).
Diagram 1: Software deconvolution and identification workflow.
Heart-Cutting Techniques (GC-GC/MS)
Heart-cutting, or multidimensional GC (MDGC), physically transfers a selected, unresolved chromatographic fraction from a primary column to a secondary column with different selectivity for further separation.
System Configurations and Performance
The most common setup uses a Deans Switch or a flow modulator as the heart-cutting device.
Table 2: Quantitative Performance of Heart-Cutting vs. Standard 1D GC-MS
| Performance Metric | Standard 1D GC-MS (Rs<1.0) | MDGC with Heart-Cutting | Improvement Factor |
|---|---|---|---|
| Effective Peak Capacity | ~300 | 500-800 | 1.7-2.7x |
| Signal-to-Noise for Trace Analyte* | Baseline obscured | 25:1 | Significant |
| Quantification Accuracy (of minor component) | ±25% RSD | ±8% RSD | ~3x more precise |
| Analysis Time for Target Region | 30 min (full run) | +5-10 min per cut | Situation-dependent |
| Example: 0.5% analyte co-eluting with a 60% major component in bergamot oil. |
Experimental Protocol: Heart-Cutting forLavandulaOil
Protocol Title: Resolving Linalool and Linalyl Acetate Co-elution in Lavandula angustifolia via Deans Switch MDGC.
- System Configuration:
- Primary Column (1D): DB-Wax (30 m × 0.25 mm ID, 0.25 µm) – polar.
- Secondary Column (2D): DB-5ms (2 m × 0.18 mm ID, 0.18 µm) – non-polar.
- Interface: Deans Switch with auxiliary EPC module.
- Detectors: MSD after 2D column, FID after 1D column (optional).
- Method Development:
- Run a standard mixture of linalool and linalyl acetate on the 1D column to determine retention times and the co-elution window (e.g., 14.2 – 14.8 min).
- Optimize the pressure settings on the Deans Switch to ensure quantitative transfer of the cut.
- Heart-Cutting Run:
- 1D Oven Program: 50°C to 240°C at 3°C/min.
- 2D Oven Program: Isothermal at 60°C during cut, then ramp to match 1D.
- At 14.2 min, activate the Deans Switch to divert the effluent from the 1D column onto the 2D column for 0.6 minutes.
- The transferred fraction is separated on the different stationary phase (DB-5ms), resolving the compounds.
- Data Analysis: The MSD records the chromatogram from the 2D separation, providing pure spectra for each compound.
Diagram 2: Deans switch heart-cutting GC-GC/MS system flow path.
The Scientist's Toolkit: Research Reagent Solutions
Table 3: Essential Materials for Managing Co-elution
| Item | Function & Relevance |
|---|---|
| Homologous Series of n-Alkanes (C8-C40) | For precise calculation of Linear Retention Indices (LRI), a critical parameter for confirming compound identity across different methods and columns. |
| Customized Essential Oil Reference Standards | Authentic, high-purity chemical standards (e.g., specific sesquiterpenes, isomers) are mandatory for validating deconvolution accuracy and MDGC transfer efficiency. |
| Deactivated, Ultra-Inert Liner & Column | Minimizes peak tailing and adsorption of active compounds (e.g., alcohols), reducing peak broadening that exacerbates co-elution. |
| Specialized Column Stationary Phases | A set of columns with differing selectivity (e.g., WAX, 5%-phenyl, 35%-phenyl, ionic liquid) is crucial for developing effective 2D methods in heart-cutting. |
| Advanced Data Processing Software License | Access to AMDIS, ChromaTOF, or similar platforms with active updates is necessary for leveraging the latest deconvolution algorithms. |
| Retention Index Calibration Mix | Pre-mixed solutions of alkanes at defined concentrations for consistent LRI determination across laboratories. |
Within the framework of a thesis investigating Gas Chromatography-Mass Spectrometry (GC-MS) principles for essential oil analysis, the choice of mass spectrometric data acquisition mode is paramount. Essential oils are complex matrices containing major constituents and trace-level biomarkers, adulterants, or degradation products. This technical guide provides an in-depth comparison of Full Scan and Selected Ion Monitoring (SIM) modes, focusing on their application in enhancing sensitivity for trace component analysis.
Fundamental Principles and Sensitivity
Full Scan Acquisition
In Full Scan mode, the mass analyzer (typically a quadrupole) scans across a predefined range of mass-to-charge ratios (e.g., m/z 40-500) continuously throughout the chromatographic run. This yields a complete mass spectrum for each point in time, enabling library searches and deconvolution of co-eluting peaks. However, the duty cycle—the fraction of time spent measuring any specific ion—is low, as the instrument time is distributed across the entire mass range.
Selected Ion Monitoring (SIM) Acquisition
SIM mode dedicates the instrument's measurement time to monitoring only a few pre-selected ions characteristic of the target analytes. The quadrupole jumps between these specific m/z values, dwelling on each for tens to hundreds of milliseconds. This results in a significantly higher duty cycle for the ions of interest, dramatically increasing the signal-to-noise ratio (S/N) and sensitivity.
Quantitative Comparison of Performance Characteristics
The core advantage of SIM is its superior sensitivity, as summarized in Table 1.
Table 1: Quantitative Comparison of Full Scan vs. SIM Mode in GC-MS
| Parameter | Full Scan Mode | Selected Ion Monitoring (SIM) Mode | Implication for Trace Analysis |
|---|---|---|---|
| Typical Duty Cycle per Ion | <1% | 10-50% | SIM spends 100-1000x more time measuring the target ion. |
| Limit of Detection (LOD) Improvement Factor | 1x (Baseline) | 10x to 1000x | SIM can detect compounds at concentrations 10-1000 times lower. |
| Dynamic Range | Typically 2-3 orders of magnitude | Can exceed 5 orders of magnitude | SIM is better suited for quantifying both major and trace components in the same run. |
| Selectivity | Moderate (spectral deconvolution possible) | High (chemical noise filtered) | SIM reduces background interference, enhancing S/N in complex matrices like essential oils. |
| Chemical Information | Complete mass spectrum (identification) | Limited to pre-selected ions (quantification) | Full Scan is essential for unknown identification; SIM is targeted. |
| Maximum Ions Monitored | ~500 per scan (entire range) | Typically 10-30 per time window | SIM requires prior knowledge of analyte masses. |
Experimental Protocols for Essential Oil Analysis
Protocol 1: Method Development for SIM Analysis
- Preliminary Full Scan Analysis: Inject a standard of the target trace compound(s) and a representative essential oil sample using Full Scan mode (e.g., m/z 50-550).
- Ion Selection: Examine the mass spectrum of the target analyte. Choose 2-3 characteristic ions: the most abundant (quantifier ion) and 1-2 confirmatory ions (qualifier ions). Prefer higher m/z ions to reduce chemical noise.
- Define SIM Time Windows: Review the GC chromatogram. Segment the run time into windows based on analyte elution. Group target ions that elute closely together into the same window to maximize dwell time.
- Optimize Dwell Time: Set dwell times (typically 50-200 ms per ion) to achieve ≥10 data points across a chromatographic peak while maintaining a sufficient number of cycles per second.
- Validation: Analyze matrix-matched calibration standards in both Full Scan and SIM modes to empirically determine the gain in S/N and the improvement in LOD/LOQ.
Protocol 2: Comparative Sensitivity Experiment
Objective: To quantitatively determine the sensitivity gain of SIM over Full Scan for a trace adulterant (e.g., synthetic santalol in sandalwood oil). Materials: Pure Santalum album oil, synthetic santalol standard, hexane. Procedure:
- Prepare a dilution series of synthetic santalol in hexane (e.g., 100 ppb, 10 ppb, 1 ppb, 0.1 ppb).
- Spike each dilution into a fixed amount of pure sandalwood oil to create matrix-matched standards.
- Analyze each standard in triplicate using:
- Method A: Full Scan (m/z 40-300).
- Method B: SIM monitoring ions m/z 95, 110, and 149 for santalol in a dedicated time window.
- Plot the peak area (or height) versus concentration for the quantifier ion (m/z 110) from both methods.
- Calculate the LOD (S/N=3) and LOQ (S/N=10) for both acquisition modes. The ratio of LOD(Full Scan)/LOD(SIM) provides the experimental sensitivity gain factor.
Visualization of Decision Logic and Workflow
Title: Decision Workflow for Choosing Full Scan vs. SIM Mode
Title: Duty Cycle Comparison: Full Scan vs. SIM
The Scientist's Toolkit: Research Reagent Solutions
Table 2: Essential Materials for GC-MS Trace Analysis in Essential Oils
| Item | Function in Research | Application Note |
|---|---|---|
| Ultra-Inert GC Liners & Columns | Minimizes active sites that cause adsorption/degradation of trace analytes, reducing tailing and improving sensitivity. | Essential for reproducible analysis of terpenes and oxygenated compounds at low levels. |
| High-Purity Solvents (e.g., GC-MS Grade Hexane, Dichloromethane) | Reduces background chemical noise in the chromatogram and mass spectra, leading to lower baseline and higher S/N. | Critical for preparing blanks and diluting concentrated oils for analysis without introducing interference. |
| Deuterated Internal Standards (e.g., d-Camphor, d-Limonene) | Compensates for variability in sample injection, extraction efficiency, and ion source performance; improves quantitation accuracy. | Added to the sample prior to any preparation step for robust Method of Internal Standard quantification in SIM. |
| Matrix-Matched Calibration Standards | Calibration standards prepared in a "blank" or diluted essential oil matrix to account for matrix-induced enhancement/suppression effects in the GC inlet. | Vital for achieving accurate quantification, especially when using a highly sensitive SIM method. |
| Tuning & Calibration Standard (e.g., Perfluorotributylamine - PFTBA) | Used to calibrate mass axis accuracy and optimize ion source parameters (lens voltages) for consistent sensitivity across instrument maintenance cycles. | Regular tuning is mandatory for reliable SIM, as shifts in mass accuracy can cause missed ion detection. |
| Carbofrit / Wool Liners | Provides homogeneous vaporization of the sample and traps non-volatile residues, protecting the analytical column. | Prolongs column life when analyzing complex, concentrated essential oil samples. |
For a thesis grounded in GC-MS analysis of essential oils, the strategic selection between Full Scan and SIM is a critical methodological decision. Full Scan is indispensable for comprehensive profiling and identifying unknown constituents. However, for the quantitative analysis of known trace-level components—whether they are key biomarkers, adulterants, or contaminants—SIM offers a decisive advantage in sensitivity and selectivity. By implementing a structured method development protocol that leverages the strengths of both modes, researchers can significantly enhance the detectability and reliability of data pertaining to trace components in complex essential oil matrices.
Within the broader context of employing Gas Chromatography-Mass Spectrometry (GC-MS) for the authentication and profiling of complex essential oil matrices, column integrity is paramount. The chromatographic column is the heart of the separation, and its performance directly dictates the resolution of intricate terpene and sesquiterpene patterns, the accuracy of quantitative data, and the reliability of mass spectral identification. This technical guide details systematic protocols for monitoring column health, diagnosing issues related to degradation and active sites, and implementing preventative maintenance to ensure data fidelity in research and drug development applications.
Quantitative Performance Metrics and Diagnostic Thresholds
Routine performance checks involve monitoring key parameters against established benchmarks. Deviations indicate degradation or activity.
Table 1: Standard Performance Test Metrics for GC-MS Essential Oil Analysis
| Parameter | Test Method/Compound | Acceptable Range | Indication of Problem |
|---|---|---|---|
| Column Efficiency (Theoretical Plates) | n-C16 or n-C18 alkane peak | > 20% drop from initial | General degradation, poor installation, contaminated inlet. |
| Peak Asymmetry (As) | n-Docosane (C22) or other inert peak | 0.9 - 1.2 | As > 1.2: Tailing (active sites). As < 0.9: Leading (overloaded/contaminated). |
| Adsorption of Polar Compounds | 2,6-Dimethylphenol (DMP) / 2,6-Dimethylaniline (DMA) test | Response Ratio (DMP/DMA) 0.8 - 1.2 | Ratio < 0.8 indicates active silanol sites, causing tailing/loss of phenols (e.g., thymol, carvacrol). |
| Acid/Base Surface Activity | Grob Test Mix (e.g., octanoic acid, 2,3-butanediol, dicyclohexylamine) | Symmetric peaks, no tailing, >90% recovery for all. | Tailing of acids: basic sites. Tailing of amines: acidic sites. Loss: irreversible adsorption. |
| Bleed Profile | Temperature-programmed blank run (no injection) | Baseline rise consistent with column spec; no spiking. | High bleed masks low-level analytes, raises baseline, contaminates ion source. |
Experimental Protocols for Diagnosis and Maintenance
Protocol 1: The DMP/DMA Activity Test
Objective: Quantify active silanol sites on a semi-polar or non-polar column. Reagents: Research-grade 2,6-Dimethylphenol and 2,6-Dimethylaniline in n-hexane (~10 ng/µL each). Procedure:
- Prepare a 1:1 (v/v) mix of the DMP and DMA solutions.
- Inject 1 µL in split mode (e.g., 50:1) onto the column under standard temperature-programmed conditions (e.g., 50°C to 280°C at 10°C/min).
- Integrate the peak areas for both compounds.
- Calculate the Response Ratio (RR) = (Area DMP / Area DMA).
- Diagnosis: RR between 0.8-1.2 indicates acceptable inertness. RR < 0.8 suggests significant activity, leading to phenolic compound loss in essential oils (e.g., eugenol).
Protocol 2: Preventative Conditioning and Baking Out
Objective: Remove non-covalent contamination and temporarily deactivate mild sites. Procedure:
- After ensuring the column is not connected to the MS detector, set the carrier gas flow to the operational rate.
- Program the oven: 50°C for 1 min, then ramp at 5°C/min to 20°C above the column's maximum isothermal temperature (but not exceeding the limit), hold for 30-60 minutes.
- Cool down. Reconnect to MS. Perform a blank run to confirm reduced bleed.
- Note: For severe contamination, trimming 10-30 cm from the inlet end may be necessary before conditioning.
The Scientist's Toolkit: Essential Reagents and Materials
Table 2: Research Reagent Solutions for Column Diagnostics & Maintenance
| Item | Function / Purpose |
|---|---|
| Grob-type Test Mixture | A calibrated mix of compounds of varying polarity and functionality (alkanes, alcohols, aldehydes, acids, amines) to holistically assess column performance, efficiency, inertness, and phase thickness. |
| DMP/DMA Test Solution | Specific diagnostic for phenolic adsorption, critical for essential oil analysis where phenols are key biomarkers. |
| Deactivated Silica Wool | For properly packing inlet liners to minimize sample flashback and trap non-volatile residues, protecting the column head. |
| High-Purity Alkane Standard (C8-C30) | For measuring retention index (RI) consistency and monitoring for retention time drift, crucial for compound identification in essential oil libraries. |
| Column Sealing Graphite Ferrules (Vespel) | To ensure leak-free connections at the inlet and MS interface, preventing oxygen intrusion (causes stationary phase oxidation) and sample loss. |
| On-Column Injection Standard (e.g., Squalane) | An inert, high-boiling compound to verify the integrity of the injection system and column start without introducing active test analytes. |
Visualizing the Diagnostics and Maintenance Workflow
In Gas Chromatography-Mass Spectrometry (GC-MS) analysis of essential oils, the fidelity of the chromatographic profile and mass spectral data is paramount. Essential oils are complex mixtures of terpenoids and phenylpropanoids highly susceptible to oxidation, hydrolysis, and isomerization. These degradation processes, often accelerated by light, heat, and oxygen, introduce analytical artifacts that can be misidentified as genuine constituents, leading to erroneous phytochemical profiles, incorrect chemotyping, and flawed conclusions in drug discovery research. This guide details the identification of common artifacts and outlines integrated prevention strategies, framed within rigorous GC-MS methodology.
Major Degradation Pathways & Artifact Identification
The degradation of essential oil components follows predictable chemical pathways. Key reactions and their GC-MS detectable outcomes are summarized below.
Table 1: Common Degradation Reactions and Resulting Artifacts in Essential Oils
| Parent Compound Class | Degradation Pathway | Key Artifacts Formed | GC-MS Indicators (m/z shifts, peak changes) |
|---|---|---|---|
| Monoterpene Hydrocarbons (e.g., α-Pinene, Limonene) | Photo-oxidation, Auto-oxidation | Pinene oxides, Verbenone, Carveol, p-Cymene | Increase in oxygenated terpenes (M+16, M+32); New peaks in mid-to-late chromatogram region. |
| Linalool, Citronellal | Acid-catalyzed Cyclization | α-Terpineol, Isopulegol | Appearance of cyclized isomer peaks; Altered retention indices; Changing peak area ratios over time. |
| Esters (e.g., Linalyl acetate) | Hydrolysis | Linalool, Acetic Acid | Decrease in ester peak; Corresponding increase in alcohol peak; Possible acetic acid peak (if TIC monitored). |
| Sesquiterpenes | Isomerization | Various sesquiterpene isomers | Changes in chromatographic peak patterns (co-elution, shoulder peaks); Altered mass spectrum similarity indices. |
| Aldehydes (e.g., Citral) | Oxidation | Geranic acid, Neral acid | Appearance of broad, tailing peaks for acids; Requires derivatization for clear GC-MS analysis. |
Experimental Protocols for Artifact Monitoring
Protocol 3.1: Accelerated Stability Test for Essential Oil Samples Objective: To predict and identify degradation products under stressed conditions. Methodology:
- Sample Preparation: Aliquot the essential oil sample (100 µL) into 2 mL clear and amber glass vials. Leave headspace or purge with air/O₂ as per test condition.
- Stress Conditions: Expose aliquots to: a) UV light (254 nm) for 4-8 hrs, b) Heat (40°C & 60°C) for 7-14 days, c) Ambient lab light for 30 days.
- Control: Store a nitrogen-purged, amber vial at -20°C.
- Analysis: Dilute stressed and control samples 1:100 in hexane. Analyze via GC-MS using a standardized method (e.g., DB-5MS column, 50-250°C gradient).
- Data Comparison: Use AMDIS (Automated Mass Spectral Deconvolution) software to deconvolute co-eluting peaks. Compare mass spectra and retention indices (RI) against control. Monitor for new peaks and significant changes (>10%) in key component ratios.
Protocol 3.2: Derivatization for Oxidized Acidic Artifacts Objective: To detect and quantify carboxylic acids formed from aldehyde oxidation. Methodology:
- Derivatization: Mix 50 µL of sample with 100 µL of MSTFA (N-Methyl-N-(trimethylsilyl)trifluoroacetamide).
- Reaction: Heat at 60°C for 30 minutes to form trimethylsilyl (TMS) esters.
- Analysis: Direct injection of the reaction mixture. TMS-derivatized acids show characteristic mass fragments: M-15 (loss of •CH₃), and often a base peak at m/z 73 [Si(CH₃)₃]⁺.
- Identification: Compare derivatized sample spectra to underivatized control. New, sharp peaks with high RI indicate formed acids.
Prevention & Mitigation Strategies
An integrated workflow from sample collection to data processing is essential.
Diagram 1: Integrated workflow for artifact prevention
The Scientist's Toolkit: Research Reagent Solutions
Table 2: Essential Materials for Preventing Sample Degradation
| Item | Function & Rationale |
|---|---|
| Amper Vials (2 mL, Amber Glass) | Minimizes photo-degradation by blocking UV/visible light. |
| Supelco Inertium PTFE/Silicone Septa | Reduces leachables and maintains inert headspace. |
| Restek Deactivated Gooseneck Liners (Unpacked) | Minimizes thermal degradation and adsorption in GC inlet. |
| High-Purity Nitrogen or Helium Gas (≥99.999%) | For sample purging to displace oxygen, creating an inert atmosphere. |
| Anhydrous Sodium Sulfate (Grade for Trace Analysis) | Removes trace water from samples, preventing hydrolysis. |
| Butylated Hydroxytoluene (BHT) or Ascorbic Acid | Antioxidant additives (use sparingly & document) to inhibit radical oxidation. |
| Certified Stability Reference Standards (e.g., Limonene, Linalool) | Positive controls for monitoring degradation rates in method validation. |
| Retention Index Calibration Mix (C7-C30 Alkanes) | Critical for tracking RI shifts of parent compounds and artifacts. |
Data Interpretation & Diagnostic Ions
Systematic data analysis is key to distinguishing artifacts.
Table 3: Diagnostic Ions for Monitoring Common Degradations
| Target Compound | Characteristic Ions (m/z) | Artifact to Monitor | Artifact Characteristic Ions (m/z) |
|---|---|---|---|
| Limonene | 93, 121, 136 | p-Cymene | 119, 134 |
| Linalool | 71, 93, 121 | α-Terpineol | 59, 93, 136 |
| Citral (Neral/Geranial) | 69, 94, 84 | Geranic Acid (as TMS) | 73, 157, 169 |
| β-Caryophyllene | 93, 133, 204 | Caryophyllene Oxide | 79, 109, 220 |
Diagram 2: Decision workflow for artifact identification
Within a thesis on GC-MS principles for essential oil research, recognizing and mitigating sample degradation is not merely a quality control step but a fundamental analytical requirement. The strategies outlined—from rigorous storage protocols to intelligent data processing—enable researchers to distinguish the true chemical signature of an essential oil from the noise of analytical artifacts. This ensures the accuracy, reproducibility, and scientific validity of research with implications for phytochemistry, authentication, and bioactive compound discovery.
Ensuring Rigor and Reproducibility: Method Validation and Comparative GC-MS Approaches
Within a thesis investigating the application of Gas Chromatography-Mass Spectrometry (GC-MS) for the authentication and quantification of bioactive compounds in essential oils, rigorous method validation is paramount. This guide details the establishment of four core validation parameters—Specificity, Limit of Detection (LOD)/Limit of Quantification (LOQ), Linearity, and Precision—within this specific research context. A validated GC-MS method ensures that analytical results are reliable, reproducible, and fit for purpose, forming the cornerstone for subsequent research on adulteration detection, chemotyping, or pharmacokinetic studies.
Specificity in GC-MS for Essential Oil Analysis
Specificity is the ability to assess the analyte unequivocally in the presence of components that may be expected to be present, such as matrix interferences. In complex essential oil matrices, this is critical.
Experimental Protocol for Specificity Assessment:
- Sample Preparation: Prepare the following solutions:
- Analyte Standard: A reference standard of the target compound (e.g., linalool, menthol, eugenol) at a known concentration.
- Blank Solvent: The pure solvent used for dilution (e.g., hexane, methanol).
- Placebo/Matrix Sample: A representative essential oil sample known to be devoid of the target analyte, or a simulated matrix containing other common terpenes and sesquiterpenes.
- Spiked Matrix: The placebo/matrix sample spiked with the analyte standard at a specified level.
- GC-MS Analysis: Inject all samples under the developed chromatographic conditions (e.g., DB-5ms column, specific temperature gradient).
- Data Analysis:
- Examine the chromatogram of the blank for any interference at the retention time (RT) of the analyte.
- Examine the placebo/matrix chromatogram for any co-eluting peaks at the analyte RT.
- For the spiked matrix, confirm that the analyte peak is:
- Chromatographically Resolved: Baseline separation (resolution R ≥ 1.5) from the nearest eluting peak.
- Spectrally Pure: The mass spectrum at the peak apex, leading edge, and trailing edge should be consistent. Use library matching (e.g., NIST) and confirm with diagnostic target and qualifier ions. A match factor >800/1000 is typically acceptable.
Table 1: Specificity Assessment Criteria
| Component | Acceptance Criterion |
|---|---|
| Blank Interference | Peak area at analyte RT ≤ 20% of LOD area. |
| Placebo/Matrix Interference | Peak area at analyte RT ≤ 5% of target analyte area in spiked sample. |
| Chromatographic Resolution (R) | R ≥ 1.5 between analyte and closest eluting peak. |
| Spectral Purity Match | Forward/Reverse match score ≥ 800 against reference library. |
Specificity Verification Logic for GC-MS Method
Limit of Detection (LOD) and Limit of Quantification (LOQ)
LOD is the lowest concentration yielding a detectable signal (S/N ≥ 3). LOQ is the lowest concentration that can be quantified with acceptable precision and accuracy (typically S/N ≥ 10 and RSD ≤ 20%).
Experimental Protocol for LOD/LOQ Determination (Signal-to-Noise Method):
- Preparation of Dilution Series: Prepare a series of analyte standard solutions at concentrations expected to be near the detection/quantification limit (e.g., 0.1, 0.5, 1.0 µg/mL).
- GC-MS Analysis: Inject each low-concentration standard in triplicate.
- Data Analysis:
- For each chromatogram, measure the peak height (H) of the analyte and the peak-to-peak noise (N) in a blank region near the analyte's RT.
- Calculate the Signal-to-Noise ratio (S/N = H/N).
- The LOD is the concentration yielding an average S/N ≥ 3.
- The LOQ is the concentration yielding an average S/N ≥ 10. Confirm by injecting the LOQ-level solution six times; the relative standard deviation (RSD) of the peak area should be ≤ 20%.
Table 2: Example LOD/LOQ Data for Menthol in Peppermint Oil
| Analyte | Concentration (µg/mL) | Mean S/N Ratio | Inferred Parameter |
|---|---|---|---|
| Menthol | 0.1 | 1.8 | - |
| Menthol | 0.5 | 9.5 | LOQ (S/N ≈ 10, RSD = 18%) |
| Menthol | 1.0 | 19.2 | - |
| Menthol | 0.2 | 3.9 | LOD (S/N ≥ 3) |
Linearity and Range
Linearity is the ability of the method to obtain test results proportional to analyte concentration. The range is the interval between upper and lower concentration levels with demonstrated linearity, precision, and accuracy.
Experimental Protocol for Linearity Assessment:
- Calibration Curve Preparation: Prepare a minimum of five concentration levels of the analyte standard, ideally spanning 50-150% of the expected sample concentration range (e.g., 5, 25, 50, 75, 100 µg/mL). Each level should be prepared independently.
- GC-MS Analysis: Inject each calibration standard in random order. Use a constant injection volume.
- Data Analysis:
- Plot the peak area (or area ratio to internal standard, if used) against the nominal concentration.
- Perform least-squares linear regression analysis to obtain the slope, intercept, and correlation coefficient (r).
- Evaluate the residuals plot for random distribution.
Table 3: Linearity Regression Data for β-Caryophyllene
| Parameter | Value | Acceptance Criterion |
|---|---|---|
| Concentration Range | 10 – 200 µg/mL | - |
| Correlation Coefficient (r) | 0.9994 | r ≥ 0.998 |
| Determination Coefficient (R²) | 0.9988 | R² ≥ 0.996 |
| Y-Intercept (% of response at 100%) | 2.1% | Typically ≤ 5% |
| Residual Standard Deviation | 1.8% | - |
Linearity Assessment Workflow
Precision
Precision expresses the closeness of agreement between a series of measurements under specified conditions. It is assessed at repeatability (intra-day) and intermediate precision (inter-day, inter-analyst) levels.
Experimental Protocol for Precision (Repeatability & Intermediate Precision):
- Sample Preparation:
- Prepare six independent replicate samples at 100% of the test concentration (e.g., a mid-point calibration standard or a homogenized essential oil sample spiked at a known level).
- Repeatability (Intra-day): A single analyst prepares and analyzes all six replicates in one sequence on the same day and instrument.
- Intermediate Precision (Inter-day): A second analyst repeats the procedure (six replicates) on a different day (or using a different GC-MS system, if applicable).
- Data Analysis:
- Calculate the mean concentration and the Relative Standard Deviation (RSD%) for the six measurements for each condition.
- For intermediate precision, the pooled RSD or the overall RSD from all 12 measurements can be calculated.
Table 4: Precision Data for Thymol Quantification
| Precision Level | Mean Concentration (mg/mL) | RSD (%) | Acceptance Criterion (Typical) |
|---|---|---|---|
| Repeatability (n=6, Day 1) | 4.85 | 1.2% | RSD ≤ 2.0% |
| Intermediate Precision (n=6, Day 2) | 4.91 | 1.7% | RSD ≤ 3.0% |
| Overall (Pooled, n=12) | 4.88 | 1.5% | - |
The Scientist's Toolkit: Essential Research Reagents & Materials
Table 5: Key Research Reagent Solutions for GC-MS Method Validation
| Item | Function / Purpose |
|---|---|
| Certified Reference Standards | Pure compounds (e.g., terpenes, phenylpropanoids) for preparing calibration curves, assessing specificity, and determining LOD/LOQ. Essential for accurate quantification. |
| Internal Standard (e.g., Tetradecane, Caryophyllene oxide) | A compound not found in the sample, added at a known concentration to all samples and standards. Corrects for injection volume variability, sample loss, and instrument drift. |
| High-Purity Solvents (HPLC/GC grade) | Solvents like hexane, methanol, or ethyl acetate for diluting standards and samples. High purity minimizes background noise and ghost peaks. |
| Derivatization Reagents (e.g., MSTFA, BSTFA) | For compounds with polar functional groups (-OH, -COOH) that exhibit poor chromatographic behavior. They increase volatility and thermal stability for GC-MS. |
| Retention Index Marker Solution (e.g., n-Alkane series) | A calibrated mixture of straight-chain alkanes (C7-C30) run under identical conditions to calculate Kovats Retention Indices, aiding in compound identification. |
| Essential Oil Matrix Blanks | Authentic, well-characterized essential oils known to be free of specific target analytes. Crucial for specificity and selectivity experiments to assess matrix effects. |
| Silylation-Grade Vials and Septa | Inert vials and septa that prevent adsorption of analytes and do not leach contaminants (e.g., plasticizers) at high GC inlet temperatures. |
The comprehensive analysis of essential oils demands precise quantification of major constituents and reliable identification of trace components. Within a thesis investigating the principles of Gas Chromatography-Mass Spectrometry (GC-MS) for essential oil research, the orthogonal role of Gas Chromatography with Flame Ionization Detection (GC-FID) is indispensable. While GC-MS provides definitive compound identification via mass spectra, GC-FID offers superior linearity and dynamic range for robust quantification. This whitepaper provides a comparative technical analysis of the two techniques, focusing on their synergistic application for quantification and verification in phytochemical and drug development research.
Core Principles and Comparative Metrics
GC-FID quantifies organic compounds by burning them in a hydrogen/air flame, producing ions measured as a current proportional to the carbon mass entering the detector. It is a concentration-sensitive, universal detector with high linearity. GC-MS separates and identifies compounds by their mass-to-charge ratio (m/z). It is a mass-sensitive detector, providing structural information crucial for identification but with a more constrained linear dynamic range for quantification.
The following table summarizes the core technical differences:
Table 1: Fundamental Comparison of GC-FID and GC-MS
| Parameter | GC-FID | GC-MS (Single Quadrupole) |
|---|---|---|
| Detection Principle | Combustion of carbon atoms in a H₂/air flame, measurement of ion current. | Ionization (typically EI), mass separation, and measurement of ion abundance. |
| Primary Output | Chromatogram (Response vs. Time) | Total Ion Chromatogram (TIC) and mass spectra for each peak. |
| Key Strength | Excellent quantitative performance: wide linear range (~10⁶), high precision. | Powerful qualitative analysis: compound identification via spectral library matching. |
| Sensitivity | Typically 1-100 pg of carbon/sec | Typically 1-10 pg for full-scan, sub-pg for SIM mode. |
| Linear Dynamic Range | ~10⁶ - 10⁷ | ~10⁴ - 10⁵ (full-scan) |
| Selectivity | Low/Universal (responds to all combustible compounds). | High. Can be tuned for specific ions (SIM mode) for targeted analysis. |
| Compound Identification | None (relies on retention index matching only). | Definitive, via comparison of acquired mass spectra to reference libraries (e.g., NIST). |
| Orthogonal Role | Primary tool for accurate quantification of known/target analytes. | Primary tool for identification, confirmation, and detection of unknown/co-eluting compounds. |
Experimental Protocols for Orthogonal Analysis
A standard orthogonal workflow for essential oil analysis involves parallel or sequential analysis using both instruments, often with the same chromatographic conditions (column, oven program, carrier gas).
Protocol 3.1: Primary Quantification via GC-FID
- Calibration: Prepare a series of authentic standard solutions (e.g., 1-1000 µg/mL) for key target compounds (e.g., limonene, linalool, menthol). Internal Standard (e.g., n-alkane or a non-native compound) is added to all samples and standards.
- Sample Prep: Dilute essential oil in appropriate solvent (e.g., hexane, methanol) with Internal Standard.
- GC-FID Analysis:
- Column: Equity-5 or equivalent (30m x 0.25mm ID, 0.25µm film).
- Oven: 50°C (hold 2 min) to 250°C at 5°C/min.
- Injector: 250°C, split mode (split ratio 50:1).
- Carrier Gas: Helium or Hydrogen, constant flow (1.0 mL/min).
- Detector: FID at 280°C, H₂ flow 40 mL/min, air flow 400 mL/min, makeup (N₂) 30 mL/min.
- Data Analysis: Quantify compounds using relative response factors (RRF) calculated from the calibration curve of Area(analyte)/Area(IS) vs. Concentration(analyte)/Concentration(IS).
Protocol 3.2: Identification & Verification via GC-MS
- Sample: Analyze the same extract or dilution used for GC-FID.
- GC-MS Analysis:
- GC Conditions: Identical to Protocol 3.1 for retention time alignment.
- MS Conditions:
- Ionization: Electron Impact (EI) at 70 eV.
- Ion Source Temperature: 230°C.
- Transfer Line Temperature: 280°C.
- Scan Mode: Full scan, m/z range 40-400 Da.
- Solvent Delay: Set as per solvent.
- Data Analysis:
- Identify peaks by matching acquired spectra against commercial (NIST, Wiley) and custom libraries.
- Use retention indices (calculated from co-injected n-alkane series) for additional confirmation.
- Verify the purity of quantitated GC-FID peaks by inspecting mass spectra for co-elution.
Protocol 3.3: Orthogonal Verification Procedure
- Quantify the sample using the GC-FID calibration data.
- For each major peak (>1% area), confirm its identity via GC-MS library match (Match Factor >85%) and retention index (±5 units of literature value).
- For trace components or where co-elution is suspected (via MS deconvolution software), report the GC-MS result as semi-quantitative or use GC-MS in Selected Ion Monitoring (SIM) mode with specific standards for accurate quantification.
Visualizing the Orthogonal Workflow
Title: Orthogonal GC-FID & GC-MS Analysis Workflow
Performance Data and Comparative Results
Table 2: Typical Analytical Performance Data for Menthol in Peppermint Oil
| Metric | GC-FID Performance | GC-MS (Full-Scan) Performance | GC-MS (SIM m/z=123) |
|---|---|---|---|
| Linear Range | 0.5 – 1000 µg/mL | 5 – 500 µg/mL | 0.1 – 200 µg/mL |
| Coefficient (R²) | >0.9995 | >0.998 | >0.999 |
| Limit of Detection | 0.15 µg/mL | 1.2 µg/mL | 0.03 µg/mL |
| Repeatability (%RSD) | 0.8-1.5% | 1.5-3.0% | 1.0-2.0% |
| Key Advantage for Use | High-precision routine quantification. | Confirms identity, screens unknowns. | Ultra-trace targeted quant. |
The Scientist's Toolkit: Essential Research Reagents & Materials
Table 3: Key Reagents and Materials for Orthogonal GC Analysis of Essential Oils
| Item | Function / Purpose |
|---|---|
| Authentic Reference Standards | Pure compounds for target analyte identification, calibration curve generation, and calculation of RRFs. |
| Internal Standard (e.g., n-Tetradecane) | Added in equal amount to all samples and standards to correct for injection volume variability and minor instrument drift. |
| n-Alkane Series (C8-C30) | For calculating Kovats Retention Indices, providing a system-independent parameter for compound verification. |
| Chromatographic Solvents | High-purity, residue-free solvents (e.g., hexane, dichloromethane, methanol) for sample dilution and preparation. |
| Derivatization Reagents | (If needed, e.g., for acids/alcohols): MSTFA, BSTFA for silylation to improve volatility and peak shape. |
| Retention Time Locking Kits | Specific standards to align retention times between different GC systems (GC-FID and GC-MS). |
| Mass Spectral Libraries | Commercial (NIST, Wiley) and custom databases for compound identification via spectral matching. |
The orthogonal use of GC-FID and GC-MS represents the gold standard for definitive essential oil analysis. GC-FID serves as the robust quantitative engine, while GC-MS acts as the confirmatory identification tool. This synergy is critical for validating analytical methods in research, ensuring that reported concentrations are unequivocally linked to specific chemical identities. For a thesis grounded in GC-MS principles, demonstrating an understanding of its strengths and limitations relative to GC-FID underscores a comprehensive grasp of the complete analytical ecosystem required for rigorous phytochemical research and drug development.
The Role of Comprehensive Two-Dimensional GC (GCxGC-MS) for Unresolved Complex Mixtures
The analysis of essential oils represents a quintessential challenge in analytical chemistry due to their composition of hundreds to thousands of volatile and semi-volatile organic compounds spanning a wide range of concentrations and chemical classes. Conventional one-dimensional gas chromatography coupled to mass spectrometry (1D GC-MS) often reaches its limits with such samples, resulting in Unresolved Complex Mixtures (UCMs)—humped chromatographic baselines where individual peaks are not fully separated. This co-elution leads to impure mass spectra, hindering accurate compound identification and quantification. Within the thesis framework of advancing GC-MS principles for essential oil research, Comprehensive Two-Dimensional Gas Chromatography (GCxGC) coupled to MS emerges as a transformative solution. By employing two distinct separation mechanisms, it dramatically enhances peak capacity and resolution, effectively dismantling UCMs into discrete, analyzable components.
Core Principle: How GCxGC-MS Addresses UCMs
GCxGC-MS separates compounds on two independent chromatographic columns housed in a single oven. The primary column (typically non-polar) separates largely by boiling point. Effluent from this column is focused and re-injected in rapid, periodic pulses (modulation) onto a secondary column (typically polar) for a very fast separation based on polarity. The result is a two-dimensional chromatogram where each compound has a unique coordinate (¹tʀ, ²tʀ). This orthogonal separation provides two key advantages over 1D-GC:
- Increased Peak Capacity: The theoretical peak capacity is the product of the peak capacities of each dimension, often reaching several thousand.
- Structured Chromatograms: Chemically related compounds (e.g., n-alkanes, sesquiterpenes, fatty acid methyl esters) form ordered patterns or "contours" in the 2D space, facilitating group-type analysis and compound class identification.
Key Quantitative Data: GCxGC-MS vs. 1D GC-MS
Table 1: Performance Comparison for Complex Mixture Analysis
| Performance Metric | 1D GC-MS | GCxGC-MS | Improvement Factor |
|---|---|---|---|
| Theoretical Peak Capacity | 400 - 600 | 1,500 - 10,000+ | 4x to 25x |
| Signal-to-Noise (S/N) Gain | 1x (Baseline) | 20x - 50x | 20x to 50x |
| Number of Peaks Detected (Typical Essential Oil) | 100 - 200 | 400 - 1,500+ | 4x to 8x |
| Confidence in Peak Deconvolution (Co-eluted Peaks) | Low | High | Qualitative leap |
| Dynamic Range Enhancement | Limited | Significantly Improved | Due to zone compression in modulator |
Table 2: Application-Specific Data for Essential Oil UCM Resolution
| Essential Oil / Sample Type | 1D GC-MS Compounds Reported | GCxGC-MS Compounds Reported | Key Resolved UCM Components Identified |
|---|---|---|---|
| Patchouli Oil | ~70 | >300 | Sesquisequiterpenes, nor-patchoulenols |
| Sandalwood Oil | ~80 | >250 | Minor sesquiterpenoids, isomers |
| Petroleum Biodegradates (UCM Reference) | UCM Hump | >5,000 individual peaks | Branched alkanes, cyclic alkanes, naphtheno-aromatics |
| Lemon Peel Oil | ~120 | >400 | Oxygenated terpenes, trace wax esters |
Detailed Experimental Protocol for GCxGC-MS Analysis of Essential Oils
Protocol Title: GCxGC-TOFMS Analysis for Deconvolution of Essential Oil Unresolved Complex Mixtures
1. Sample Preparation:
- Dilute essential oil in high-purity dichloromethane or hexane to a concentration of ~10 mg/mL.
- Filter through a 0.22 µm PTFE syringe filter.
- Add internal standard (e.g., n-alkane C10 or C12 for retention index alignment) at known concentration.
2. Instrumental Configuration (Typical Setup):
- GC: Agilent 8890 or equivalent with a dual-stage cryogenic modulator (LN2 or CO2).
- Modulator Period: 3-8 seconds (sets the width of each 2D slice).
- Primary Column (¹D): Rxi-1MS (non-polar, 100% dimethylpolysiloxane), 30 m × 0.25 mm i.d. × 0.25 µm df.
- Secondary Column (²D): Rxi-17SilMS (mid-polar, 50% phenyl equivalent), 1-2 m × 0.15 mm i.d. × 0.15 µm df.
- Temperature Program (¹D): 40°C (hold 2 min), ramp at 3°C/min to 260°C (hold 5 min).
- ²D Oven Offset: +5°C relative to primary oven.
- Carrier Gas: Helium, constant flow at 1.0 mL/min.
- Injection: 1 µL split (50:1 to 200:1), 250°C inlet.
- MS: Time-of-Flight (TOF) mass spectrometer (e.g., LECO Pegasus or equivalent).
- MS Acquisition Rate: 100-200 Hz (critical for defining ~10 data points across a 2D peak).
- Mass Range: m/z 35-500.
- Ion Source Temperature: 230°C.
- Electron Energy: 70 eV.
3. Data Processing & Workflow:
- Acquire raw data and process using vendor software (e.g., LECO ChromaTOF, GC Image).
- Perform peak finding and spectral deconvolution on the 2D chromatogram.
- Use Reverse Similarity Match Factor (≥800) and Retention Index (RI) matching (using n-alkane series on 1D) for library identification (NIST, Adams Essential Oils, FFNSC).
- Generate structured chromatogram plots and tile/region-based visualizations for compound class assessment.
Visualizations
Diagram 1: GCxGC-MS Workflow for UCM Resolution
Diagram 2: UCM Deconvolution via Orthogonal Separation
The Scientist's Toolkit: Key Research Reagent Solutions
Table 3: Essential Materials and Reagents for GCxGC-MS Analysis
| Item Name / Solution | Function / Purpose | Technical Specification / Note |
|---|---|---|
| High-Purity Solvents (DCM, Hexane) | Sample dilution & preparation. | GC-MS grade, low benzene, in septum-sealed bottles to prevent VOC contamination. |
| n-Alkane Standard Mixture (C7-C30 or C8-C40) | Determination of 1D Linear Retention Index (LRI). | Critical for compound identification in essential oils using Adams or FFNSC libraries. |
| Deuterated Internal Standards (e.g., d8-Toluene, d10-Ethylbenzene) | Quantitative internal standards for specific compound classes. | Corrects for injection and instrumental variability. |
| Stationary Phase Reference Standards | Column performance verification and polarity calibration. | Mix containing alkanes, alkenes, alcohols, fatty acid esters, aromatics. |
| Cryogenic Modulator Consumables | Enables focusing and re-injection of effluent onto 2D column. | Liquid Nitrogen (LN2) or CO2 supply; specialized modulator loops or jets. |
| Retention Index Libraries (Adams, FFNSC) | Reference databases for terpenoid & flavor/fragrance compound identification. | Must contain RI values for both polar and non-polar columns (or 1D RI only for GCxGC). |
| Specialized Data Processing Software | Handles large 4D datasets (1tR, 2tR, m/z, intensity), peak deconvolution, and 2D visualization. | GC Image, LECO ChromaTOF, Shimadzu GCxGC Solution. |
| Low-Bleed GCxGC Columns | Paired sets of 1D and 2D columns with optimized stationary phases. | Common pair: 100% dimethylpolysiloxane (1D) + 50% phenyl polysilphenylene-siloxane (2D). |
Benchmarking Against Pharmacopoeial Standards (USP, EP) for Quality Control
Within the context of research on Gas Chromatography-Mass Spectrometry (GC-MS) principles for essential oil analysis, benchmarking against pharmacopoeial standards is a critical pillar of quality control (QC). The United States Pharmacopeia (USP) and the European Pharmacopoeia (EP) provide the legally recognized compendia of methods and specifications that ensure the identity, strength, quality, and purity of medicinal substances, including many essential oils used in pharmaceuticals. This guide details the technical process of employing these standards to validate and control analytical methods, primarily GC-MS, in a research and development setting.
Core Pharmacopoeial Standards for Essential Oil Analysis
Both USP and EP contain monographs for specific essential oils and general chapters on analytical techniques. Key chapters relevant to GC-MS analysis include:
- USP General Chapters:
<621>Chromatography,<1064>Identification of Articles of Botanical Origin, and various instrument qualification chapters. - EP General Chapters: 2.2.46. Chromatographic separation techniques, 2.8.12. Determination of Essential Oils in Herbal Drugs.
Monographs for oils like Peppermint Oil, Lavender Oil, or Tea Tree Oil specify acceptance criteria such as:
- Identification: Matching retention times/indices and mass spectra to reference standards.
- Assay: Minimum/Maximum percentage of key marker compounds (e.g., Menthol, Linalool).
- Related Substances/Impurities: Limits for specified and unspecified components.
- Other Tests: Specific gravity, optical rotation, refractive index.
Table 1: Comparative Monograph Specifications for Peppermint Oil (Partial)
| Parameter | USP Monograph Requirement | EP Monograph Requirement | Typical GC-MS QC Application |
|---|---|---|---|
| Identification | Chromatogram profile matches Reference Standard. | Retention time of main peaks matches CRM. | System suitability test using certified reference material (CRM). |
| Menthol Content | NLT 50.0% (anhydrous basis) | 30.0% to 55.0% | Quantitative calibration curve using menthol primary standard. |
| Menthone Content | - | 14.0% to 32.0% | Quantitative calibration curve using menthone primary standard. |
| Limit of p-Cymene | NMT 1.0% | NMT 1.0% | Quantification against p-cymene standard; report as % of total area. |
| Chromatographic Purity | Sum of all impurities NMT 2.5%. | Specified impurities limited. | Use of relative response factors or area normalization (100%). |
NLT: Not Less Than; NMT: Not More Than; CRM: Certified Reference Material.
Experimental Protocol: GC-MS Method Validation per USP<1225>
To benchmark an in-house GC-MS method for an essential oil against pharmacopoeial standards, full validation as per USP <1225> "Validation of Compendial Procedures" is required.
1. System Suitability Testing (SST):
- Protocol: Inject a standard solution containing the target analyte(s) and internal standard (if used) in six replicates.
- Acceptance Criteria: Calculate %RSD of retention times (typically ≤1.0%) and peak areas (typically ≤2.0%) for replicates. Resolution (Rs) between critical pair peaks should be ≥1.5. Tailing factor (T) ≤2.0.
2. Specificity/Identity:
- Protocol: Analyze the essential oil sample, a certified reference material (CRM) of the oil, and individual standards of key markers. Compare retention times and mass spectra.
- Acceptance Criteria: The retention time of each analyte in the sample and CRM must match within a specified window (e.g., ±0.05 min). The sample mass spectrum must show a high match factor (e.g., ≥90%) against the reference spectrum from the CRM or library.
3. Linearity and Range:
- Protocol: Prepare a minimum of 5 concentrations of the target analyte(s) across the specified range (e.g., 50% to 150% of target concentration). Inject in triplicate.
- Acceptance Criteria: Correlation coefficient (r) ≥0.998. Visual inspection of residual plot for randomness.
4. Accuracy (Recovery):
- Protocol: Perform a standard addition recovery study. Spike a pre-analyzed essential oil sample with known amounts of analyte at three levels (e.g., 80%, 100%, 120%). Calculate % recovery.
- Acceptance Criteria: Mean recovery should be within 98.0–102.0%.
5. Precision:
- Repeatability (Intra-assay): Analyze six independent preparations of the same sample batch in one day by one analyst.
- Intermediate Precision: Repeat the study on a different day, with a different analyst or different instrument.
- Acceptance Criteria: %RSD for assay of target analyte(s) should typically be ≤2.0%.
6. Robustness:
- Protocol: Deliberately vary method parameters (e.g., oven temperature ramp rate ±1°C/min, carrier gas flow rate ±0.1 mL/min) and assess impact on SST criteria.
Workflow and Relationship Diagrams
Title: Pharmacopoeial QC Workflow for GC-MS EO Analysis
Title: Thesis Context: Linking Validation Parameters to Reliable Data
The Scientist's Toolkit: Key Research Reagent Solutions
Table 2: Essential Materials for Pharmacopoeial GC-MS Benchmarking
| Item | Function & Importance |
|---|---|
| Certified Reference Material (CRM) | Pharmacopoeial-grade substance with certified purity/identity. Critical for method validation, system suitability, and as primary standard for quantification. |
| Pharmacopoeial Reference Standards | USP Reference Standards or EP Chemical Reference Substances (CRS). Used for identification tests and quantitative assays as specified in monographs. |
| High-Purity Solvents (HPLC/GC Grade) | Low UV absorbance, low residue, and minimal MS background interference. Essential for preparing samples and standards without introducing artifacts. |
| Internal Standard (e.g., n-Alkanes, Deuterated Compounds) | Added in known concentration to correct for injection volume variability and instrument drift during quantitative analysis. |
| Stable, Certified GC-MS Columns | Columns with stationary phases specified in monographs (e.g., USP G3, G16). Required to achieve the prescribed chromatographic separation. |
| Performance Check Solutions (e.g., FDA / EP Tuning Mix) | Standard solution for mass spectrometer calibration and tuning to ensure sensitivity, resolution, and mass accuracy are within specified ranges. |
| Certified Volumetric Glassware & Microbalances | Ensure accurate and precise preparation of standard solutions, dilutions, and sample weights, directly impacting accuracy and precision data. |
In the context of a broader thesis on Gas Chromatography-Mass Spectrometry (GC-MS) principles for essential oil analysis, inter-laboratory reproducibility emerges as the foundational pillar for validating chemotaxonomic conclusions, bioactivity claims, and quality control standards. The inherent complexity of essential oils—containing hundreds of volatile terpenoids, phenylpropanoids, and aliphatic compounds at varying concentrations—demands rigorous standardization. Collaborative research across institutions is essential for robust data but is frequently undermined by subtle variations in pre-analytical, analytical, and post-analytical procedures. This guide details the specific SOPs and reporting standards required to achieve reliable, reproducible results in multi-laboratory GC-MS studies of essential oils.
Quantitative data from recent inter-laboratory studies highlight key variability factors.
Table 1: Primary Sources of Inter-Laboratory Variability in Essential Oil GC-MS
| Variability Factor | Impact Metric (Reported Range) | Consequence for Reproducibility |
|---|---|---|
| Sample Preparation (Extraction Method) | Compound yield variance: 15-40% for mid-polarity terpenoids | Alters apparent chemical profile and major/minor compound ratios. |
| GC Inlet Liner Condition & Type | Peak area response degradation: Up to 30% after 50 injections without change. | Causes inconsistent analyte transfer, affecting quantification. |
| GC Oven Temperature Program Rate | Retention time shift: ±0.2-0.5 min for similar columns. | Hinders confident peak alignment and library matching across labs. |
| MS Ion Source Cleanliness | Signal intensity drop: Up to 50% in contaminated vs. clean source. | Affects detection limits and spectral quality for minor components. |
| Data Processing Parameters (Peak Integration) | Area % variance for same dataset: 5-15% between analysts. | Leads to divergent quantitative results from identical raw data. |
Standard Operating Procedures (SOPs) for Collaborative Research
Pre-Analytical SOP: Essential Oil Sample Preparation
- Protocol: Hydrodistillation (Clevenger-type apparatus) shall be the benchmark method for plant material. Precisely document: plant part, drying method, comminution size (e.g., 2mm sieve), plant-to-water ratio (e.g., 1:10 w/v), distillation time (e.g., 3 hours from first drop), and organic solvent for oil collection (e.g., n-hexane, chromatographic grade). The collected oil must be dried over anhydrous sodium sulfate, filtered, and stored in amber vials at -20°C under nitrogen headspace. A Certificate of Analysis for the reference standard (e.g., NIST SRM for peppermint oil) must accompany all sample batches.
Analytical SOP: GC-MS Instrument Parameters
- Protocol: Core parameters must be harmonized. GC: Use of a 30m x 0.25mm ID x 0.25µm film thickness 5%-Phenyl polysilphenylene-siloxane column (or equivalent). Carrier gas: Helium, constant flow 1.0 mL/min. Inlet: Split mode (split ratio 50:1), temperature 250°C. Liner: Deactivated, single gooseneck with wool. Oven program: 60°C (hold 2 min), ramp at 3°C/min to 240°C (hold 5 min). MS: Electron Impact (EI) ionization at 70 eV. Ion source temperature: 230°C. Quadrupole/MS analyzer temperature: 150°C. Solvent delay: set appropriately (e.g., 3 min). Mass scan range: 40-400 m/z. A daily system suitability test using an alkane standard mixture (C7-C30) must be performed to verify retention index calibration.
Post-Analytical SOP: Data Processing & Compound Identification
- Protocol: All labs must process the same shared raw data file for a test sample alongside their own data. Use consensus parameters: Baseline noise threshold = 5; Peak width = 2 seconds; Automatic integration with mandatory manual review. Compound identification requires a three-tiered system: 1) Match of experimental Mass Spectral similarity (>85% against certified library e.g., NIST, Adams, FFNSC). 2) Match of experimental Linear Retention Index (LRI) within ±10 units of published LRI on a comparable stationary phase. 3) For quantitative reporting, use of a single internal standard (e.g., n-Alkane C12 or C13, 0.1% v/v added pre-injection) for calculating relative response factors for key analyte classes.
Minimum Reporting Standards (MIRS) for Publications
All collaborative studies must include a dedicated "Methods & Reproducibility" section reporting:
- Plant Material: Voucher specimen number and herbarium of deposit.
- Extraction: Exact parameters as per SOP 3.1.
- Instrumentation: GC and MS make/model, column specification (including lot number if possible).
- Chromatography: Detailed oven program, carrier gas & flow, inlet type/liner/temperature.
- MS Settings: Ionization mode, energy, scan range, source temperature.
- Identification: Libraries used, minimum similarity score, LRI database used.
- Quantification: Method (e.g., internal standard, % TIC), internal standard identity/concentration, response factors applied.
- Data Deposition: Public repository accession number for raw data files (e.g., MassIVE, Metabolomics Workbench).
Visualization of Collaborative Workflow and Quality Gates
Title: Inter-Lab GC-MS Workflow with Quality Gates
The Scientist's Toolkit: Essential Research Reagent Solutions
Table 2: Key Reagents & Materials for Reproducible Essential Oil GC-MS
| Item | Function & Specification | Critical for Reproducibility |
|---|---|---|
| Alkane Standard Mixture (C7-C30) | Used to calculate experimental Linear Retention Indices (LRI) for compound identification. | Anchors retention times across instruments and labs, enabling reliable peak alignment. |
| Certified Essential Oil Reference Standard | e.g., NIST SRM for specific oils. Provides authentic chemical profile for method validation. | Serves as a benchmark for system performance, quantification accuracy, and inter-lab calibration. |
| Internal Standard (IS) for Quantification | e.g., n-Tridecane (C13) or Alkyl Benzoate. Added to sample at known concentration prior to injection. | Corrects for instrumental drift, sample loss during handling, and injection volume inaccuracies. |
| Deactivated Inlet Liners with Wool | GC inlet liner; wool homogenizes vaporization, reduces non-volatile residue deposition on column. | Ensures consistent analyte transfer to the column, minimizing discrimination and degradation. |
| Stationary Phase-Matched GC Column | 5%-Phenyl polysilphenylene-siloxane (or equivalent) of specified dimensions. | Standardizing the column phase is the single most critical factor for reproducible elution order and LRIs. |
| High-Purity Solvents | e.g., n-Hexane, Dichloromethane (HPLC/GC grade) for sample dilution and collection. | Minimizes contaminant interferences in chromatograms and prevents MS ion source contamination. |
| Certified Mass Spectral Libraries | Commercial (NIST, Adams) and/or in-house validated libraries. | Ensures consistent, high-confidence compound identification based on spectral matching. |
Conclusion
GC-MS remains the indispensable cornerstone for the definitive chemical characterization of essential oils, providing the rigorous data required for biomedical research and pre-clinical drug development. Mastering the foundational principles, optimized methodologies, troubleshooting techniques, and validation frameworks outlined here empowers researchers to generate reliable, reproducible compositional profiles. As the field advances, the integration of GC-MS with orthogonal techniques like NMR and LC-MS, alongside the growing use of GCxGC-MS and machine learning for data analysis, will further unlock the therapeutic potential of essential oils. Standardized, validated GC-MS protocols are critical for establishing structure-activity relationships, ensuring batch-to-batch consistency in investigational products, and translating botanical volatile chemistry into credible clinical evidence.