Decoding Plant Resilience: A Multi-Omics Guide to Stress Response Profiling for Agricultural and Biomedical Research
This article provides a comprehensive overview of current methodologies in plant stress response profiling using integrated multi-omics approaches.
Decoding Plant Resilience: A Multi-Omics Guide to Stress Response Profiling for Agricultural and Biomedical Research
Abstract
This article provides a comprehensive overview of current methodologies in plant stress response profiling using integrated multi-omics approaches. Targeted at researchers, scientists, and drug development professionals, it explores foundational concepts of abiotic and biotic stress signaling. The content details practical workflows for genomics, transcriptomics, proteomics, and metabolomics integration, addressing common experimental challenges and data integration bottlenecks. Furthermore, it examines validation strategies and comparative analyses across plant models, highlighting translational insights for biomimetic compound discovery and enhancing crop resilience. The synthesis offers a roadmap for leveraging plant stress biology to inform biomedical innovation and sustainable agriculture.
Understanding Plant Stress Signaling: Core Pathways and Omics Discovery Targets
Plant stress response is a complex, multi-layered network of molecular and physiological changes. For researchers focused on plant stress response profiling using multi-omics approaches, a precise definition of core stressors is foundational. This technical guide delineates the primary abiotic (drought, salinity, temperature extremes) and biotic (pathogens) stressors, focusing on their physiological induction, key signaling components, and measurable parameters critical for designing integrated genomics, transcriptomics, proteomics, and metabolomics studies. The ultimate goal is to enable the identification of convergent and divergent response pathways for applications in crop engineering and agrochemical development.
Quantitative Characterization of Core Stressors
A systematic, quantifiable application of stress is vital for reproducible multi-omics experiments. The following parameters define standardized severity levels.
Table 1: Quantitative Parameters for Inducing Abiotic Stressors in Model Plants (e.g., Arabidopsis, Rice)
| Stressor | Key Induction Method | Primary Quantitative Metrics | Moderate Severity Level (for omics profiling) | Key Omics-Readout Targets |
|---|---|---|---|---|
| Drought | Controlled water withholding; PEG-infused agar/hydroponics | Soil Water Content (SWC %, gravimetric), Leaf Relative Water Content (RWC %), Pot Weight | RWC = 60-70% (Severe: <50%) | Proline, ABA, dehydrins, ROS markers, stomatal conductance |
| Salinity | Hydroponic or soil drench with NaCl solution | Soil/Medium Electrical Conductivity (dS/m), Na⁺/K⁺ ratio in shoot tissue | 100-150 mM NaCl for 7-14 days (Varies by species) | Ion transporters (SOS1, NHX), glycine betaine, compatible solutes |
| Heat Stress | Growth chamber/phyto-tron with elevated temperature | Temperature (°C), Duration, Plant Thermography | 38-42°C for 2-6 hours (Acute) | Heat Shock Proteins (HSP70, HSP90), membrane stability |
| Cold Stress (Chilling/Freezing) | Growth chamber with low temperature | Temperature (°C), Duration, Freezing tolerance (LT₅₀) | 4°C (Chilling) / -3 to -5°C (Freezing, with acclimation) | CBF/DREB transcription factors, antifreeze proteins, sugar content |
Table 2: Characterization of Biotic Stressor: Pathogens
| Pathogen Type | Example | Primary Infection Method | Key Plant Recognition System | Quantitative Inoculation for Assays |
|---|---|---|---|---|
| Biotrophic Fungi | Blumeria graminis (powdery mildew) | Conidia spray on leaves | Plasma Membrane PRRs (e.g., RLPs) | 1-5 x 10⁵ conidia/mL, assessed by fungal structures/cm² |
| Necrotrophic Fungi | Botrytis cinerea (grey mold) | Droplet inoculation with mycelial spores | Often via Damage-Associated Molecular Patterns (DAMPs) | 5 µL drop of 5x10⁵ spores/mL, lesion diameter (mm) at 72hpi |
| Hemibiotrophic Bacteria | Pseudomonas syringae pv. tomato | Syringe infiltration or spray | Intracellular NLRs (e.g., R proteins) | OD₆₀₀=0.002-0.2 (≈10⁶-10⁸ CFU/mL), CFU count per leaf disc |
| Virus | Tobacco Mosaic Virus (TMV) | Mechanical rubbing with abrasive | R gene-mediated (e.g., N gene) | 1:10 dilution of infected sap in inoculation buffer |
Experimental Protocols for Stress Application and Sampling
Protocol 1: Progressive Drought Stress for Time-Series Omics
- Objective: To induce a reproducible, gradual drought stress for transcriptomic (RNA-seq) and metabolomic profiling.
- Materials: Genetically uniform plants (pots with standardized soil mix), controlled growth chamber, precision balance, soil moisture probes.
- Procedure:
- Grow plants to desired stage (e.g., 4-week-old Arabidopsis). Water to full field capacity and weigh pots (record as saturated weight).
- Withhold water. Weigh pots daily. Calculate Relative Soil Water Content (RSWC) as: [(Daily Weight - Dry Pot Weight) / (Saturated Weight - Dry Pot Weight)] * 100.
- At target RSWC thresholds (e.g., 80%, 60%, 40%), harvest leaf tissue from designated plants (n≥5). Flash-freeze in liquid N₂ immediately.
- Sample control (well-watered, RSWC >85%) plants in parallel.
- Record physiological data: leaf RWC, stomatal conductance, photosynthetic rate.
Protocol 2: Salinity Stress Induction in Hydroponic System
- Objective: To apply uniform ionic stress for ionomics and proteomics studies.
- Materials: Hydroponic setup (aerated nutrient solution), full-strength Hoagland's solution, NaCl, pH/EC meter.
- Procedure:
- Pre-culture plants in hydroponics for 2 weeks.
- For treatment group, add NaCl to nutrient solution incrementally (e.g., 50 mM per 12 hours) to final target concentration (e.g., 150 mM) to avoid osmotic shock. Maintain control solution at 0 mM NaCl.
- Monitor and adjust solution pH to 5.8 daily. Measure EC daily.
- Harvest shoot and root tissues separately after 7 and 14 days of full-strength treatment. Rinse roots briefly in deionized water to remove apoplastic ions.
- Tissues are processed for ion content analysis (ICP-MS) and protein extraction.
Protocol 3: Pathogen Inoculation for Biotic Stress Transcriptomics
- Objective: To generate a synchronized infection for time-course RNA-seq analysis of plant immune response.
- Pathogen: Pseudomonas syringae pv. tomato DC3000 (AvrRpt2).
- Procedure:
- Grow bacteria overnight in King's B medium with appropriate antibiotics. Centrifuge, wash, and resuspend in 10 mM MgCl₂.
- Adjust suspension to OD₆₀₀ = 0.002 (≈1x10⁶ CFU/mL) for a moderate, compatible interaction.
- Using a needleless syringe, infiltrate the bacterial suspension into the abaxial side of 3-4 leaves per plant. Infiltrate control leaves with 10 mM MgCl₂.
- Harvest leaf discs from the infiltrated area at 0, 2, 6, 12, and 24 hours post-infection (hpi). Immediately freeze in liquid N₂.
- Validate infection by plating dilution series of ground leaf samples on selective media to determine in planta bacterial growth (CFU/cm²).
Signaling Pathways: A Multi-Omics Integration View
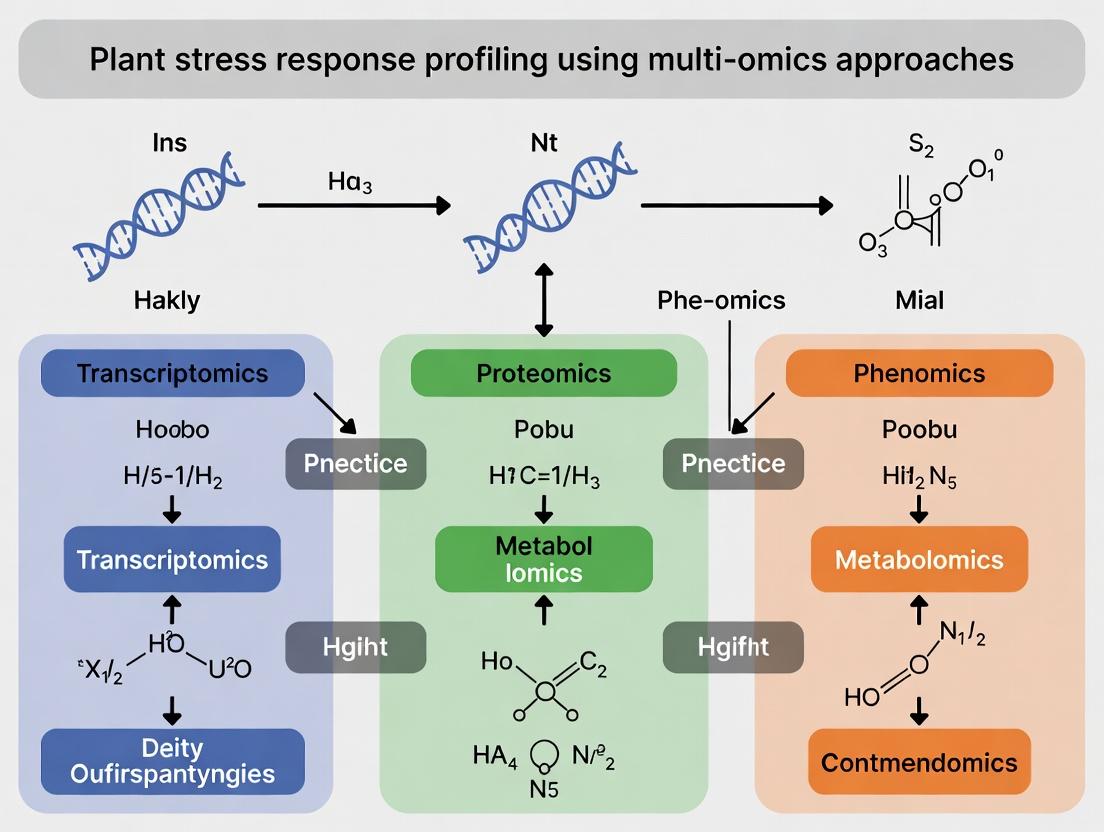
Multi-Omics Workflow for Stress Response Profiling
The Scientist's Toolkit: Key Research Reagent Solutions
Table 3: Essential Reagents and Kits for Plant Stress Multi-Omics Research
| Reagent/Kits | Function in Stress Research | Example Vendor/Product |
|---|---|---|
| ABA ELISA Kit | Quantifies endogenous abscisic acid levels, a central drought/stress hormone. Critical for phenotyping stress severity. | Agrisera, MyBioSource, Phytodetek |
| H₂DCFDA / Amplex Red | Cell-permeable fluorescent dyes for measuring reactive oxygen species (ROS) accumulation in tissues, a key early stress response. | Thermo Fisher Scientific, Sigma-Aldrich |
| LC-MS Grade Solvents & Derivatization Kits | Essential for high-resolution mass spectrometry-based metabolomics and lipidomics (e.g., methoxyamination and silylation for GC-MS). | Fisher Chemical, MilliporeSigma, Macherey-Nagel |
| RNeasy Plant Mini Kit (with DNase) | High-quality total RNA extraction, crucial for RNA-seq and qRT-PCR of stress-responsive genes. | Qiagen |
| TriZol/Plant TriZol Reagent | Simultaneous extraction of RNA, DNA, and proteins from a single sample for integrated multi-omics analysis. | Thermo Fisher Scientific |
| Phosphatase/Protease Inhibitor Cocktails | Preserve the native phosphoproteome and proteome during tissue homogenization and protein extraction for phosphoproteomics. | Roche, Thermo Fisher Scientific |
| Next-Generation Sequencing Library Prep Kits | Preparation of strand-specific RNA-seq, sRNA-seq, or Chip-seq libraries from plant stress samples. | Illumina (TruSeq), NEB (NEBNext) |
| Pathogen-Specific Culture Media & Antibiotics | For consistent cultivation and preparation of inoculum for biotic stress assays (e.g., King's B for Pseudomonas). | BD Diagnostics, Sigma-Aldrich |
| PEG 8000 | High molecular weight polyethylene glycol for simulating controlled osmotic/drought stress in hydroponic or agar cultures. | Sigma-Aldrich |
| Ion-Selective Electrodes/ICP-MS Standards | For precise measurement of ion fluxes (Na⁺, K⁺, Ca²⁺, Cl⁻) in salinity and ion toxicity studies. | Thermo Fisher Scientific, Agilent |
Within the framework of plant stress response profiling using multi-omics approaches, understanding the crosstalk between salicylic acid (SA), jasmonic acid (JA), and abscisic acid (ABA) signaling networks is paramount. This technical guide details the core components, regulatory mechanisms, and experimental paradigms for studying these critical hormonal pathways, which orchestrate plant defenses against biotic and abiotic stresses.
Plants deploy a sophisticated array of phytohormone-driven signaling networks to perceive and respond to environmental challenges. The SA, JA, and ABA pathways represent three central pillars of this adaptive system. SA primarily mediates responses to biotrophic pathogens, JA to necrotrophs and herbivores, and ABA to abiotic stresses like drought and salinity. Their signaling is highly interconnected, forming a complex web that determines the ultimate phenotypic outcome. Profiling these networks through transcriptomics, proteomics, and metabolomics is essential for decoding plant stress resilience.
Core Pathway Architecture and Molecular Mechanisms
Salicylic Acid (SA) Signaling Pathway
SA biosynthesis occurs primarily via the isochorismate synthase (ICS) pathway in chloroplasts. The key regulator NPR1 (Nonexpressor of Pathogenesis-Related genes 1) is central to SA signaling. Under low SA, NPR1 exists as an oligomer in the cytosol. SA accumulation triggers thioredoxin-mediated reduction, allowing NPR1 monomers to translocate to the nucleus. There, they interact with TGA transcription factors to induce expression of PR genes and systemic acquired resistance (SAR).
Jasmonic Acid (JA) Signaling Pathway
JA-isoleucine (JA-Ile) is the active form, perceived by the COI1-JAZ co-receptor complex. In the absence of JA-Ile, JAZ proteins repress transcription factors like MYC2. JA-Ile binding promotes COI1-dependent JAZ ubiquitination and 26S proteasome degradation, de-repressing MYC2 and activating defense responses against necrotrophic pathogens and insects.
Abscisic Acid (ABA) Signaling Pathway
ABA is a central regulator of abiotic stress. Core signaling involves the PYR/PYL/RCAR family of receptors. Under high ABA, these receptors bind ABA and inhibit PP2C phosphatases (e.g., ABI1), releasing SnRK2 kinases (e.g., SnRK2.6). Activated SnRK2s phosphorylate downstream targets like AREB/ABF transcription factors and ion channels, leading to stomatal closure and stress-responsive gene expression.
Pathway Crosstalk and Integration Nodes
Crosstalk is a defining feature, often mediated by key integrative nodes:
- NPR1: Acts as a switch between SA and JA pathways; SA-mediated activation of NPR1 can suppress JA signaling.
- MYC2: A major integration point, activated by JA but repressed by ABA, fine-tuning responses between biotic and abiotic stress.
- MPK4: A MAP kinase that negatively regulates SA biosynthesis and positively regulates JA responses.
- ABA and SA/JA Antagonism: ABA often suppresses SA- and JA-mediated defenses, prioritizing abiotic stress responses.
Table 1: Characteristic Marker Genes and Induction Dynamics
| Hormone Pathway | Key Marker Genes | Typical Induction Fold-Change (qPCR) | Time to Peak Expression Post-Induction |
|---|---|---|---|
| Salicylic Acid | PR1, PR2, ICS1 | 50-200x | 24-48 hours |
| Jasmonic Acid | VSP2, LOX2, PDF1.2 | 20-100x | 6-12 hours |
| Abscisic Acid | RD29B, RAB18, NCED3 | 10-50x | 1-3 hours |
Table 2: Hormonal Crosstalk Effects on Defense Output
| Primary Hormone | Modulating Hormone | Effect on Defense Output (Typical) | Key Mediator Protein |
|---|---|---|---|
| JA | SA | Antagonistic Suppression (~70% reduction in JA marker expression) | NPR1 |
| SA | JA | Antagonistic Suppression (~60% reduction in SA marker expression) | TGAs, JAZs |
| ABA | SA/JA | Antagonistic Suppression (40-80% reduction) | OST1/SnRK2.6, MYC2 |
| JA/ABA | Mutual Antagonism | Context-dependent inhibition | MYC2, ABFs |
Experimental Protocols for Multi-Omics Profiling
Protocol: Time-Series Hormone Treatment and Transcriptomic Analysis (RNA-seq)
Purpose: To profile genome-wide transcriptional changes in response to SA, JA, or ABA. Materials: Arabidopsis thaliana (Col-0) seedlings, 100µM SA (sodium salicylate), 50µM MeJA (methyl jasmonate), 50µM ABA, TRIzol reagent, RNA-seq library prep kit. Procedure:
- Grow 10-day-old seedlings on ½ MS media under controlled conditions.
- Treat by spraying with hormone solution or mock control (0.1% ethanol). Collect tissue at 0, 1, 3, 6, 12, and 24h post-treatment (n=3 biological replicates).
- Flash-freeze in liquid N₂, grind, and extract total RNA using TRIzol.
- Assess RNA integrity (RIN > 8.0). Prepare stranded mRNA-seq libraries.
- Sequence on Illumina platform (30M paired-end 150bp reads per sample).
- Align reads to reference genome (TAIR10) using HISAT2. Perform differential expression analysis with DESeq2 (FDR < 0.05, log2FC > 1).
- Perform Gene Ontology (GO) and pathway enrichment (KEGG) analysis.
Protocol: Targeted Hormone Metabolomics (LC-MS/MS)
Purpose: To quantify endogenous levels of SA, JA, JA-Ile, and ABA. Materials: Liquid N₂, cold methanol:water:formic acid (80:19:1, v/v/v), deuterated internal standards (d₄-SA, d₆-ABA, d₆-JA-Ile), C18 solid-phase extraction columns, UHPLC-MS/MS system. Procedure:
- Homogenize 100mg fresh plant tissue in liquid N₂.
- Extract with 1mL cold extraction solvent spiked with internal standards, vortex, and centrifuge (14,000g, 15min, 4°C).
- Pass supernatant through a C18 SPE column for clean-up.
- Dry eluent under N₂ gas, reconstitute in 100µL 30% methanol.
- Inject onto a reverse-phase UHPLC column (C18, 1.7µm, 2.1x100mm). Elute with gradient of water (0.1% formic acid) and acetonitrile.
- Analyze by tandem MS using Multiple Reaction Monitoring (MRM) in negative ion mode. Quantify using standard curves corrected with internal standards.
Protocol: Protein-Protein Interaction Assay (Co-Immunoprecipitation - Co-IP)
Purpose: To validate interactions between signaling components (e.g., COI1-JAZ, PYL-PP2C). Materials: Transgenic plants expressing GFP-tagged protein (e.g., JAZ-GFP), anti-GFP magnetic beads, cross-linking agent (DTBP), lysis buffer, mass spectrometry or immunoblotting setup. Procedure:
- Treat 2-week-old seedlings with hormone or mock for 30min.
- For cross-linking, incubate tissue with 2mM DTBP for 30min, quench with 20mM Tris.
- Lyse tissue in non-denaturing lysis buffer. Centrifuge to clear lysate.
- Incubate supernatant with anti-GFP magnetic beads for 2h at 4°C.
- Wash beads 4 times with lysis buffer. Elute proteins with 2x Laemmli buffer (for WB) or low pH glycine buffer (for MS).
- Analyze by Western blot using antibodies against proteins of interest (e.g., anti-COI1, anti-MYC) or by LC-MS/MS for interactome identification.
Visualization of Signaling Networks and Workflows
Diagram 1: Core SA, JA, and ABA Signaling Pathways
Diagram 2: Multi-Omics Workflow for Stress Response Profiling
Diagram 3: Key Crosstalk Nodes in SA, JA, ABA Networks
The Scientist's Toolkit: Essential Research Reagents and Materials
Table 3: Key Research Reagent Solutions for Hormonal Pathway Analysis
| Reagent/Material | Function/Application | Key Provider Examples |
|---|---|---|
| Sodium Salicylate (SA) | SA pathway agonist; induces PR gene expression and SAR. | Sigma-Aldrich, Cayman Chemical |
| Methyl Jasmonate (MeJA) | Volatile JA analog; induces JA-responsive defense genes. | Sigma-Aldrich, Tokyo Chemical Industry |
| (±)-Abscisic Acid (ABA) | ABA pathway agonist; induces stomatal closure and stress genes. | Sigma-Aldrich, Gold Biotechnology |
| Coronatine | High-affinity JA-Ile mimic; used to study JA signaling and pathogenesis. | Sigma-Aldrich, Coronalite |
| d₄-Salicylic Acid, d₆-ABA, d₆-JA-Ile | Deuterated internal standards for accurate hormone quantification via LC-MS/MS. | OlChemIm, CDN Isotopes |
| Anti-NPR1, Anti-COI1, Anti-MYC2 Antibodies | For protein detection, localization (immunofluorescence), and Co-IP. | Agrisera, PhytoAB |
| Arabidopsis Mutants: npr1-1, coi1-1, aba2-1 | Genetic tools to dissect specific hormone functions and crosstalk. | ABRC, NASC |
| TRIzol Reagent | For high-yield, high-quality total RNA isolation for transcriptomics. | Thermo Fisher Scientific |
| GFP-Trap Magnetic Beads | For affinity purification of GFP-tagged fusion proteins and interactors in Co-IP. | ChromoTek |
| SYBR Green PCR Master Mix | For qRT-PCR validation of hormone-responsive marker gene expression. | Thermo Fisher, Bio-Rad |
Integrative analysis of SA, JA, and ABA networks through multi-omics profiling is revolutionizing our understanding of plant stress phenotyping. The future lies in developing sophisticated computational models that can predict signaling outcomes from multi-layered omics datasets. This will accelerate the identification of key regulatory hubs amenable to biotechnological or pharmaceutical intervention, with applications in sustainable agriculture and novel plant-derived therapeutic discovery.
1. Introduction: ROS in the Context of Plant Stress Response
Reactive Oxygen Species (ROS), including superoxide anion (O₂•⁻), hydrogen peroxide (H₂O₂), and hydroxyl radical (•OH), are central to plant stress biology. Historically viewed as cytotoxic byproducts of aerobic metabolism, they are now recognized as essential secondary messengers that orchestrate systemic stress responses. Within the paradigm of plant stress response profiling using multi-omics approaches, ROS function as dynamic hubs, integrating signals from the transcriptome, proteome, and metabolome to modulate acclimation, programmed cell death, and systemic signaling.
2. The Dual Nature of ROS: Quantifying Damage vs. Signaling
The cellular concentration of ROS determines its role. Below the signaling threshold, ROS participate in redox signaling; above it, oxidative damage occurs. Key quantitative metrics are summarized below.
Table 1: Threshold Concentrations and Half-lives of Major ROS Species
| ROS Species | Typical Signaling Concentration (nM) | Cytotoxic Concentration (µM) | Approximate Half-life | Primary Production Site |
|---|---|---|---|---|
| O₂•⁻ | 0.1-1 | >10 | 1 µs | Chloroplast PSI/PSII, Apoplast |
| H₂O₂ | 10-100 | >1000 | 1 ms | Chloroplast, Peroxisome |
| •OH | Not a signal; always damaging | N/A | 1 ns | Fenton reaction (Cell wall) |
Table 2: Key Markers of ROS-Dependent Damage vs. Signaling
| Parameter | Damage Marker (Oxidative Stress) | Signaling Marker (Redox Signaling) | Assay Method |
|---|---|---|---|
| Lipid Peroxidation | High MDA (Malondialdehyde) content (>5 nmol/g FW) | Localized, controlled peroxidation | TBARS assay, HPLC |
| Protein Carbonylation | Widespread carbonylation (>5 nmol/mg protein) | Specific, reversible modifications (e.g., disulfide bridges) | DNPH immunoassay, 2D gel |
| Transcriptional Response | Uncontrolled induction of general stress genes | Precise induction of RBOHD, GST, APX2, ZAT12 | qRT-PCR, RNA-seq |
3. Experimental Protocols for ROS Detection and Quantification
Protocol 3.1: In situ Histochemical Detection of H₂O₂ and O₂•⁻
- Principle: Use of chromogenic substrates that form insoluble precipitates upon reaction with specific ROS.
- Reagents:
- DAB (3,3'-Diaminobenzidine) for H₂O₂: 1 mg/mL DAB in Tris-HCl buffer (pH 6.5). Infiltrate leaf tissue under vacuum for 15 min, incubate in dark for 8 hours. H₂O₂ polymerizes DAB to a brown precipitate.
- NBT (Nitro Blue Tetrazolium) for O₂•⁻: 0.5 mg/mL NBT in 10 mM potassium phosphate buffer (pH 7.8). Infiltrate and incubate as above. O₂•⁻ reduces NBT to a dark blue formazan precipitate.
- Analysis: Destain in boiling ethanol (96%) and quantify staining intensity via image analysis software (e.g., ImageJ).
Protocol 3.2: Quantification of H₂O₂ using Amplex Red Fluorescence Assay
- Principle: In the presence of horseradish peroxidase (HRP), H₂O₂ reacts with Amplex Red to generate fluorescent resorufin.
- Procedure:
- Grind 100 mg leaf tissue in 1 mL of 20 mM sodium phosphate buffer (pH 6.5) on ice.
- Centrifuge at 12,000 g for 15 min at 4°C.
- Prepare reaction mix: 50 µM Amplex Red, 0.1 U/mL HRP in 50 mM sodium phosphate buffer (pH 7.4).
- Mix 50 µL supernatant with 50 µL reaction mix in a black 96-well plate.
- Incubate for 30 min in the dark, measure fluorescence (excitation/emission: 530/590 nm).
- Calculation: Generate a standard curve with known H₂O₂ concentrations (0-10 µM).
Protocol 3.3: ROS Burst Assay in Plant Immunity
- Principle: Real-time measurement of extracellular ROS (oxidative burst) following pathogen-associated molecular pattern (PAMP) perception.
- Procedure:
- Excise leaf discs (4 mm diameter) from 4-5 week-old plants (e.g., Arabidopsis).
- Float discs, abaxial side down, in 200 µL of white 96-well plate containing assay solution: 20 µM L-012 (chemiluminescent probe) or 20 µM luminol + 10 µg/mL HRP, in water.
- Equilibrate for 1 hour in the dark.
- Add elicitor (e.g., 1 µM flg22) using an injector in a luminescence plate reader.
- Record luminescence every 2 minutes for 90-120 minutes.
4. ROS Signaling Pathways in Plant Stress
Diagram Title: Core ROS Signaling Network in Plants
5. Integration with Multi-Omics Profiling Workflow
Diagram Title: ROS-Centric Multi-Omics Integration Workflow
6. The Scientist's Toolkit: Key Research Reagent Solutions
Table 3: Essential Reagents for ROS Research in Plant Stress
| Reagent/Category | Example Product/Kit | Primary Function in ROS Research |
|---|---|---|
| Fluorescent/Luminescent Probes | H2DCFDA (General ROS), Amplex Red (H₂O₂), MitoSOX Red (Mitochondrial O₂•⁻) | Sensitive, quantitative detection of specific ROS in vivo or in extracts. |
| Genetically Encoded Biosensors | roGFP2-Orp1 (H₂O₂), HyPer (H₂O₂), pHyPer (pH-stable H₂O₂) | Real-time, subcellular resolution imaging of ROS dynamics in living plants. |
| ROS Scavengers & Modulators | DPI (RBOH inhibitor), Catalase (H₂O₂ scavenger), Tiron (O₂•⁻ scavenger) | Chemical/genetic tools to manipulate ROS levels to establish causality. |
| Antibodies for Oxidative Modifications | Anti-nitrotyrosine, Anti-malondialdehyde (MDA), Anti-4-hydroxynonenal (4-HNE) | Detection and quantification of oxidative damage markers (protein nitrosylation, lipid peroxidation). |
| Redox Proteomics Kits | ICAT (Isotope-Coded Affinity Tag), Oxidized Cysteine Resin Affinity Capture | Enrichment and identification of redox-sensitive proteins and modification sites. |
| qRT-PCR Assays | Pre-validated primer sets for RBOHD, APX1/2, FSD1, CAT2, ZAT12, GSTU24 | High-throughput validation of transcriptional responses to ROS signaling. |
7. Conclusion
ROS are indispensable components of the plant stress interactome, acting as universal stress messengers that link perception to multi-omics-level responses. Precise spatiotemporal quantification and manipulation of ROS, integrated with transcriptomic, proteomic, and metabolomic data, are essential for constructing predictive models of plant stress acclimation. This systems-level understanding is critical for developing strategies to enhance crop resilience through targeted engineering of ROS signaling networks.
The Central Role of Transcription Factors (e.g., MYB, NAC, WRKY) in Stress Reprogramming
Within the paradigm of plant stress response profiling using multi-omics approaches, transcription factors (TFs) are the master regulators that decode stress signals into genome-wide transcriptional reprogramming. Families such as MYB, NAC, and WRKY are pivotal integrators, orchestrating complex gene expression networks that determine phenotypic outcomes to abiotic and biotic stressors. This technical guide delineates their central role, the molecular mechanisms of action, and the methodologies for their study, providing a framework for researchers and drug development professionals aiming to engineer stress-resilient systems.
Molecular Mechanisms and Regulatory Networks
MYB Transcription Factors
MYB TFs, characterized by a conserved MYB DNA-binding domain, are critical responders to drought, salinity, and cold. They often function early in signaling cascades, binding to cis-elements (e.g., MBSI, MBSII) in promoters of stress-responsive genes involved in osmolyte biosynthesis, stomatal closure, and antioxidant defense.
NAC Transcription Factors
NAC TFs possess a conserved N-terminal NAC domain. They are central hubs in dehydration, salinity, and senescence responses. Key members like ANAC019 and RD26 activate cascades for water conservation, root architecture modification, and reactive oxygen species (ROS) scavenging by binding to NAC recognition sequences (NACRS).
WRKY Transcription Factors
WRKY TFs, defined by the WRKYGQK motif, are primarily engaged in biotic stress and SA/JA signaling but also modulate abiotic stress. They exhibit auto-regulation and cross-regulation, binding to W-box elements to control genes for pathogenesis-related (PR) proteins, detoxification, and hormonal cross-talk.
Integrative Crosstalk and Hierarchical Regulation
These TF families do not operate in isolation. They engage in extensive crosstalk, forming hierarchical and cooperative networks. For instance, a NAC TF may induce a MYB TF, which then co-regulates a suite of effector genes with a WRKY protein, enabling signal amplification and precision.
Diagram 1: Core Stress Signaling Pathway Involving MYB, NAC, WRKY
Quantitative Data from Multi-Omics Studies
Recent multi-omics studies (integrated transcriptomics, proteomics, metabolomics) quantify the impact of these TFs. The table below summarizes key expression and regulatory data.
Table 1: Quantitative Profiling of TF-Mediated Stress Responses
| TF Family | Exemplar Gene | Stress Condition | Fold Change (Transcript) | # of Predicted Target Genes | Key Regulated Pathway(s) | Multi-Omics Validation |
|---|---|---|---|---|---|---|
| MYB | AtMYB96 | Drought | +12.5 | ~350 | Cuticular Wax Biosynthesis, ABA Signaling | RNA-seq, LC-MS (Wax) |
| MYB | OsMYB2 | Salt | +8.7 | ~220 | Proline Metabolism, Ion Homeostasis | ChIP-seq, Metabolomics |
| NAC | TaNAC2 | Drought & Cold | +15.2 (D), +9.8 (C) | >500 | Senescence, ROS Detoxification | RNA-seq, H2O2 Assay |
| NAC | OsSNAC1 | Drought | +20.1 | ~410 | Stomatal Closure, Root Growth | RNAi Phenotype, Hormone Profiling |
| WRKY | AtWRKY53 | Pathogen | +18.3 | ~290 | SA/JA Defense, Hypersensitive Response | ChIP-qPCR, Proteomics |
| WRKY | GsWRKY20 | Alkaline | +11.4 | ~180 | pH Homeostasis, Ion Transport | Yeast-1-Hybrid, Ionomics |
Core Experimental Protocols
Protocol: Chromatin Immunoprecipitation Sequencing (ChIP-seq) for TF Target Identification
Objective: Genome-wide identification of DNA sequences bound by a specific TF under stress. Key Steps:
- Cross-linking: Treat plant tissue (e.g., stress vs. control) with 1% formaldehyde.
- Nuclei Isolation & Chromatin Shearing: Isolate nuclei, lyse, and sonicate chromatin to ~200-500 bp fragments.
- Immunoprecipitation: Incubate with antibody specific to the TF of interest (e.g., anti-MYB). Use Protein A/G beads.
- Reverse Cross-linking & Purification: Elute bound DNA, reverse cross-links, and purify DNA.
- Library Prep & Sequencing: Prepare sequencing library (end repair, A-tailing, adapter ligation) and perform high-throughput sequencing.
- Data Analysis: Map reads to reference genome, call peaks (MACS2), and annotate peaks to nearest genes.
Protocol: Co-Expression Network Analysis Using RNA-seq Data
Objective: Infer regulatory networks involving MYB/NAC/WRKY TFs. Key Steps:
- RNA-seq: Generate transcriptome data from diverse stress/time-point samples (minimum n=3 per condition).
- Differential Expression: Align reads (HISAT2), quantify (StringTie), and identify DE genes (DESeq2, edgeR).
- Network Construction: Calculate pairwise correlation metrics (e.g., WGCNA) for all DE genes.
- Module Identification: Cluster genes into co-expression modules. Identify hub genes (high connectivity).
- TF Enrichment: Overlay TF expression data to identify TFs (MYB/NAC/WRKY) as key drivers ("regulatory hubs") of specific modules.
- Validation: Correlate with ChIP-seq data or perform TF knockout/overexpression followed by RNA-seq.
Diagram 2: Multi-Omics Workflow for TF Network Analysis
The Scientist's Toolkit: Key Research Reagent Solutions
Table 2: Essential Reagents and Tools for Studying Stress-Related TFs
| Item Name | Category | Function / Application | Example Product/Source |
|---|---|---|---|
| TF-Specific Antibodies | Antibody | For ChIP, western blot, and localization of endogenous MYB/NAC/WRKY proteins. | Anti-MYB96 (Agrisera), Anti-WRKY (PhytoAB) |
| Phusion High-Fidelity DNA Polymerase | Enzyme | High-fidelity PCR for cloning TF genes and constructing vectors. | Thermo Scientific |
| Gateway Cloning System | Molecular Cloning | Rapid recombination-based cloning for overexpression/RNAi vector construction. | Invitrogen |
| pEarlyGate or pB2GW7 Vectors | Plasmid | Plant binary vectors for Agrobacterium-mediated transformation (OE or CRISPR). | Addgene, ABRC |
| Magnetic Protein A/G Beads | Beads | For immunoprecipitation in ChIP and Co-IP experiments. | Pierce, Dynabeads |
| SYBR Green qPCR Master Mix | Assay Kit | Quantitative RT-PCR to validate TF and target gene expression. | Applied Biosystems |
| Dual-Luciferase Reporter Assay System | Assay Kit | Measure TF transcriptional activity on promoter of target gene in planta. | Promega |
| Plant Total RNA Extraction Kit | Isolation Kit | High-quality RNA isolation for RNA-seq and RT-qPCR. | RNeasy Plant Mini Kit (Qiagen) |
| ChIP-seq Grade Proteinase K | Enzyme | Critical for efficient reversal of cross-links in ChIP protocols. | New England Biolabs |
| WGCNA R Package | Software/Bioinformatics | Construct weighted gene co-expression network to identify TF hubs. | CRAN Repository |
The Conceptual Framework in Plant Stress Response
Plant stress response is a complex, multi-layered phenotypic outcome orchestrated by intricate interactions between genomic, transcriptomic, proteomic, metabolomic, and phenomic layers. The central paradigm is that genotype (G) interacts with environment (E) to produce phenotype (P): P = G + E + (G×E). Multi-omics deconvolutes this equation by systematically profiling each molecular layer, enabling the reconstruction of signaling cascades from stress perception to physiological adaptation.
Core Omics Layers and Their Interrelationships
Each omics layer provides a distinct but interconnected view of the plant system. The following table summarizes the core technologies, outputs, and their contributions to understanding stress response.
Table 1: Core Omics Technologies in Plant Stress Research
| Omics Layer | Key Technologies | Primary Output | Role in Stress Response Profiling |
|---|---|---|---|
| Genomics | Whole Genome Sequencing, GWAS, SNP arrays | DNA sequence variants, structural variations | Identifies alleles and regulatory elements associated with stress tolerance (e.g., drought-resistance haplotypes). |
| Epigenomics | ChIP-seq, WGBS, ATAC-seq | DNA methylation, histone modifications, chromatin accessibility | Reveals dynamic, heritable regulatory changes (e.g., hypermethylation of transposons under heat stress). |
| Transcriptomics | RNA-seq, single-cell RNA-seq | Gene expression levels, splice variants | Quantifies rapid transcriptional reprogramming in response to stress signals (e.g., upregulation of DREB2A). |
| Proteomics | LC-MS/MS, TMT/iTRAQ labeling | Protein identification, abundance, PTMs | Captifies the functional effectors and post-translational regulation (e.g., phosphorylation of MAP kinases). |
| Metabolomics | GC-MS, LC-MS, NMR | Metabolite identification and quantification | Reflects the biochemical endpoint of stress adaptation (e.g., accumulation of proline, ABA, ROS scavengers). |
| Phenomics | High-throughput imaging, sensors | Morphological and physiological traits | Quantifies ultimate phenotypic outcomes (e.g., stomatal conductance, biomass, root architecture). |
Key Experimental Protocols for Integrated Multi-Omics
A robust multi-omics study requires careful experimental design, sample preparation, and data integration. Below are detailed protocols for a typical study profiling Arabidopsis thaliana under osmotic stress.
Integrated Sample Preparation Workflow
Protocol: Concurrent Biomolecule Extraction for Multi-Omics (Modified TRIzol-Based Method)
- Objective: To isolate DNA, RNA, proteins, and metabolites from the same tissue sample to minimize biological variation.
- Materials: Liquid N₂, pre-cooled mortar and pestle, TRIzol reagent, chloroform, isopropanol, ethanol, Qiagen AllPrep kit columns, methanol, water.
- Steps:
- Tissue Harvest & Homogenization: Flash-freeze 100 mg of leaf tissue in liquid N₂. Grind to a fine powder. Transfer powder to a tube containing 1 mL TRIzol. Vortex vigorously.
- Phase Separation: Incubate 5 min at RT. Add 0.2 mL chloroform, shake vigorously, incubate 2-3 min. Centrifuge at 12,000 × g, 15 min, 4°C. The mixture separates into: a) organic phase (proteins/lipids), b) interphase (DNA), c) aqueous phase (RNA).
- RNA Recovery: Transfer aqueous phase to a new tube. Precipitate RNA with 0.5 mL isopropanol. Wash pellet with 75% ethanol. Dissolve in nuclease-free water. Assess quality (RIN > 8.0 on Bioanalyzer).
- DNA Recovery: Re-extract the interphase and organic phase with 0.3 mL 100% ethanol. Centrifuge. Apply supernatant to an AllPrep DNA column. Wash and elute genomic DNA.
- Protein Recovery: Precipitate proteins from the phenol-ethanol supernatant with isopropanol. Wash pellet three times in guanidine HCl/ethanol. Resuspend in urea buffer for LC-MS/MS.
- Metabolite Recovery: Aliquot a separate portion of the initial tissue powder. Extract with 80% methanol/water at -20°C. Dry under nitrogen and reconstitute for LC-MS.
Protocol for Multi-Omics Data Acquisition
Table 2: Representative Data Acquisition Parameters
| Omics Layer | Platform | Key Settings | Data Output per Sample |
|---|---|---|---|
| Genomics | Illumina NovaSeq | 150 bp paired-end, 30x coverage | ~90 Gb FASTQ data |
| Transcriptomics | Illumina NextSeq | 75 bp single-end, 25-30 million reads | ~4 Gb FASTQ data |
| Proteomics | Q-Exactive HF-X LC-MS/MS | 120 min gradient, DDA/Top20, 60k resolution | ~2 GB raw .raw files |
| Metabolomics | QTOF LC-MS (RP & HILIC) | ESI +/- mode, 50-1000 m/z, MSe acquisition | ~1.5 GB .d files |
Data Integration and Pathway Analysis
The power of multi-omics lies in integrated analysis. Co-expression networks (WGCNA), multivariate statistics (PCA, PLS-DA), and pathway mapping tools (KEGG, PlantCyc) are used to fuse datasets.
Diagram 1: Multi-Omics Integration Workflow for Plant Stress
Diagram 2: Core ABA-Mediated Drought Stress Signaling Pathway
The Scientist's Toolkit: Essential Research Reagent Solutions
Table 3: Key Reagents and Kits for Plant Multi-Omics Research
| Item Name (Supplier Example) | Category | Primary Function in Multi-Omics Workflow |
|---|---|---|
| TRIzol Reagent (Invitrogen) | Nucleic Acid/Protein Isolation | Simultaneous isolation of RNA, DNA, and proteins from a single sample, crucial for reducing batch effects. |
| RNeasy Plant Mini Kit (Qiagen) | RNA Isolation | High-quality, DNase-treated total RNA extraction for transcriptomics (RNA-seq). |
| AllPrep DNA/RNA/Protein Mini Kit (Qiagen) | Integrated Isolation | Column-based concurrent isolation of genomic DNA, total RNA, and proteins from one lysate. |
| Plant Total Protein Extraction Kit (Millipore) | Protein Isolation | Optimized buffers for complete plant protein solubilization, removing interfering compounds. |
| Mass Spectrometry Grade Trypsin/Lys-C (Promega) | Proteomics Sample Prep | Enzymatic digestion of proteins into peptides for LC-MS/MS analysis. |
| TMTpro 16plex Label Reagents (Thermo Fisher) | Proteomics Multiplexing | Isobaric labeling for multiplexed quantitative proteomics across 16 samples in one MS run. |
| HILICamide Column (Waters) | Metabolomics Separation | Chromatographic separation of polar metabolites for comprehensive LC-MS-based metabolomics. |
| PCR-Free DNA Library Prep Kit (Illumina) | Genomics Library Prep | Prevents sequencing bias in whole genome sequencing, especially in GC-rich plant genomes. |
| TruSeq Stranded mRNA Kit (Illumina) | Transcriptomics Library Prep | Poly-A selection and strand-specific library construction for mRNA-seq. |
| Droplet Digital PCR Supermix (Bio-Rad) | Target Validation | Absolute quantification of candidate genes or splice variants identified from omics data. |
Integrated Multi-Omics Workflows: From Experimental Design to Data Generation
Within the broader thesis on Plant stress response profiling using multi-omics approaches, rigorous experimental design is the critical foundation for generating robust, biologically relevant data. Stress studies present unique challenges due to the dynamic, dose-dependent nature of biological responses. This guide details best practices for designing time-course, dosage, and replication strategies to maximize the validity of omics-based discoveries in plant stress biology.
Core Experimental Design Principles
Defining the Stress Treatment: Dosage Gradients
The selection of stressor dosage must reflect both realistic environmental conditions and the need to capture a full response spectrum. A single, high-dose treatment risks masking subtle signaling events and adaptive mechanisms.
Table 1: Exemplary Dosage Ranges for Common Abiotic Stressors in Arabidopsis thaliana
| Stressor | Low Dose | Medium Dose | High Dose | Typical Application Method | Key Physiological Readout |
|---|---|---|---|---|---|
| Drought | -0.5 MPa soil Ψ | -1.2 MPa soil Ψ | -2.0 MPa soil Ψ | PEG-8000 solution or controlled soil drying | Relative Water Content (RWC), Stomatal Conductance |
| Salinity | 50 mM NaCl | 150 mM NaCl | 300 mM NaCl | Hydroponic solution or soil drench | Shoot Na+/K+ ratio, Chlorophyll content |
| Heat | 32°C / 4h | 37°C / 4h | 42°C / 2h | Growth chamber adjustment | Electrolyte Leakage, HSP expression (qPCR) |
| Cold | 10°C / 24h | 4°C / 24h | 0°C / 24h | Growth chamber adjustment | Fv/Fm (Photosystem II efficiency) |
Protocol 1: Establishing a Soil Water Potential Gradient for Drought Stress
- Plant Preparation: Grow plants in uniform, individual pots with standardized soil volume and bulk density.
- Water Saturation: Fully saturate all pots, allow to drain, and record saturated weight (Ws).
- Drought Induction: Withhold water. The target soil water potential (Ψ) is calculated based on the soil moisture release curve.
- Daily Monitoring: Weigh pots daily. Soil water content (θ) = (Current Weight - Dry Pot Weight) / (Ws - Dry Pot Weight).
- Treatment Application: Assign plants to treatment groups when θ reaches pre-calculated thresholds corresponding to target Ψ values (e.g., -0.5, -1.2, -2.0 MPa). Control plants are maintained at 80-90% of field capacity (θFC).
- Tissue Harvest: Harvest leaf/root tissue at defined time points, flash-freeze in liquid N₂, and store at -80°C for omics analysis.
Capturing Dynamics: Time-Course Design
Stress responses are temporal cascades. Omics profiling must capture the transition from early signaling to acute response and long-term adaptation.
Table 2: Recommended Time-Course Sampling for Multi-Omics Integration
| Phase | Example Time Points (Post-Stress Onset) | Primary Omics Focus | Rationale |
|---|---|---|---|
| Early Signaling | 5 min, 15 min, 30 min, 1 h, 2 h | Phosphoproteomics, Metabolomics (e.g., phytohormones), RNA-seq | Capture rapid post-translational modifications & signaling metabolites. |
| Acute Response | 6 h, 12 h, 24 h, 48 h | RNA-seq, Proteomics, Metabolomics | Gene expression reprogramming & protein synthesis. |
| Acclimation/ Adaptation | 3 d, 5 d, 7 d, 10 d | Proteomics, Metabolomics, Phenomics | Steady-state physiological adjustment. |
Protocol 2: Synchronized Stress Application for Time-Course Experiments
- Synchronization: Grow plants under tightly controlled conditions to minimize developmental variance. Use a photoperiod-controlled growth chamber.
- Stressor Initiation: For chemical stressors (e.g., NaCl), apply at the start of the light cycle via root drench to all treatment plants simultaneously. For physical stressors (e.g., heat), program chamber ramp to target temperature over <15 minutes.
- Randomized Harvest: At each pre-defined time point, harvest tissue from randomly selected plants across control and treatment groups. Include a "Time Zero" (T0) harvest immediately before stress application.
- Replication: Each time point must have independent biological replicates (see Section 1.3).
- Sample Processing: Process all samples identically. For RNA-seq, use instant freezing and RNA stabilizers.
Ensuring Robustness: Replication and Randomization
Inadequate replication is a primary source of false discoveries in omics studies. Biological replicates (distinct individuals) are non-negotiable; technical replicates (repeated measurements of the same sample) assess assay precision.
Table 3: Replication Guidelines for Plant Stress Omics Studies
| Experiment Type | Minimum Biological Replicates | Recommended Biological Replicates | Randomization Requirement |
|---|---|---|---|
| Pilot / Dose-Finding | 4-5 per group | 6-8 per group | Complete randomization of pot positions. |
| Full Time-Course Omics (e.g., RNA-seq) | 4 independent plants per time point per condition | 6-8 independent plants per time point per condition | Split-plot design: Time as main plot, treatment as sub-plot. Randomize harvest order. |
| Validation (qPCR, Assays) | 5-6 | 8-12 | Samples from independent experiment. |
Protocol 3: Implementing a Randomized Block Design for a Greenhouse Study
- Define Blocks: Divide the greenhouse bench into homogeneous blocks (e.g., 4 blocks) accounting for known gradients (light, temperature).
- Randomize Within Blocks: Within each block, randomly assign pot positions to all experimental units (e.g., Control, Dose 1, Dose 2, Dose 3). Use a random number generator.
- Apply Treatments: Apply stress treatments according to the randomized layout.
- Harvest by Block: At harvest, process all plants within one block completely before moving to the next, to confound block effect with processing time.
- Record Metadata: Document exact positions, harvest times, and any deviations.
Multi-Omics Integration Workflow
Diagram 1: Multi-Omics Workflow for Plant Stress Studies
Key Signaling Pathways in Plant Stress Response
Diagram 2: Generalized Plant Abiotic Stress Signaling Cascade
The Scientist's Toolkit: Research Reagent Solutions
Table 4: Essential Reagents and Kits for Plant Stress Omics Studies
| Item | Function in Stress Studies | Example Product/Supplier |
|---|---|---|
| PEG-8000 | Osmoticum to induce controlled drought stress by lowering soil/medium water potential. | Sigma-Aldrich, 8.41702 |
| RNA Stabilization Solution | Preserves RNA integrity immediately upon harvest for accurate transcriptomics. | Qiagen RNAlater, Invitrogen RNALater |
| LC-MS Grade Solvents | Essential for high-sensitivity, reproducible metabolomics and proteomics. | Fisher Optima LC/MS, Honeywell CHROMASOLV |
| Phytohormone Standards | Quantitative analysis of stress signaling molecules (ABA, JA, SA, etc.) via LC-MS/MS. | OlChemIm, Sigma-Aldrich |
| Protein Extraction Buffer (Urea/Thiourea) | Efficient extraction of total plant protein for downstream proteomics. | Bio-Rad ReadyPrep, or in-house formulation. |
| Derivatization Reagents for GC-MS | Chemical modification of metabolites for volatile compound analysis in metabolomics. | MilliporeSigma MSTFA, Thermo Sci TMCS |
| DNeasy/RNEasy Plant Kits | Reliable, high-quality nucleic acid isolation from tough plant tissues. | Qiagen |
| PCR Arrays for Stress Pathways | Rapid profiling of key stress-responsive genes for validation. | Qiagen RT² Profiler, Bio-Rad PrimePCR |
| ELISA Kits for Stress Markers | Quantification of specific proteins (e.g., HSPs, antioxidant enzymes). | Agrisera, Phytodetek |
| Live/Dead Cell Viability Assays | Assess membrane integrity and cell death post-stress (e.g., Evans Blue, PI staining). | Thermo Fisher Scientific |
This whitepaper details a core methodological pillar within the broader thesis: Plant Stress Response Profiling Using Multi-Omics Approaches. The integration of genomic and epigenomic analyses is fundamental for dissecting the molecular mechanisms of abiotic and biotic stress adaptation. Identifying stress-responsive alleles and correlating them with dynamic methylation patterns provides a systems-level understanding of heritable phenotypic plasticity, a critical factor for developing resilient crops and informing therapeutic strategies in plant-derived drug development.
Core Experimental Framework: A Multi-Omics Workflow
The identification process requires a parallel and integrated analysis of genetic variation and DNA methylation changes in control versus stressed plant cohorts.
Diagram Title: Integrated Genomics & Epigenomics Analysis Workflow
Detailed Methodologies for Key Experiments
Identification of Stress-Responsive Alleles via Population Genomics
Protocol: Genome-Wide Association Study (GWAS) for Stress Phenotypes
- Plant Population & Stress: Utilize a diverse panel of 300+ Arabidopsis thaliana or crop accessions. Apply controlled drought stress (withholding water to achieve ~50% soil field capacity) or salinity stress (150mM NaCl solution) for 14 days. A matched control cohort is maintained under optimal conditions.
- Phenotyping: Quantify physiological traits (e.g., relative water content, chlorophyll fluorescence, shoot biomass) and molecular traits (transcript levels of key stress genes via RT-qPCR).
- Genotyping: Extract genomic DNA using a CTAB-based protocol. Prepare libraries for WGS (30x coverage) or use a high-density SNP array. Align reads to a reference genome (e.g., TAIR10 for Arabidopsis) using BWA-MEM.
- Variant Calling: Process alignments with GATK Best Practices pipeline (MarkDuplicates, BaseRecalibrator, HaplotypeCaller). Filter variants (QUAL > 30, DP > 10).
- Association Analysis: Perform GWAS using a mixed linear model (e.g., in GEMMA or TASSEL) accounting for population structure (Q matrix) and kinship (K matrix). Use a Benjamini-Hochberg corrected p-value threshold (FDR < 0.05).
Profiling of Stress-Responsive Methylation Patterns
Protocol: Whole Genome Bisulfite Sequencing (WGBS)
- Bisulfite Conversion: Treat 200ng of high-integrity genomic DNA (from stressed and control tissues) using the EZ DNA Methylation-Lightning Kit. This converts unmethylated cytosines to uracil, while methylated cytosines remain unchanged.
- Library Preparation & Sequencing: Construct sequencing libraries from converted DNA using a post-bisulfite adapter tagging method. Sequence on an Illumina NovaSeq platform to achieve >20x coverage of the genome.
- Bioinformatic Processing: Trim adapters with Trim Galore! Align reads to a bisulfite-converted reference genome using Bismark. Deduplicate aligned reads.
- DMR Calling: Extract methylation calls (percent methylation per cytosine context: CG, CHG, CHH). Use DSS or methylKit to identify DMRs between stress and control groups (threshold: difference in methylation > 25%, Fisher's exact test p-value < 0.01).
Data Integration & Signaling Pathway Analysis
Integrated analysis identifies cis-regulatory links where genetic variation influences methylation (methylation Quantitative Trait Loci - mQTLs) or where methylation alters gene expression in response to stress.
Diagram Title: Genetic & Epigenetic Crosstalk in Stress Signaling
Table 1: Example Output from a Combined GWAS-mQTL Analysis in Drought-Stressed Arabidopsis
| Genomic Locus | Lead SNP | Associated Trait (p-value) | Nearby Gene | DMR Context | Methylation Change (Stress vs. Control) | Integrated Annotation |
|---|---|---|---|---|---|---|
| Chr1: 5,234,567 | rs12345 | Leaf Wilting Score (3.2e-08) | AT1G12340 (NAC TF) | Promoter, CG | -32% (Hypomethylation) | mQTL; Hypomethylation correlates with increased NAC expression. |
| Chr3: 12,345,678 | rs67890 | Root Biomass (1.5e-06) | AT3G45670 (ABA biosynth.) | Gene Body, CHG | +18% (Hypermethylation) | Allele-specific methylation; Hypermethylation linked to reduced ABA synthesis. |
| Chr5: 9,876,543 | rs54321 | Stomatal Conductance (4.7e-07) | AT5G98760 (RD29A) | Intergenic, CHH | -40% (Hypomethylation) | DMR is a putative enhancer; allele variant affects transcription factor binding affinity. |
Table 2: Common Epigenomic Marks and Their Interpretations in Plant Stress
| Mark | Assay | Typical Genomic Location | Functional Implication in Stress Response |
|---|---|---|---|
| CG Methylation | WGBS, BS-PCR | Gene promoters, gene bodies | Promoter hypermethylation: often repressive. Gene body methylation: often permissive for transcription. |
| CHH Methylation | WGBS, BS-PCR | Transposable elements, flanking regions | RNA-directed DNA methylation (RdDM) pathway; crucial for TE silencing under stress. |
| H3K4me3 | ChIP-seq | Transcription start sites | Active transcription mark; increases at induced stress-responsive genes. |
| H3K27me3 | ChIP-seq | Gene bodies | Polycomb-mediated repression; can silence stress-antagonistic genes. |
The Scientist's Toolkit: Research Reagent Solutions
| Item (Supplier Examples) | Function in Experiment |
|---|---|
| CTAB DNA Extraction Buffer (Homemade or commercial kits) | Effectively isolates high-molecular-weight, contaminant-free DNA from polysaccharide-rich plant tissue, essential for WGS and WGBS. |
| EZ DNA Methylation-Lightning Kit (Zymo Research) | Efficient and reliable sodium bisulfite conversion of DNA, the critical first step for all bisulfite sequencing-based methylation analyses. |
| NEBNext Ultra II DNA Library Prep Kit (New England Biolabs) | Robust library preparation for high-throughput sequencing, adaptable for both standard WGS and post-bisulfite converted DNA. |
| Illumina DNA PCR-Free Library Prep (Illumina) | For standard WGS, avoids PCR bias, providing a more accurate representation of genomic variants and copy number. |
| Anti-5-methylcytosine Antibody (Diagenode, Eurogentec) | Used for methylated DNA immunoprecipitation (MeDIP) as a validation or intermediate-resolution alternative to WGBS. |
| Methylation-Sensitive Restriction Enzymes (e.g., HpaII, NotI) (NEB) | For locus-specific validation of methylation status via PCR or qPCR (MSAP, PCR-based assays). |
| Droplet Digital PCR (ddPCR) Master Mix (Bio-Rad) | Allows absolute quantification of allele-specific expression or methylation ratios with high precision for validating integrated omics targets. |
| CRISPR-Cas9 Plant Editing System (ToolGen, custom gRNA design) | For functional validation of candidate stress-responsive alleles or methylation-editing (via dCas9-DRM2 fusions) to confirm causality. |
This technical guide, framed within a broader thesis on plant stress response profiling using multi-omics approaches, details the application of RNA sequencing (RNA-seq) for capturing dynamic transcriptional reprogramming under abiotic and biotic stress. RNA-seq provides a quantitative, high-resolution view of gene expression changes, splicing variants, and novel transcript discovery, forming a critical component of integrated systems biology analyses.
Understanding plant stress adaptation requires integration of data across molecular layers. Transcriptomics via RNA-seq acts as the central link between genomic information (DNA), proteomic output, and metabolic phenotype. It identifies key regulatory genes and pathways activated during stress, guiding subsequent functional genomics and metabolic engineering.
Core Experimental Workflow & Protocol
Sample Preparation and Experimental Design
- Stress Treatment: Apply a controlled, time-course stress (e.g., drought, salinity, pathogen infection) alongside untreated controls. Biological replication (n≥3) is critical for statistical power.
- Tissue Harvest & Stabilization: Rapidly harvest tissue at multiple time points (e.g., 0h, 1h, 6h, 24h, 72h) and immediately freeze in liquid nitrogen. Use RNase-free reagents.
- Total RNA Extraction:
- Protocol: Use TRIzol or column-based kits (e.g., RNeasy Plant Mini Kit). Include an on-column DNase I digestion step.
- Quality Control (QC): Assess RNA Integrity Number (RIN) using Agilent Bioanalyzer (RIN > 8.0 required). Verify purity via Nanodrop (A260/A280 ≈ 2.0, A260/A230 > 2.0).
Library Construction for mRNA-seq
Detailed Protocol for Poly-A Selection Based Library Prep:
- mRNA Enrichment: Isolate polyadenylated mRNA using oligo(dT) magnetic beads.
- Fragmentation: Chemically or enzymatically fragment mRNA (200-300 bp target).
- cDNA Synthesis: Perform first-strand synthesis using reverse transcriptase and random hexamers, followed by second-strand synthesis with DNA Polymerase I/RNase H.
- End Repair & A-Tailing: Create blunt-ended fragments, then add a single 'A' nucleotide to 3' ends.
- Adapter Ligation: Ligate indexed sequencing adapters with compatible 'T' overhang.
- Library Amplification: Perform 10-12 cycles of PCR to enrich adapter-ligated fragments.
- Final QC: Quantify library using qPCR (e.g., Kapa Library Quant Kit) and validate size distribution on Bioanalyzer.
Sequencing
- Platform: Illumina NovaSeq 6000 or NextSeq 2000 for high-throughput.
- Configuration: Paired-end (PE) 150 bp sequencing is standard, providing sufficient depth and accuracy for expression quantification and isoform analysis.
- Depth: Aim for 20-40 million read pairs per sample for standard differential expression analysis in plants with complex genomes.
Data Analysis Pipeline
The primary computational workflow transforms raw sequencing reads into interpretable biological insights.
Diagram 1: RNA-seq Core Data Analysis Workflow
Key Signaling Pathways Revealed by RNA-seq in Plant Stress
RNA-seq commonly uncovers the dynamics of several conserved stress-response pathways.
Abiotic Stress (e.g., Drought/Salinity) Signaling
Diagram 2: Core Abiotic Stress Signaling Pathway
Biotic Stress (e.g., Pathogen) Signaling
Diagram 3: PAMP-Triggered Immunity Pathway
Quantitative Data from Representative Studies
Table 1: Example RNA-seq Data from a Time-Course Drought Stress Study in Arabidopsis thaliana
| Time Point (Hours Post-Stress) | Number of Differentially Expressed Genes (DEGs) (Adj. p < 0.05) | Up-regulated DEGs | Down-regulated DEGs | Key Enriched Pathway (KEGG) |
|---|---|---|---|---|
| 1h | 450 | 210 | 240 | MAPK signaling pathway |
| 6h | 2,850 | 1,620 | 1,230 | Plant hormone signal transduction |
| 24h | 4,120 | 2,450 | 1,670 | Phenylpropanoid biosynthesis |
| 72h | 5,300 | 3,100 | 2,200 | Starch and sucrose metabolism |
Table 2: Comparison of Sequencing Statistics Across Stress Types
| Parameter | Abiotic Stress (Drought) | Biotic Stress (Fungal Pathogen) |
|---|---|---|
| Average Reads per Sample | 35 million PE | 40 million PE |
| Alignment Rate | 92-95% | 85-90%* |
| Typical Total DEGs | 3,000 - 6,000 | 5,000 - 10,000 |
| % DEGs as Transcription Factors | 8-12% | 10-15% |
| Commonly Enriched GO Term | Response to abscisic acid; Oxidation-reduction process | Defense response; Salicylic acid metabolic process |
*Lower alignment rate often due to non-host reads from the pathogen.
The Scientist's Toolkit: Essential Research Reagents & Solutions
Table 3: Key Reagents for Plant RNA-seq Experiments
| Item | Function & Rationale |
|---|---|
| RNase Inhibitors (e.g., Recombinant RNasin) | Crucial for preventing RNA degradation during all steps of extraction and library preparation. |
| Polymerase with High Fidelity (e.g., Q5 High-Fidelity DNA Polymerase) | Used in library amplification PCR to minimize sequencing errors and bias. |
| Dual Index UMI Adapters (e.g., IDT for Illumina) | Unique Molecular Identifiers (UMIs) enable accurate PCR duplicate removal, improving quantification. |
| Ribo-depletion Kits for plants (e.g., Ribo-Zero Plant) | Alternative to poly-A selection; removes rRNA to enrich for both coding and non-coding RNA, including poorly polyadenylated transcripts. |
| Strand-Specific Library Prep Kits | Preserves the strand information of the original RNA, crucial for identifying antisense transcription and accurately assigning reads to genes. |
| SPRIselect Beads (Beckman Coulter) | For size selection and clean-up during library prep; offers higher reproducibility than traditional gel-based methods. |
| Plant Stress Hormone ELISA Kits (for SA, JA, ABA) | Used for physiological validation of transcriptional responses observed in RNA-seq data. |
Within the framework of a thesis on Plant stress response profiling using multi-omics approaches, the systematic identification and quantification of proteins and their post-translational modifications (PTMs) is indispensable. Mass spectrometry (MS)-based proteomics provides the critical link between genomic potential and functional phenotype, revealing how PTMs like phosphorylation, ubiquitination, and glycosylation dynamically regulate plant signaling networks under abiotic and biotic stress.
Core Principles of MS-Based Proteomics
Modern proteomics relies on liquid chromatography-tandem mass spectrometry (LC-MS/MS). Proteins are enzymatically digested into peptides, which are separated by LC and ionized (typically via electrospray ionization). Mass analyzers measure the mass-to-charge (m/z) ratio of precursor ions and their fragments. Identification is achieved by comparing experimental MS/MS spectra to in silico generated spectra from protein sequence databases. Quantification strategies are broadly classified as label-free or label-based (e.g., TMT, SILAC).
Table 1: Common Quantitative Proteomics Strategies in Plant Stress Research
| Method | Principle | Multiplexing Capacity | Precision (Typical CV) | Key Application in Plant Stress Studies |
|---|---|---|---|---|
| Label-Free Quantification (LFQ) | Comparison of peptide peak intensities across runs | Unlimited (serial) | 15-30% | Discovery-phase profiling of time-series stress experiments |
| Tandem Mass Tags (TMT) | Isobaric tags fragment to yield reporter ions | 6-18 plex | 10-20% | Simultaneous comparison of multiple stress conditions/time points |
| Stable Isotope Labeling by Amino acids in Cell culture (SILAC) | Metabolic incorporation of heavy amino acids | 2-3 plex (plants) | 5-15% | Controlled studies in plant cell cultures |
| Data-Independent Acquisition (DIA) | Cyclic fragmentation of all ions in pre-defined m/z windows | Unlimited (serial) | 15-25% | Highly reproducible profiling of complex tissue samples |
Table 2: Common Stress-Related PTMs and Their MS Analysis
| PTM | Mass Shift (Da) | Enrichment Strategy | Key Role in Plant Stress Response |
|---|---|---|---|
| Phosphorylation (Ser/Thr/Tyr) | +79.966 | TiO₂, IMAC, MOAC | Signal transduction (e.g., MAPK cascades) |
| Ubiquitination (Gly-Lys remnant) | +114.043 | di-Gly-Lys immunoaffinity | Protein degradation, stress signaling |
| Acetylation (Lys) | +42.011 | Anti-acetyllysine antibodies | Regulation of metabolic enzymes & histones |
| S-Nitrosylation (Cys) | +28.990 (NO) | Biotin-switch technique | Redox signaling under oxidative stress |
Experimental Protocols
Protocol 1: TMT-Based Quantitative Phosphoproteomics of Drought-Stressed Plant Leaves
Objective: To quantify changes in protein phosphorylation in Arabidopsis thaliana leaves under progressive drought stress.
Materials: See "The Scientist's Toolkit" below. Procedure:
- Sample Preparation: Harvest leaf tissue from control and drought-stressed plants (3 biological replicates each). Flash-freeze in liquid N₂. Homogenize tissue in urea-based lysis buffer (8 M urea, 50 mM Tris-HCl pH 8.0, 1x protease/phosphatase inhibitors) on ice.
- Protein Digestion: Reduce with 5 mM DTT (30 min, RT), alkylate with 15 mM iodoacetamide (30 min, RT in dark). Dilute urea to <2 M with 50 mM Tris-HCl. Digest with Lys-C (1:100 w/w, 2h, RT) followed by trypsin (1:50 w/w, overnight, RT). Acidify with TFA to pH <3.
- Peptide Clean-up: Desalt using C₁₈ solid-phase extraction cartridges. Dry peptides in a vacuum concentrator.
- Phosphopeptide Enrichment: Reconstitute peptides in loading buffer (80% ACN, 6% TFA). Incubate with TiO₂ beads (1:4 peptide:bead ratio) for 30 min with rotation. Wash beads sequentially with 80% ACN/6% TFA, 80% ACN/1% TFA, and 20% ACN/0.1% TFA. Elute phosphopeptides with 10% NH₄OH.
- TMT Labeling: Reconstitute enriched phosphopeptides in 50 mM HEPES pH 8.5. Label each 6-plex TMT reagent channel with a different condition (e.g., TMT-126: Control-1, TMT-127: Control-2, TMT-128: Control-3, TMT-129: Drought-1, TMT-130: Drought-2, TMT-131: Drought-3) for 1h at RT. Quench reaction with 5% hydroxylamine. Pool all labeled samples.
- LC-MS/MS Analysis: Fractionate pooled sample using high-pH reversed-phase chromatography. Analyze fractions on a Q Exactive HF or Orbitrap Fusion Lumos mass spectrometer coupled to a nanoLC system. Acquire MS1 at 120,000 resolution, MS2 (HCD fragmentation) at 50,000 resolution.
- Data Processing: Search data (e.g., using MaxQuant, Proteome Discoverer) against the Arabidopsis TAIR database. Enable TMT-6plex and phosphorylation (S,T,Y) as variable modifications. Use PTM localization algorithms (e.g., PTM-Score). Normalize data and perform statistical analysis (ANOVA) to identify significantly altered phosphosites.
Protocol 2: Label-Free DIA Analysis of Heat Shock Response
Objective: Comprehensive protein quantification in rice seedlings under acute heat shock. Procedure:
- Digestion: Prepare tryptic digests from control (22°C) and heat-shocked (42°C, 2h) seedlings (n=5) as in Protocol 1, steps 1-3, without enrichment.
- Spectral Library Generation: Create a project-specific library by analyzing a pooled sample using data-dependent acquisition (DDA) with high-resolution MS/MS.
- DIA Acquisition: Inject 1 µg of each individual sample. Acquire DIA MS scans with 24-32 variable-width m/z windows covering 400-1000 m/z. Use high-resolution MS1 (60,000) and MS2 (30,000) scans.
- DIA Analysis: Process using Spectronaut, DIA-NN, or Skyline. Match DIA spectra against the spectral library for identification and extract peptide peak areas for label-free quantification.
Visualization of Workflows and Pathways
TMT Phosphoproteomics Experimental Pipeline
Plant Stress Signaling with Key PTMs
The Scientist's Toolkit
Table 3: Key Research Reagent Solutions for Plant Stress Proteomics
| Item | Function & Rationale | Example Product/Kit |
|---|---|---|
| Urea Lysis Buffer | Efficient denaturation and solubilization of plant proteins, including membrane proteins, while inhibiting proteases/phosphatases. | 8 M Urea, 50 mM Tris-HCl, pH 8.0 |
| Protease/Phosphatase Inhibitor Cocktail | Preserves the native PTM state by preventing degradation and dephosphorylation during extraction. | Thermo Scientific Halt or compatible plant-specific cocktails. |
| Sequence-Grade Modified Trypsin | Highly pure protease for specific, reproducible digestion at lysine and arginine residues. | Promega Trypsin Gold, MS-grade |
| TMTpro 18-plex Kit | Isobaric labeling reagents for multiplexed quantification of up to 18 samples simultaneously, maximizing throughput. | Thermo Scientific TMTpro 18plex |
| TiO₂ Phosphopeptide Enrichment Beads | Selective binding of phosphate groups under acidic conditions for global phosphoproteome analysis. | GL Sciences Titansphere TiO₂ |
| C₁₈ StageTips | Low-cost, in-house packed micro-columns for efficient peptide desalting and clean-up prior to MS. | Empore C18 disks |
| High-pH Reversed-Phase Fractionation Kit | Offline peptide fractionation to reduce complexity and increase proteome coverage. | Pierce High pH Reversed-Phase Peptide Fractionation Kit |
| Spectral Library for DIA | Project-specific curated library of peptide spectra essential for accurate DIA data analysis. | Generated in-house via DDA or available from repositories like Panorama Public. |
This technical guide details the metabolomics component within a broader thesis research framework focused on Plant Stress Response Profiling Using Multi-Omics Approaches. Metabolomics provides the functional readout of cellular activity, integrating the effects of genomics, transcriptomics, and proteomics. Profiling both primary (e.g., sugars, amino acids, organic acids) and secondary (e.g., phenolics, alkaloids, terpenoids) stress metabolites via LC-MS and GC-MS is critical for understanding plant adaptation mechanisms. This guide provides current methodologies, data interpretation, and integration strategies essential for researchers and drug development professionals investigating plant-derived compounds or stress resilience.
Core Analytical Platforms: LC-MS vs. GC-MS
The choice between Liquid Chromatography-Mass Spectrometry (LC-MS) and Gas Chromatography-Mass Spectrometry (GC-MS) is dictated by metabolite physicochemical properties.
- LC-MS (Typically Reverse-Phase or HILIC): Ideal for thermally labile, non-volatile, and high molecular weight metabolites. This includes most secondary metabolites (flavonoids, glycosides) and polar primary metabolites (phosphorylated sugars, nucleotides). Modern high-resolution accurate mass (HRAM) instruments (Orbitrap, Q-TOF) enable untargeted profiling.
- GC-MS (After Derivatization): Excellent for volatile compounds or those made volatile via derivatization (e.g., silylation). It provides highly reproducible retention times and robust spectral libraries for identifying primary metabolites (organic acids, sugars, amino acids, TCA cycle intermediates).
Table 1: Platform Comparison for Stress Metabolite Profiling
| Feature | LC-MS (HRAM) | GC-MS (Quadrupole or TOF) |
|---|---|---|
| Optimal Metabolite Class | Secondary metabolites, lipids, polar primaries | Volatiles, derivatized primaries (sugars, acids) |
| Sample Prep Complexity | Medium (extraction, dilution) | High (extraction, derivatization) |
| Throughput | Moderate-High | High |
| Identification Basis | Accurate mass, MS/MS, libraries | Retention index, electron impact spectra libraries |
| Quantification | Semi-quantitative (standards needed for absolute) | Semi-to-absolute with class-specific standards |
| Key Strength | Broad, untargeted discovery of complex species | Highly reproducible, quantitative for core metabolome |
Detailed Experimental Protocols
Unified Metabolite Extraction for Multi-Omics
A sequential or biphasic extraction can yield metabolites for both LC-MS and GC-MS while preserving macromolecules for other omics layers.
Protocol: Methanol:Water:Chloroform Extraction for Multi-Omics Integration
- Tissue Harvest & Quenching: Snap-freeze plant tissue (≤100 mg FW) in liquid N₂. Homogenize with a bead mill pre-cooled with liquid N₂.
- Extraction: Add 1 mL of pre-chilled (-20°C) extraction solvent (40:40:20, MeOH:Water:CHCl₃ with 0.1% formic acid) per 50 mg powder.
- Partitioning: Vortex vigorously for 30 sec, sonicate on ice for 15 min, centrifuge at 16,000×g, 15 min, 4°C.
- Phase Separation: Transfer upper polar phase (LC-MS for secondary/polar primaries). Evaporate a 200 µL aliquot of this phase for GC-MS derivatization. The lower organic phase (lipids) and interphase pellet (proteins/RNA) can be saved.
- Storage: Dry polar extracts under vacuum or nitrogen. Store at -80°C until analysis.
Targeted GC-MS Profiling of Primary Metabolites
Derivatization Protocol (MOX + MSTFA):
- Oximation: Reconstitute dried polar extract in 50 µL of 20 mg/mL methoxyamine hydrochloride in pyridine. Incubate at 37°C for 90 min with shaking.
- Silylation: Add 100 µL of N-Methyl-N-(trimethylsilyl)trifluoroacetamide (MSTFA). Incubate at 37°C for 30 min.
- Analysis: Inject 1 µL in split or splitless mode on a DB-5MS column. Use a temperature gradient (70°C to 320°C). Acquire data in full-scan mode (m/z 50-600).
Untargeted LC-MS Profiling of Secondary Metabolites
RP-LC-MS/MS Method:
- Reconstitution: Dissolve dried extract in 100 µL initial mobile phase (e.g., 95% H₂O, 5% ACN, 0.1% Formic Acid).
- Chromatography: Use a C18 column (e.g., 2.1 x 150 mm, 1.7 µm). Gradient: 5% B to 95% B (ACN with 0.1% FA) over 25 min. Flow: 0.3 mL/min.
- Mass Spectrometry: Operate in data-dependent acquisition (DDA) mode on a Q-TOF or Orbitrap. Full scan (m/z 100-1500) at 70,000 resolution. Top 5 ions selected for MS/MS at 17,500 resolution. Use HCD collision energy stepping.
Data Processing & Integration Pathway
Diagram 1: Metabolomics workflow in multi-omics plant stress research. (Max width: 760px)
Key Signalling Pathways Linking Metabolite Shifts
Diagram 2: Stress-induced metabolic reprogramming pathway. (Max width: 760px)
The Scientist's Toolkit: Research Reagent Solutions
Table 2: Essential Reagents and Kits for Stress Metabolomics
| Item | Function & Rationale |
|---|---|
| Internal Standard Mix (ISTD) | Corrects for instrument variability. Use stable isotope-labeled compounds (e.g., ¹³C-succinate, D4-alanine) for targeted work; chemical analogs (e.g., chlorophenylalanine) for untargeted. |
| Derivatization Reagents | Methoxyamine HCl: Protects carbonyl groups. MSTFA/N-Methylbis(trifluoroacetamide) (MBTFA): Adds TMS groups to -OH, -COOH, -NH for GC-MS volatility. |
| Solid Phase Extraction (SPE) Cartridges | Clean-up and fractionate complex extracts (e.g., C18 for non-polar, HLB for broad-range, SCX for cations). Reduces ion suppression in LC-MS. |
| Sylon HTP Kit | Contains pyridine, MSTFA, and TMCS for high-throughput GC-MS derivatization in 96-well plates. |
| QC Pool Sample | A pooled aliquot of all study samples, injected repeatedly throughout the run to monitor LC/GC-MS system stability and for data normalization. |
| Retention Index Standards (GC) | Alkane series (C8-C40) for calculating Kovats Retention Index, critical for compound identification in GC-MS. |
| MS-Compatible Mobile Phase Additives | Ammonium formate/acetate: For positive/negative mode ESI. Trifluoroacetic acid (TFA): Use sparingly (can suppress ionization). Formic acid: Standard for positive mode. |
In plant stress response profiling, the integration of multi-omics data (genomics, transcriptomics, proteomics, metabolomics) is paramount for deciphering complex adaptive mechanisms. This technical guide details three core computational strategies—Correlation Networks, Pathway Mapping, and Multi-Layer Regulatory Models—that transform disparate, high-dimensional datasets into biologically interpretable systems-level insights. Framed within the thesis of elucidating plant resilience to abiotic and biotic stressors, these methodologies enable the transition from lists of differentially expressed molecules to predictive models of regulatory logic.
Correlation Networks for Multi-Omics Data Integration
Correlation networks are foundational for identifying coordinated changes across omics layers under stress conditions. They transform correlation matrices into graph structures where nodes represent molecular entities (e.g., genes, proteins, metabolites) and edges represent significant associations.
Core Methodology
- Data Preprocessing & Normalization: Each omics dataset is independently normalized (e.g., TPM for RNA-seq, log2 transformation for proteomics) and filtered for low-abundance entities. Batch effects are corrected using tools like ComBat.
- Correlation Calculation: Pairwise correlations (e.g., Pearson, Spearman, or distance-based measures like Mutual Information) are computed between all entities, often within and between omics layers.
- Network Inference & Thresholding: A significance threshold (p-value < 0.01, adjusted for multiple testing) and a correlation strength cutoff (e.g., |r| > 0.85) are applied to create an adjacency matrix. Weighted Correlation Network Analysis (WGCNA) is frequently used for transcriptomic data to identify modules of co-expressed genes.
- Network Analysis: The resulting graph is analyzed for topology using tools like Cytoscape or
igraphin R. Key metrics include degree centrality (hub identification), betweenness centrality (bottleneck identification), and module/cluster detection (e.g., via the Louvain algorithm).
Table 1: Key Metrics for Evaluating Correlation Network Topology in Plant Stress Studies
| Metric | Typical Range in Stress Studies | Biological Interpretation | Common Tool for Calculation |
|---|---|---|---|
| Average Node Degree | 5-15 | Overall connectivity of the molecular network; often increases under severe stress. | igraph::degree() |
| Network Diameter | 10-25 | Longest shortest path; indicates network compactness. | igraph::diameter() |
| Average Clustering Coefficient | 0.4-0.7 | Tendency of nodes to form clusters; high values indicate functional modularity. | igraph::transitivity() |
| Number of Modules | 10-50 (dataset-dependent) | Groups of highly interconnected nodes, often corresponding to distinct biological processes. | WGCNA, igraph::cluster_louvain() |
Experimental Protocol: Constructing a Multi-Omic Correlation Network
- Sample Collection: Harvest root and leaf tissue from Arabidopsis thaliana plants subjected to drought stress (withholding water for 7 days) and controls (n=6 biological replicates per group).
- Multi-Omics Profiling:
- Transcriptomics: Perform total RNA extraction, library prep, and Illumina sequencing (150bp paired-end). Map reads to TAIR10 genome using HISAT2. Quantify gene-level counts with StringTie.
- Metabolomics: Extract polar metabolites from flash-frozen tissue in 80% methanol. Analyze via LC-MS (Q-Exactive HF). Process raw data with XCMS for peak picking, alignment, and annotation against public libraries (e.g., PlantCyc).
- Data Integration: Use the
mixOmicsR package. For each tissue, create a data matrix where rows are samples and columns are features (gene expression levels + metabolite abundances). - Network Construction: Compute a sparse Partial Least Squares (sPLS) correlation network to model relationships between the two data types. Retain only the top 500 most connected features from each layer. Visualize in Cytoscape.
Visualization: Multi-Omics Correlation Network Workflow
Diagram Title: Workflow for Building a Multi-Omic Correlation Network
Pathway Mapping for Functional Interpretation
Pathway mapping places lists of stress-responsive molecules onto established biological pathways (e.g., KEGG, Reactome, PlantCyc) to identify activated or suppressed processes.
Core Methodology
- Over-Representation Analysis (ORA): Tests if genes/proteins from a significant set (e.g., differentially expressed genes) are enriched in predefined pathways more than by random chance. Uses Fisher's exact test.
- Gene Set Enrichment Analysis (GSEA): A rank-based method that uses all ranked genes (e.g., by log2 fold-change) to identify pathways where member genes cluster at the top or bottom of the list, indicating coordinated up/down-regulation.
- Pathway Topology-Aware Tools: Methods like SPIA (Signaling Pathway Impact Analysis) combine ORA with information on pathway structure (e.g., gene interactions) to compute a pathway perturbation score.
Table 2: Comparison of Pathway Analysis Methods for Plant Stress Omics Data
| Method | Input Required | Key Statistical Test | Advantage | Disadvantage | Common Software |
|---|---|---|---|---|---|
| ORA | A defined list of significant IDs (e.g., DEGs) | Fisher's Exact Test | Simple, intuitive, works with small gene sets. | Depends on arbitrary significance cutoff; ignores expression magnitude. | clusterProfiler, AgriGO |
| GSEA | A ranked list of all genes (e.g., by log2FC) | Kolmogorov-Smirnov Test | No arbitrary cutoff; detects subtle, coordinated changes. | Computationally intensive; requires many replicates for robust ranking. | GSEA software, clusterProfiler (GSEA function) |
| Topology-Based (SPIA) | A list of significant IDs with log2FC | Custom perturbation algorithm (bootstrapping) | Incorporates biological network structure. | Limited to pathways with well-curated topologies. | R package SPIA |
Experimental Protocol: GSEA for Drought Stress Transcriptomics
- Rank Gene List: Using the differential expression results from Section 2.2, rank all Arabidopsis genes by their signed statistic (e.g., -log10(p-value) * sign(log2FC)).
- Prepare Pathway Database: Download the most recent PlantCyc or KEGG pathway gene sets for A. thaliana from the MSigDB or using the
clusterProfilerR package'sdownload_KEGGfunction. - Run GSEA: Use the
gseKEGGfunction inclusterProfilerwith the ranked list and 10,000 permutations. Set a minimum gene set size of 10 and maximum of 500. - Interpret Results: Identify pathways with FDR q-value < 0.05. The Normalized Enrichment Score (NES) indicates the direction and strength of enrichment. Visualize leading-edge genes (core contributors) within key pathways like "Flavonoid biosynthesis" or "Plant hormone signal transduction."
Visualization: Integrative Pathway Mapping Workflow
Diagram Title: Three Approaches for Pathway Mapping Analysis
Multi-Layer Regulatory Models
Multi-layer regulatory models explicitly integrate prior knowledge (e.g., TF-DNA binding, protein-protein interactions) with multi-omics data to infer causal, directional relationships, moving beyond correlation.
Core Methodology
- Bayesian Networks (BN): Probabilistic graphical models that represent a set of variables (omics features) and their conditional dependencies via a directed acyclic graph (DAG). They can infer causality from observational data under constraints.
- Integrative Regulatory Networks: Tools like
iGRNorPANDAcombine TF binding motifs (from databases like CIS-BP or DAP-seq), protein-protein interaction networks (from STRING or BioGRID), and gene expression data to infer TF-target gene regulatory relationships. - Multi-Layer Perceptron/Deep Learning Models: Neural networks can model complex, non-linear relationships between, for example, genotype, TF activity, and phenotype, though they require large training datasets.
Table 3: Comparison of Multi-Layer Regulatory Modeling Approaches
| Approach | Data Layers Integrated | Key Algorithm | Output | Suitability for Plant Studies |
|---|---|---|---|---|
| Bayesian Network | Any (e.g., TF activity, miRNA, mRNA, metabolite) | Constraint-based (PC algorithm) or Score-based (BIC) learning | Directed Acyclic Graph (DAG) showing probabilistic dependencies. | Moderate; requires careful handling of continuous data and large sample size for stability. |
| Integrative (PANDA) | TF Motifs + PPI + Gene Expression | Message-passing to optimize network consensus | A regulatory network with edge weights for each TF-gene pair. | High; leverages prior knowledge which is increasingly available for model plants. |
| Deep Learning (MLP) | Multi-omics data + phenotype | Backpropagation, Gradient Descent | A predictive model linking input layers to an output (e.g., stress score). | Emerging; requires very large, high-quality datasets to avoid overfitting. |
Experimental Protocol: Constructing an Integrative TF Regulatory Network
- Gather Prior Knowledge Layers:
- TF-Target Prior: Obtain A. thaliana TF binding motifs from the CIS-BP database. Scan the promoter regions (-1000bp to +200bp from TSS) of all genes using FIMO (p-value < 1e-4) to create a binary prior matrix.
- PPI Prior: Download a high-confidence A. thaliana protein-protein interaction network from the STRING database (confidence score > 700).
- Prepare Expression Data: Use the normalized transcriptomics count matrix from the drought stress experiment (Section 2.2).
- Run PANDA: Use the
pypandaPython library. Input the expression data, TF prior matrix, and PPI matrix. The algorithm iteratively updates the regulatory network until convergence by passing messages between the three layers. - Analyze Results: The output is a gene-by-TF regulatory weight matrix. Filter for high-confidence edges (top 5% by weight). Identify key stress-responsive TFs (hubs) and their predicted target genes. Validate key edges using ChIP-qPCR or published literature.
Visualization: Multi-Layer Regulatory Model Integration
Diagram Title: Integration of Prior Knowledge and Omics Data for Regulatory Models
The Scientist's Toolkit: Research Reagent Solutions
Table 4: Essential Reagents and Tools for Plant Stress Multi-Omics Integration Studies
| Item / Reagent | Function in Research | Example Supplier / Tool |
|---|---|---|
| RNeasy Plant Mini Kit | High-quality total RNA extraction, essential for transcriptomics (RNA-seq). | Qiagen |
| Plant-specific LC-MS Metabolomics Standards | Internal standards for accurate quantification of plant metabolites (e.g., phytohormones, flavonoids). | Olchemim, Sigma-Aldrich |
| DAP-seq Services/Protocols | Genome-wide identification of transcription factor binding sites for creating prior knowledge networks. | Commercial providers (e.g., CD Genomics) or published protocols. |
| Phanta Max Super-Fidelity DNA Polymerase | High-fidelity PCR for cloning and validation of regulatory network predictions (e.g., promoter-reporter constructs). | Vazyme |
| Chromatin IP Kit (ChIP) | Validating TF-target interactions predicted by regulatory models. | Cell Signaling Technology, Abcam |
| clusterProfiler R/Bioconductor Package | Statistical analysis and visualization of functional profiles for genes and gene clusters (ORA & GSEA). | Bioconductor |
| Cytoscape with Omics Visualizer App | Open-source platform for visualizing complex molecular interaction networks and pathways. | Cytoscape Consortium |
| mixOmics R/Bioconductor Package | Multivariate analysis and integration of multiple omics datasets (e.g., sPLS, DIABLO). | Bioconductor |
| STRING Database | Repository of known and predicted protein-protein interactions, crucial for building prior network layers. | STRING consortium |
| PlantCyc Database | Curated database of plant metabolic pathways and enzymes. | Plant Metabolic Network |
Overcoming Challenges in Multi-Omics Studies: Technical Pitfalls and Data Analysis Solutions
Within the framework of plant stress response profiling using multi-omics approaches, achieving robust, reproducible, and biologically meaningful data is paramount. The integration of genomics, transcriptomics, proteomics, and metabolomics offers a systems-level view of plant adaptation. However, this powerful convergence is critically dependent on the quality and integrity of the starting biological material. This technical guide addresses three pervasive pre-analytical challenges—sample heterogeneity, metabolite stability, and protein extraction—that, if unmitigated, can compromise the validity of multi-omics integration and subsequent conclusions about plant stress mechanisms.
Sample Heterogeneity in Plant Tissues
Plant tissues are inherently heterogeneous, comprising multiple cell types (epidermal, mesophyll, vascular) each with distinct molecular profiles. Under stress conditions (e.g., drought, salinity, pathogen attack), responses are often localized and asynchronous, amplifying variability.
Quantitative Impact of Heterogeneity
Table 1: Variability in Key Analytes Due to Tissue Heterogeneity in *Arabidopsis thaliana Under Drought Stress*
| Analyte Class | Source of Heterogeneity | Reported Coefficient of Variation (CV) | Impact on Multi-Omics Integration |
|---|---|---|---|
| Transcripts | Cell-type specific expression | 25-40% (bulk RNA-seq) | Masks rare cell-type-specific stress markers; confounds correlation with proteomics. |
| Metabolites | Sub-cellular compartmentation | 30-50% (e.g., glutathione levels) | Misrepresents metabolic flux and redox state. |
| Proteins | Tissue region (e.g., leaf tip vs. base) | 20-35% (e.g., ROS-scavenging enzymes) | Obscures spatial protein localization patterns crucial for stress signaling. |
Protocol: Laser Capture Microdissection (LCM) for Homogenized Sampling
Objective: To isolate specific cell populations (e.g., guard cells, vascular tissue) from plant tissue sections for omics analysis.
- Tissue Preparation: Flash-freeze leaf/root tissue in liquid N₂. Embed in Optimal Cutting Temperature (OCT) compound.
- Cryosectioning: Cut 10-20 µm sections at -20°C and mount on PEN membrane glass slides. Rapidly stain (e.g., 0.1% toluidine blue, 30 sec) and dehydrate (70%, 95%, 100% ethanol, 30 sec each).
- Microdissection: Use a LCM system (e.g., ArcturusXT). Select target cells under microscope guidance. Apply laser to melt the membrane around the cells, capturing them onto a polymer cap.
- Collection: Extract RNA/DNA/protein/metabolites directly from the cap using minimized-volume kits (e.g., PicoPure for RNA). Proceed to library prep or analysis.
Diagram Title: Workflow for Reducing Sample Heterogeneity via Laser Capture Microdissection
Metabolite Stability and Degradation
Metabolites, especially those involved in stress responses (e.g., phytohormones, antioxidants, sugars), are highly dynamic and prone to rapid enzymatic turnover post-harvest.
Key Labile Metabolites in Plant Stress
Table 2: Stability Parameters of Key Stress-Responsive Metabolites
| Metabolite Class | Example Compounds | Half-life at Room Temp | Recommended Quenching Method | Storage Stability |
|---|---|---|---|---|
| Reactive Oxygen Species (ROS) | H₂O₂, O₂⁻ | Seconds to minutes | Direct freezing in LN₂; methanol/water -40°C | Unstable; analyze immediately |
| Phosphorylated Intermediates | ATP, Glucose-6-P | < 2 minutes | Microwave or LN₂ freeze-clamping | ≤ -80°C in organic extract |
| Jasmonates & Auxins | JA-Ile, IAA | 10-30 minutes | Immediate LN₂ submersion | -80°C in dry pellet; stable in organic extract |
| Glucosinolates | Sinigrin, Glucobrassicin | Hours | 70% hot methanol extraction | -20°C in extract for weeks |
Protocol: Metabolite Quenching and Extraction for LC-MS
Objective: To instantly halt metabolism and extract a broad spectrum of polar and semi-polar metabolites.
- Rapid Quenching: Pre-cool a stainless-steel mortar with liquid N₂. Submerge harvested plant tissue (<100 mg) directly into the mortar, grinding to a fine powder under continuous N₂. Do not let tissue thaw.
- Cold Solvent Extraction: Add 1 ml of extraction solvent (-20°C; Methanol:Water:Chloroform, 2.5:1:1, v/v/v with 1 µg/mL internal standards e.g., d4-succinate) to the powder. Homogenize with a pre-cooled pestle.
- Phase Separation: Transfer homogenate to a 2 mL tube. Vortex 10 min at 4°C. Centrifuge at 14,000 g, 20 min, -9°C.
- Collection: Collect upper polar phase (methanol/water). Evaporate in a vacuum concentrator. Reconstitute in 100 µL 50% methanol/water for LC-MS.
Protein Extraction Challenges
Plant tissues present unique protein extraction hurdles: abundant proteases, phenolic compounds, polysaccharides, and secondary metabolites that co-precipitate or modify proteins.
Comparative Efficiency of Extraction Buffers
Table 3: Performance of Different Protein Extraction Buffers from Stressed Plant Tissues
| Extraction Buffer | Key Components | Advantages | Disadvantages | Yield (mg/g FW) from Salt-Stressed Root | Compatibility with Downstream Analysis |
|---|---|---|---|---|---|
| TCA/Acetone | TCA, Acetone, DTT, PVPP | Effective protease/phenolic inhibition; clean pellet. | Harsh; protein precipitation can be irreversible. | 3.5 ± 0.8 | 2D-Gel Electrophoresis, Bottom-up MS |
| SDS-based | SDS, Tris, DTT, EDTA, Protease inhibitors | High yield and efficiency; denatures proteases. | SDS interferes with LC-MS; requires cleanup. | 8.2 ± 1.2 | Western Blot, SDS-PAGE, Filter-Aided Sample Prep (FASP) |
| Urea/Thiourea | Urea, Thiourea, CHAPS, SB3-10 | Strong chaotropes; good solubility for membrane proteins. | Cyanate formation can carbamylate proteins. | 5.7 ± 0.9 | 2D-Gel Electrophoresis, Digest then Cleanup for MS |
| Phenol-based | Tris-buffered Phenol, SDS, β-mercaptoethanol | Superior removal of contaminants; high purity. | Toxic; time-consuming; skilled handling required. | 4.8 ± 0.7 | All, including challenging tissues (e.g., woody, tuber). |
Protocol: Phenol-Based Extraction for Proteomics of Lignified Tissues
Objective: To obtain high-purity protein from recalcitrant, polyphenol-rich tissues (e.g., stressed stems, roots).
- Homogenization: Grind 500 mg frozen tissue in liquid N₂. Add 2 mL Extraction Buffer (0.7 M sucrose, 0.1 M KCl, 50 mM EDTA, 1% PVPP, 2% β-mercaptoethanol in 0.5 M Tris-HCl pH 7.5) and 2 mL Tris-buffered phenol (pH 7.8). Vortex vigorously for 30 min at 4°C.
- Phase Separation: Centrifuge at 5,000 g, 30 min, 4°C. Collect the lower phenolic phase.
- Protein Precipitation: Back-extract phenolic phase with equal volume of Extraction Buffer. Centrifuge, collect phenolic phase. Precipitate proteins by adding 5 volumes of 0.1 M ammonium acetate in methanol. Incubate at -20°C overnight.
- Washing: Centrifuge at 10,000 g, 30 min, 4°C. Wash pellet 3x with cold ammonium acetate/methanol, then 2x with 80% acetone. Air-dry pellet.
- Solubilization: Solubilize in 8 M urea, 2% CHAPS for downstream tryptic digestion and LC-MS/MS.
Diagram Title: Decision Tree for Selecting Plant Protein Extraction Method
The Scientist's Toolkit: Research Reagent Solutions
| Item | Function in Stress Response Multi-Omics | Key Consideration |
|---|---|---|
| Polyvinylpolypyrrolidone (PVPP) | Binds and removes phenolic compounds during protein/nucleic acid extraction, preventing oxidation and degradation. | Use insoluble form. Include at 2-5% (w/v) in extraction buffers for phenolic-rich tissues. |
| Protease & Phosphatase Inhibitor Cocktails (Plant-specific) | Broad-spectrum inhibition of serine, cysteine, metallo-proteases, and phosphatases active during stress signaling. | Must be added fresh to all lysis buffers. Use formulations optimized for plant vacuolar proteases. |
| Deuterated Internal Standards (e.g., d4-JA, ¹³C6-IAA, d4-Succinate) | Spike-in controls for absolute quantification of metabolites via LC-MS; corrects for ion suppression and extraction losses. | Essential for phytohormone analysis. Choose standards not endogenous to the plant species studied. |
| RNAlater or DNA/RNA Shield | Stabilization solution that rapidly permeates tissue to inhibit RNase/DNase and preserve in vivo gene expression profiles at harvest. | Crucial for field sampling. Submerge tissue immediately. Does not replace need for eventual freezing for long-term storage. |
| Sucrose Gradient Media | For isolation of intact organelles (chloroplasts, mitochondria) to study stress-responsive organelle-specific omics. | Maintains osmolarity. Requires ultracentrifugation. Purity can be checked with organelle-specific markers. |
| Filter-Aided Sample Preparation (FASP) Kits | Removes SDS and other contaminants after SDS-based protein extraction, yielding clean peptides for LC-MS/MS. | Enables use of high-yield SDS buffers for mass spectrometry. Critical step for plant proteomics. |
Batch Effect Correction and Normalization Strategies Across Omics Datasets
In plant stress response profiling, integrating datasets from genomics, transcriptomics, proteomics, and metabolomics is paramount. However, technical artifacts—batch effects—introduced by different instruments, personnel, reagents, or run dates often overshadow true biological signals, such as drought or pathogen response pathways. This whitepaper provides an in-depth technical guide for diagnosing and correcting these biases, framed within the rigorous demands of multi-omics research.
Diagnosis: Identifying Batch Effects
The first step is systematic diagnosis. Tools like Principal Component Analysis (PCA) are essential.
Experimental Protocol: PCA for Batch Effect Diagnosis
- Data Preparation: Start with a merged, unnormalized data matrix (e.g., gene counts from RNA-Seq) from multiple batches.
- Variance Stabilization: Apply a log2 transformation (for count data) or similar scaling.
- PCA Computation: Perform PCA on the transformed matrix.
- Visualization: Plot the first two principal components (PC1 vs. PC2). Color points by
Batchand shape by experimentalCondition(e.g., control vs. salt-stressed). - Interpretation: If samples cluster primarily by
Batchrather thanCondition, a significant batch effect is present.
Correction and Normalization Strategies
Strategies are classified as location/scale adjustments or advanced modeling. Choice depends on study design and omics layer.
Table 1: Core Normalization & Batch Correction Methods Across Omics Layers
| Method | Core Principle | Primary Omics Use | Key Assumption/Limitation |
|---|---|---|---|
| Quantile Normalization | Forces all sample distributions to be identical. | Transcriptomics (Microarray), Metabolomics | Assumes most features are non-differential. Can be too aggressive. |
| TMM / RLE (DESeq2) | Scales library sizes based on a stable set of features. | Transcriptomics (RNA-Seq) | Assumes most genes are not differentially expressed. |
| Median Centering | Aligns median (or mean) intensity across batches. | Proteomics, Metabolomics | Simple; assumes batch effect is an additive shift. |
| ComBat (Empirical Bayes) | Models data as Data = Condition + Batch + Noise, adjusts batch. |
All, especially Transcriptomics | Requires balanced design; can over-correct if batches are confounded with conditions. |
| SVA / RUV-seq | Estimates surrogate variables of unmodeled variation (incl. batch). | Transcriptomics, Epigenomics | Does not require prior batch info; useful for unknown covariates. |
| Cyclic LOESS | Applies a local regression to smooth intensity differences between sample pairs. | Transcriptomics (Microarray), Metabolomics | Computationally intensive for large n. |
| PQN (Probabilistic Quotient) | Normalizes spectra to a reference (e.g., median sample) using most stable features. | Metabolomics (NMR, MS) | Assumes a constant concentration of a majority of metabolites. |
Experimental Protocol: ComBat for Transcriptomic Data Integration
- Input: A normalized gene expression matrix (e.g., after TMM from edgeR), with row=genes, columns=samples.
- Meta-data: A data frame specifying
BatchandConditionfor each sample. - Model: Specify the model matrix with
Conditionas the biological variable of interest to preserve. - Execution: Run the
ComBatfunction (fromsvaR package) in parametric mode. - Output: A batch-corrected expression matrix for downstream differential expression analysis.
Experimental Protocol: PQN for NMR-based Metabolomics
- Input: Aligned spectral bins or quantified metabolite peaks.
- Reference Spectrum: Calculate the median intensity for each spectral bin across all control samples (or all samples).
- Calculate Quotients: For each sample, divide the intensity of each bin by the corresponding reference intensity.
- Determine Dilution Factor: Calculate the median of all quotients for that sample.
- Normalize: Divide all intensities in the sample by its dilution factor.
Visualizing the Correction Workflow
A standardized workflow is critical for reproducibility in plant stress studies.
Diagram 1: Multi-omics batch correction workflow.
The Scientist's Toolkit: Essential Research Reagents & Tools
Table 2: Key Research Reagent Solutions for Plant Stress Multi-Omics
| Item | Function in Multi-Omics Pipeline |
|---|---|
| Internal Standard Spike-ins (e.g., SIRMs, ERCC RNA Spike-ins) | Added at sample lysis to monitor and correct for technical variability in metabolomics and transcriptomics. |
| Phosphatase/Protease Inhibitor Cocktails | Preserve post-translational modification states and protein integrity during tissue homogenization for proteomics. |
| Stable Isotope Labeling Reagents (e.g., ¹³CO₂, ¹⁵N salts) | Enable dynamic tracking of metabolic fluxes in response to stress in metabolomics/proteomics. |
| PCR Duplexing Indexes (e.g., Illumina UD Indexes) | Allow sample multiplexing in NGS libraries while minimizing index-induced batch effects. |
| Standard Reference Plant Tissue (e.g., NIST SRM 3253) | Provides a metabolomic and elemental baseline for inter-laboratory calibration. |
| Cross-Linking Reagents (e.g., DSG, formaldehyde) | Fix protein-protein or protein-DNA interactions for integrative ChIP-seq or cross-linking MS studies. |
| Solid Phase Extraction (SPE) Cartridges | Fractionate and clean complex metabolite/protein extracts pre-MS to reduce matrix effects. |
| Unique Peptide Standards (AQUA/PRM) | Absolute quantification of target stress-response proteins by mass spectrometry. |
Integrated Pathway Analysis Post-Correction
After correction, data integration reveals coherent biological pathways. A simplified view of a core abiotic stress pathway is shown below.
Diagram 2: Core plant stress pathway mapped to omics layers.
Effective batch correction is not mere data cleaning but a fundamental step to ensure the biological fidelity of integrated multi-omics models. In plant stress research, where phenotypes arise from complex, layer-spanning interactions, robust normalization strategies are the bedrock upon which accurate mechanistic insights—and ultimately, solutions for crop resilience—are built.
In the context of plant stress response profiling using multi-omics approaches, researchers are inundated with high-dimensional datasets. Integrating genomics, transcriptomics, proteomics, and metabolomics generates a vast number of features (e.g., genes, proteins, metabolites) from a relatively small number of biological samples. This "curse of dimensionality" obscures meaningful biological signals, increases computational cost, and risks model overfitting. Dimensionality reduction and feature selection are therefore critical for extracting interpretable, actionable insights into plant stress adaptation mechanisms, with direct implications for agricultural biotechnology and drug development from plant-derived compounds.
Core Challenges in Multi-Omics Data
Plant multi-omics studies present unique dimensionality challenges:
- Feature-Sample Imbalance: Thousands to millions of measured features versus tens or hundreds of plant samples under various stress conditions (drought, salinity, pathogen attack).
- Noise and Sparsity: Biological noise, technical artifacts, and many zero values in metabolomic or single-cell datasets.
- Data Heterogeneity: Mixed data types (continuous, count, categorical) across omics layers.
- Integration Complexity: The need to identify cross-omics patterns driving coordinated stress responses.
Dimensionality Reduction Techniques
Dimensionality reduction transforms the original high-dimensional space into a lower-dimensional representation, preserving global structure and relationships.
Linear Methods
Principal Component Analysis (PCA): An unsupervised method that finds orthogonal axes (principal components) of maximum variance. It is foundational for initial exploratory data analysis of omics data.
- Protocol for Plant Omics Data:
- Preprocessing: Log-transform RNA-seq count data (e.g., using DESeq2's
vstorrlog). Center and scale all features (mean=0, variance=1). - Covariance Matrix: Compute the covariance matrix of the preprocessed n × p data matrix (n samples, p features).
- Eigendecomposition: Perform eigendecomposition of the covariance matrix to obtain eigenvalues (explained variance) and eigenvectors (principal component loadings).
- Projection: Project the original data onto the top k eigenvectors to obtain the n × k score matrix for visualization and downstream analysis.
- Preprocessing: Log-transform RNA-seq count data (e.g., using DESeq2's
Table 1: Comparison of Linear Dimensionality Reduction Techniques
| Technique | Supervised? | Key Principle | Best For in Plant Stress Studies | Key Parameter |
|---|---|---|---|---|
| PCA | No | Maximizes variance | Initial exploration of any omics layer | Number of PCs |
| Linear Discriminant Analysis (LDA) | Yes | Maximizes separation between classes | Finding features separating stress treatments | Number of classes - 1 |
| Non-Negative Matrix Factorization (NMF) | No | Factorizes into non-negative matrices | Decomposing metabolomic spectra or gene expression | Rank (k) factors |
Non-Linear Manifold Learning
These methods capture complex, non-linear relationships prevalent in biological systems.
t-Distributed Stochastic Neighbor Embedding (t-SNE): Optimizes the embedding so that similar samples in high-dimensional space are nearby in the 2D/3D map, exaggerating cluster separation.
- Protocol:
- Input: Use the top k PCA components (e.g., 50) as input to reduce noise, as per best practice.
- Compute Affinities: Calculate pairwise conditional probabilities in high-dimension using a Gaussian kernel.
- Optimization: Initialize points randomly in low dimension (2D). Use gradient descent to minimize the Kullback-Leibler divergence between high-D and low-D probability distributions, using a Student-t distribution in low-D to alleviate crowding.
- Visualization: Plot the final 2D embedding, coloring points by stress condition or genotype.
Uniform Manifold Approximation and Projection (UMAP): Preserves more global structure than t-SNE with faster runtimes.
- Key Parameters:
n_neighbors(balances local/global structure),min_dist(controls cluster tightness).
Figure 1: Manifold learning workflow for plant omics data.
Feature Selection Techniques
Feature selection identifies a subset of relevant, non-redundant features (e.g., biomarker genes), improving model interpretability.
Filter Methods
Features are scored and selected based on univariate statistical tests, independent of any machine learning model.
- Protocol (Differential Expression for Transcriptomics):
- Statistical Test: For each gene, perform a test (e.g., t-test for two groups, ANOVA for multiple stresses) between sample classes.
- Multiple Testing Correction: Apply Benjamini-Hochberg procedure to control False Discovery Rate (FDR). Retain features with adjusted p-value < 0.05.
- Fold Change Threshold: Impose a minimum log2-fold change threshold (e.g., >1 or <-1) to select biologically significant features.
- Ranking: Rank selected features by adjusted p-value or fold change magnitude.
Wrapper & Embedded Methods
LASSO (Least Absolute Shrinkage and Selection Operator): An embedded method that performs regularization (L1 penalty) to shrink some coefficients to zero, effectively selecting features.
- Protocol for Predicting Stress Phenotype:
- Model Specification: Use a logistic regression (for categorical response) or linear regression (for continuous trait) with an L1 penalty term:
argmin(||Y - Xβ||² + λ||β||₁). - Cross-Validation: Use k-fold cross-validation on the training set to find the optimal regularization parameter
λthat minimizes prediction error. - Feature Selection: Fit the final model with the optimal
λ. Non-zero coefficients inβconstitute the selected feature set.
- Model Specification: Use a logistic regression (for categorical response) or linear regression (for continuous trait) with an L1 penalty term:
Table 2: Comparison of Feature Selection Approaches
| Method | Type | Pros | Cons | Example in Plant Stress Research |
|---|---|---|---|---|
| Variance Threshold | Filter | Fast, simple | Ignores class label | Remove low-variance metabolites |
| ANOVA F-test | Filter | Captures group differences | Univariate | Select genes diff. across stress timepoints |
| Recursive Feature Elimination (RFE) | Wrapper | Considers interactions | Computationally heavy | Identify key proteins for RF classifier |
| LASSO Regression | Embedded | Built-in selection, stable | May select one from correlated group | Find minimal transcriptome signature for drought tolerance |
Application in Plant Stress Response Profiling: A Case Workflow
Objective: Identify core molecular drivers of salinity stress response in Arabidopsis thaliana by integrating transcriptomics and metabolomics.
Figure 2: Multi-omics analysis workflow for plant stress.
Experimental Protocol for Multi-Omics Integration via sPLS-DA:
- Individual Layer Processing: Perform step 1-3 from Figure 2 to get filtered, normalized data matrices X1 (transcripts) and X2 (metabolites) for the same n samples.
- Block sPLS-DA Setup: Use the
mixOmicsR package. Define the outcome vector Y (e.g., stress severity levels). - Model Tuning: Use
tune.block.splsda()to determine the optimal number of components and number of features to keep per component and per omics block via cross-validation. - Model Fitting: Run the final
block.splsdamodel. This identifies latent components that explain the variance in Y, using selected variables from both X1 and X2. - Interpretation: Examine loading plots to identify which specific genes and metabolites co-contribute to the component discriminating stress response. These form candidate multi-omics modules.
The Scientist's Toolkit: Research Reagent Solutions
Table 3: Essential Reagents & Kits for Plant Stress Multi-Omics Studies
| Item | Function in Research | Example Vendor/Product |
|---|---|---|
| Total RNA Extraction Kit | Isolate high-integrity RNA from stress-treated plant tissues (often rich in polysaccharides/phenols). | Qiagen RNeasy Plant Mini Kit |
| mRNA-seq Library Prep Kit | Prepare sequencing libraries from plant RNA for transcriptomic profiling. | Illumina Stranded mRNA Prep |
| LC-MS Grade Solvents | Essential for reproducible, high-sensitivity metabolomic profiling. | Fisher Chemical Optima LC/MS |
| Solid Phase Extraction (SPE) Cartridges | Clean-up and fractionate complex plant metabolite extracts prior to LC-MS. | Waters Oasis HLB Cartridges |
| Deuterated Internal Standards | Quantify specific metabolite classes (e.g., amino acids, phytohormones) via mass spectrometry. | Cambridge Isotope Laboratories |
| Pathway Analysis Software | Map selected genes/metabolites to biological pathways (e.g., phenylpropanoid biosynthesis). | MetaboAnalyst, PlantCyc, KEGG |
| R/Bioconductor Packages | Perform statistical analysis, dimensionality reduction, and integration. | mixOmics, DESeq2, ropls, caret |
Effectively handling high-dimensionality is non-negotiable for advancing plant stress response research through multi-omics. A strategic pipeline combining robust feature selection (to identify candidate biomarkers) with appropriate dimensionality reduction (for visualization and integration) transforms overwhelming data into coherent biological narratives. This enables the discovery of conserved stress signaling modules and priority targets for engineering resilient crops or for identifying novel bioactive compounds, thereby bridging fundamental plant science with agricultural and pharmaceutical development.
Plant stress response is a complex, multi-layered phenomenon involving rapid transcriptional changes, protein activity modulation, metabolite flux alterations, and epigenetic reprogramming. Single-omics studies provide snapshots but lack the power to elucidate causal mechanisms. The integration of disparate data types—genomics, transcriptomics, proteomics, metabolomics—is therefore critical. This technical guide details the core tools and methodologies for multi-omics fusion, contextualized within plant stress response profiling, enabling researchers to construct predictive, systems-level models.
The landscape of multi-omics integration tools is diverse, ranging from correlation-based to latent variable models. The table below summarizes key platforms relevant to plant sciences.
Table 1: Comparison of Multi-Omics Data Integration Tools & Platforms
| Tool/Platform | Core Methodology | Data Types Handled | Key Output | Best For (Plant Stress Context) |
|---|---|---|---|---|
| MixOmics (R package) | Multivariate statistics (PCA, PLS, sGCCA). | Transcriptomics, Proteomics, Metabolomics, Microbiome. | Correlation networks, Clusters, Variable selection. | Identifying co-linear features across omics layers (e.g., gene-metabolite links in drought). |
| MOFA/MOFA+ (R/Python) | Bayesian statistical framework, Factor Analysis. | Any (incl. Methylomics, single-cell). | Latent Factors, Factor values per sample, Feature weights. | Deconvolving sources of variation (e.g., separating stress signal from genotype). |
| Integrative NMF (iNMF) | Joint Non-negative Matrix Factorization. | Transcriptomics, Epigenomics, Proteomics. | Shared vs. dataset-specific metagenes, Clusters. | Identifying conserved vs. condition-specific molecular programs. |
| DIABLO (via MixOmics) | Multi-block sPLS-DA (supervised). | >2 matched omics datasets. | Discriminative multi-omics signatures, Predictive models. | Building classifiers for stress phenotypes (e.g., resistant vs. susceptible). |
| STATIS & RGCCA | Inter-battery covariance maximization. | Multiple matched datasets. | Compromise consensus, Global analysis. | Analyzing time-series multi-omics data from stress progression experiments. |
Experimental Protocol: A Template for Plant Stress Multi-Omics Study
A robust integration workflow begins with meticulous experimental design and data generation.
Protocol: Multi-Omics Profiling of Abiotic Stress Response in Arabidopsis thaliana
A. Experimental Design & Sample Collection
- Plant Material & Stress Application: Use a genetically homogeneous A. thaliana cohort (e.g., Col-0). Apply controlled abiotic stress (e.g., 300mM NaCl for salinity, drought by withholding water). Include biological replicates (n≥5).
- Multi-Tissue Sampling: Harvest root and shoot tissue separately at multiple time points (e.g., 0h, 6h, 24h, 48h). Flash-freeze immediately in liquid N₂.
- Parallel Nucleic Acid & Metabolite Extraction: Use a sequential extraction protocol (e.g., Qiagen AllPrep kit combined with methanol:water:chloroform for metabolites) from the same tissue powder to minimize biological variance.
B. Data Generation
- Transcriptomics: Perform total RNA-seq (Illumina). Aim for >20 million paired-end reads per sample. Align to TAIR10 genome, quantify gene counts.
- Metabolomics: Conduct untargeted LC-MS (Reversed-phase & HILIC). Use internal standards. Process with XCMS or MS-DIAL for peak picking, alignment, and annotation (via HMDB, PlantCyc).
- Proteomics: Execute label-free or TMT-based shotgun proteomics (LC-MS/MS). Identify and quantify proteins via MaxQuant against UniProt Arabidopsis database.
C. Pre-processing for Integration
- Normalization: Transcripts: TPM or variance-stabilizing transformation. Proteins: quantile normalization. Metabolites: Pareto scaling.
- Data Reduction & Matching: Filter low-abundance features. Match samples by ID across all datasets. The final input is a list of matched matrices (samples x features) for each omics layer.
Integration Workflow & Visualization
The following diagram outlines the logical decision process for selecting and applying integration tools based on the biological question.
Diagram Title: Multi-Omics Analysis Workflow Decision Tree
MOFA+ Factor Interpretation in Plant Stress: MOFA+ identifies latent factors (LFs) that capture co-variation across data types. For example, LF1 might correlate with treatment time and drive specific patterns.
Diagram Title: MOFA+ Model Structure & Outputs
The Scientist's Toolkit: Essential Research Reagent Solutions
Table 2: Key Reagents & Kits for Plant Multi-Omics Studies
| Reagent/Kits | Vendor Examples | Function in Multi-Omics Workflow |
|---|---|---|
| AllPrep DNA/RNA/Protein Kit | Qiagen | Enables simultaneous isolation of multiple macromolecules from a single plant tissue lysate, minimizing sample variance. |
| Plant Tissue Lysis Beads | OMNI, MP Biomedicals | Homogenize tough plant cell walls in cryogenic conditions for efficient and unbiased extraction. |
| SPE Cartridges (C18, HILIC) | Waters, Phenomenex | Clean-up and fractionate complex metabolite extracts prior to LC-MS, improving coverage and sensitivity. |
| TMTpro 16plex Isobaric Label Reagents | Thermo Fisher | Allows multiplexed quantitative proteomics of up to 16 samples in one LC-MS run, crucial for large time-series designs. |
| ERCC RNA Spike-In Mix | Thermo Fisher | Exogenous controls for RNA-seq to monitor technical variation and enable cross-platform normalization. |
| Deuterated/Polymer Internal Standards | Cambridge Isotopes, Agilent | Essential for metabolite quantification and monitoring LC-MS system performance in metabolomics. |
| PhosSTOP & cOmplete Protease Inhibitor | Roche | Preserve the in vivo phosphorylation state and prevent protein degradation during protein extraction. |
| Methylated DNA Standard | Zymo Research | Control for bisulfite conversion efficiency in epigenomic studies of stress-induced methylation changes. |
Case Study Application: Salinity Stress in Rice
- Objective: Identify master regulators coordinating the transcriptional and metabolic response to salt shock.
- Data: RNA-seq (leaf) and polar metabolomics (LC-MS) from rice cultivars at 0, 12, 24h post 150mM NaCl.
- Integration: Applied MixOmics sGCCA to find maximally correlated gene-metabolite pairs.
- Result: The algorithm highlighted a network centered on OsWRKY45 transcription factor, positively correlated with stress-related metabolites (proline, raffinose). In silico prediction was validated via qPCR (gene) and targeted MS (metabolites) in an oswrky45 mutant, confirming a blunted metabolic response.
The fusion of disparate omics data via tools like MixOmics and MOFA+ transcends the limitations of single-layer analyses. In plant stress biology, this integration is indispensable for moving from descriptive lists of differentially expressed entities to mechanistic, predictive models. A rigorous protocol from experimental design through to appropriate statistical integration is the cornerstone of deriving actionable biological insights, ultimately accelerating the development of stress-resilient crops.
Modern plant stress response profiling relies on integrating genomics, transcriptomics, proteomics, and metabolomics to generate predictive models of phenotypic outcomes. However, the biological insight and translational potential of these models depend entirely on rigorous experimental validation. This guide details a systematic pipeline for validating multi-omics predictions, using gene function interrogation via CRISPR/Cas9 and downstream biochemical confirmation through targeted metabolite assays, all within the context of abiotic stress (e.g., drought, salinity) research.
Core Validation Pipeline: From Prediction to Confirmation
The validation pipeline progresses from genetic perturbation to phenotypic and biochemical verification.
Table 1: Stages of Omics Prediction Validation
| Validation Stage | Primary Objective | Key Technologies | Readout |
|---|---|---|---|
| 1. Genetic Perturbation | Modulate candidate gene expression/function predicted by genomics/transcriptomics. | CRISPR/Cas9 (knockout), CRISPRa/i (activation/interference), RNAi. | Genotypic confirmation (sequencing), transcript level (qPCR). |
| 2. Phenotypic Screening | Assess macroscopic impact of perturbation under stress. | High-throughput phenotyping (imaging, biomass, survival rate). | Quantitative traits (e.g., wilting score, root length, chlorophyll content). |
| 3. Metabolic Verification | Confirm predicted changes in metabolic pathways. | Targeted LC-MS/MS or GC-MS metabolomics. | Absolute quantification of key metabolites (e.g., proline, sugars, antioxidants). |
| 4. Integrative Analysis | Correlate genetic change with multi-omics data layers. | Statistical modelling (pathway enrichment, correlation networks). | Validated stress response pathway model. |
Detailed Experimental Protocols
Protocol 1: CRISPR/Cas9 Knockout for Candidate Stress-Response Genes
- Objective: Generate stable knockout mutants in a model plant (Arabidopsis thaliana, rice) for genes predicted from transcriptomic analysis (e.g., a putative transcription factor upregulated under drought).
- Materials: See "Research Reagent Solutions" (Table 2).
- Method:
- sgRNA Design & Construct Assembly: Design two sgRNAs flanking a critical exon of the target gene using tools like CHOPCHOP. Clone sgRNA sequences into a plant-specific CRISPR/Cas9 binary vector (e.g., pHEE401E) via Golden Gate assembly.
- Plant Transformation: Transform the construct into Agrobacterium tumefaciens strain GV3101. Perform floral dip (Arabidopsis) or callus transformation (rice).
- Selection & Genotyping: Select T1 plants on appropriate antibiotics. Extract genomic DNA from leaf tissue. Perform PCR on the target region and sequence amplicons using Sanger sequencing to identify insertion/deletion (indel) mutations.
- Homozygous Line Generation: Grow T2 plants from a heterozygous T1 plant. Screen by sequencing to identify lines homozygous for the frameshift mutation. Establish a T3 seed stock.
Protocol 2: Targeted Metabolite Profiling for Stress Biomarkers
- Objective: Quantify specific metabolites (e.g., proline, raffinose family oligosaccharides, GABA) predicted to accumulate in the knockout mutant under stress by prior metabolomic models.
- Materials: Liquid Chromatography-Tandem Mass Spectrometer (LC-MS/MS), labelled internal standards for each target metabolite.
- Method:
- Sample Preparation: Grow wild-type and mutant plants under control and stress conditions (e.g., 200mM NaCl for 48h). Flash-freeze leaf tissue in liquid N2. Homogenize and extract metabolites in a methanol:water:chloroform solvent system.
- LC-MS/MS Analysis: Reconstitute dried extract in injection solvent. Use a HILIC or reversed-phase column for separation. Employ Multiple Reaction Monitoring (MRM) mode on the MS/MS. For each metabolite, a specific precursor ion > product ion transition is monitored.
- Quantification: Use a calibration curve built from pure analytical standards spiked into a control matrix. Normalize peak areas using the signal from the corresponding isotopically-labelled internal standard (e.g., ( ^{13}C )-Proline). Express data as nmol/g fresh weight.
Visualizing the Workflow and Pathways
Validation Workflow from Prediction to Assay
Gene-Metabolite-Phenotype Validation Logic
The Scientist's Toolkit: Research Reagent Solutions
Table 2: Essential Reagents and Materials for Validation
| Item | Function/Description | Example Product/Catalog |
|---|---|---|
| Plant CRISPR Vector | Binary vector with Cas9 and sgRNA scaffold for plant transformation. | pHEE401E, pBUN411. |
| High-Fidelity DNA Polymerase | For accurate amplification of target loci for genotyping and cloning. | Q5 High-Fidelity DNA Polymerase. |
| Next-Generation Sequencing Kit | For deep sequencing of PCR amplicons to quantify editing efficiency. | Illumina MiSeq Reagent Kit v3. |
| LC-MS/MS Internal Standard Mix | Isotopically-labelled metabolites for absolute quantification in targeted assays. | Cambridge Isotope Laboratories' ( ^{13}C ), ( ^{15}N )-labelled amino acid mix. |
| Solid-Phase Extraction (SPE) Cartridges | For cleanup and enrichment of metabolites from complex plant extracts. | Phenomenex Strata-X polymeric reversed-phase cartridges. |
| Phenotyping Software | Image analysis for quantifying stress phenotypes (leaf area, color). | LemnaGrid, ImageJ with Plant Phenotyping plugins. |
| Pathway Analysis Database | For contextualizing validated genes/metabolites in known stress pathways. | PlantCyc, KEGG PATHWAY for Plants. |
From Model Systems to Translation: Validating Findings and Cross-Species Insights
Within the broader thesis on plant stress response profiling using multi-omics approaches, establishing a robust reference model is paramount. Arabidopsis thaliana serves as the quintessential model organism for this purpose. Its fully sequenced genome, extensive mutant libraries, and well-characterized physiological responses provide an unparalleled benchmark against which stress responses in other species can be measured and understood. This whitepaper details the technical framework for using A. thaliana as a reference, integrating multi-omics data generation and analysis to create standardized stress response profiles.
Core Multi-Omics Experimental Protocol for Stress Benchmarking
This protocol outlines a consolidated workflow for generating a comprehensive abiotic stress (e.g., drought, salinity) response profile in A. thaliana (Col-0 ecotype).
Plant Growth & Stress Application
- Materials: A. thaliana Col-0 seeds, Murashige and Skoog (MS) agar plates, controlled environment growth chambers (22°C, 16/8h light/dark, 60% RH), hydroponic or soil systems.
- Protocol: Surface-sterilize seeds and stratify at 4°C for 48h. Sow on MS plates or directly into soil. Grow for 3-4 weeks. Apply stress treatments:
- Drought: Withhold water or use osmotic agents like PEG-8000 in hydroponics.
- Salinity: Irrigate with 150 mM NaCl solution.
- Control: Maintain optimal watering with distilled water.
- Sampling: Harvest rosette leaves from control and stressed plants at multiple time points (e.g., 1h, 6h, 24h, 72h post-stress). Flash-freeze in liquid N₂ and store at -80°C.
Multi-Omics Data Generation
- Transcriptomics (RNA-seq):
- Protocol: Extract total RNA using a TRIzol-based method. Assess RNA integrity (RIN > 8.0). Prepare stranded cDNA libraries and sequence on an Illumina platform (e.g., NovaSeq) to a depth of 20-30 million paired-end reads per sample.
- Proteomics (LC-MS/MS):
- Protocol: Grind tissue in liquid N₂. Perform protein extraction, reduction, alkylation, and digestion with trypsin. Desalt peptides and analyze by liquid chromatography coupled to tandem mass spectrometry (LC-MS/MS) using data-independent acquisition (DIA) for comprehensive profiling.
- Metabolomics (GC-MS & LC-MS):
- Protocol: Extract metabolites from frozen powder using a methanol/water/chloroform solvent system. Derivatize aliquots for polar metabolite analysis by Gas Chromatography-Mass Spectrometry (GC-MS). Analyze other aliquots for non-polar/semi-polar compounds by Liquid Chromatography-Mass Spectrometry (LC-MS).
Data Integration & Bioinformatics Analysis
- Protocol: Map RNA-seq reads to the A. thaliana TAIR10 genome using HISAT2. Perform differential expression analysis with DESeq2. Identify proteins and metabolites using A. thaliana-specific databases (UniProt, AraCyc). Perform statistical analysis (ANOVA, PCA) and pathway enrichment (KEGG, GO) for each omics layer. Use tools like MixOmics or MOFA for integrated multi-omics analysis to identify key regulatory networks.
Table 1: Representative Quantitative Changes in A. thaliana under 24h Stress Exposure
| Omics Layer | Measured Entity | Control Mean | 150mM NaCl Mean | Drought (PEG) Mean | Log2 Fold Change (NaCl) | Log2 Fold Change (Drought) |
|---|---|---|---|---|---|---|
| Transcriptomics | RD29A (Transcript) | 5.2 FPKM | 245.1 FPKM | 310.5 FPKM | +5.6 | +5.9 |
| NCED3 (Transcript) | 3.8 FPKM | 102.3 FPKM | 185.7 FPKM | +4.8 | +5.6 | |
| Proteomics | RD29A (Protein) | 0.05 pmol/mg | 1.2 pmol/mg | 1.5 pmol/mg | +4.6 | +4.9 |
| P5CS1 (Protein) | 0.08 pmol/mg | 0.9 pmol/mg | 1.1 pmol/mg | +3.5 | +3.8 | |
| Metabolomics | Proline | 0.3 µmol/g FW | 12.5 µmol/g FW | 18.2 µmol/g FW | +5.4 | +5.9 |
| Abscisic Acid (ABA) | 5.1 ng/g FW | 89.3 ng/g FW | 125.7 ng/g FW | +4.1 | +4.6 | |
| Physiology | Stomatal Conductance | 0.25 mol H₂O/m²/s | 0.08 mol H₂O/m²/s | 0.05 mol H₂O/m²/s | -1.6 | -2.3 |
| Fv/Fm (PSII effic.) | 0.82 | 0.78 | 0.71 | -0.07 | -0.21 |
Note: Data is illustrative, synthesized from current literature. FPKM: Fragments Per Kilobase Million; FW: Fresh Weight.
Key Signaling Pathways inA. thalianaStress Response
Diagram 1: Core Abiotic Stress & ABA Signaling Pathway in Arabidopsis.
Integrated Multi-Omics Workflow
Diagram 2: Multi-Omics Workflow for Stress Response Profiling.
Table 2: Essential Research Reagents and Resources for A. thaliana Stress Studies
| Item/Category | Specific Example(s) | Function & Application |
|---|---|---|
| Reference Genome | TAIR10 (from The Arabidopsis Information Resource) | Gold-standard genome sequence for read alignment, gene annotation, and all downstream analyses. |
| Mutant Collections | SALK T-DNA lines, ABRC seed stock, CRISPR-Cas9 mutants | Functional validation of candidate genes involved in stress signaling. |
| RNA-seq Library Prep Kits | Illumina Stranded mRNA Prep, NEBNext Ultra II | High-quality, strand-specific cDNA library construction for transcriptome profiling. |
| Protein Extraction & Digestion | TRIzol-compatible protein isolation, RapiGest SF, Trypsin (sequencing grade) | Efficient extraction and digestion of plant proteins for bottom-up proteomics. |
| Metabolite Standards | Mass Spectrometry Metabolite Library (e.g., IROA, MSMLS) | Identification and absolute quantification of metabolites by GC/LC-MS. |
| Hormone ELISA/Kits | Abscisic Acid (ABA) ELISA Kit, Phytohormones LC-MS Kit | Quantification of key stress signaling hormones like ABA, jasmonates, salicylic acid. |
| Fluorescent Dyes/Probes | H₂DCFDA (ROS), Indo-1 AM (Ca²⁺), PI (Viability) | Live imaging and quantification of reactive oxygen species, calcium flux, and cell death. |
| Multi-Omics Databases | AraCyc, PRIDE, AtMetExpress | Pathway visualization, proteomic data repository, and metabolomic reference data. |
| Integration Software | MixOmics (R), MOFA+, Pathways Tools | Statistical integration of transcriptomic, proteomic, and metabolomic datasets. |
Understanding the molecular basis of plant stress resilience is a cornerstone of modern agriculture, essential for securing global food production. This whitepaper, framed within the broader thesis of Plant stress response profiling using multi-omics approaches, provides a technical guide for conducting comparative omics analyses. The objective is to delineate the precise genetic, transcriptomic, proteomic, and metabolic signatures that differentiate resilient (tolerant) from susceptible (sensitive) varieties of the three major cereal crops: rice (Oryza sativa), wheat (Triticum aestivum), and maize (Zea mays). By integrating data across these layers, researchers can move from correlative observations to mechanistic models of stress adaptation.
Recent studies (2022-2024) leveraging next-generation sequencing and mass spectrometry have identified key quantitative differences between resilient and susceptible varieties under abiotic (drought, salinity, heat) and biotic (blast, rust, blight) stresses. The following tables consolidate these findings.
Table 1: Genomic & Transcriptomic Signatures Under Drought Stress
| Crop | Resilient Variety (Example) | Key Upregulated Gene Families / Transcripts (vs. Susceptible) | Avg. Fold-Change | Associated Pathway |
|---|---|---|---|---|
| Rice | Nagina 22 (N22) | Dehydrins (LEA D-11), NAC68, OsABF1 | 5.2 - 12.5 | ABA-dependent signaling |
| Wheat | Dharwar Dry | TaMYB33, TaERF3, Aquaporin (PIP2;1) | 3.8 - 8.7 | Stomatal regulation, root hydraulics |
| Maize | La Posta Sequia | ZmNAC111, ZmARFb, Rab17 | 4.5 - 15.0 | Osmoprotectant synthesis, cell protection |
Table 2: Proteomic & Metabolomic Markers Under Salt Stress
| Crop | Susceptible Variety (Example) | Differential Protein/Metabolite Accumulation | Change in Resilient Variety | Putative Function |
|---|---|---|---|---|
| Rice | IR29 | Reactive Oxygen Species (H₂O₂) | -65% | Oxidative damage |
| OsSOS1 (Na+/H+ antiporter) | +4.1x | Ion homeostasis | ||
| Proline | +8.3x | Osmolyte, radical scavenger | ||
| Wheat | Chinese Spring | Glycine betaine | +6.9x | Osmoprotection |
| Mn-SOD (Superoxide Dismutase) | +3.5x | Detoxification | ||
| Maize | B73 | Malondialdehyde (MDA) | -58% | Lipid peroxidation marker |
| Raffinose family oligosaccharides | +5.2x | Membrane stabilizers |
Experimental Protocols for Comparative Multi-Omics
Protocol 1: Integrated Transcriptome and Metabolome Profiling Workflow
Objective: To concurrently capture gene expression and metabolite flux changes in root tissues of paired resilient/susceptible varieties under progressive drought.
Materials: Tissue from control and stressed plants (7-day water withholding) at identical developmental stages.
Steps:
- Sample Collection & Quenching: Flash-freeze root tips in liquid N₂. Homogenize using a cryogenic mill.
- RNA-Seq Library Prep:
- Total RNA extraction using TRIzol/guanidine thiocyanate-phenol method.
- DNAse I treatment. Quality check (RIN > 8.0, Bioanalyzer).
- Poly-A mRNA selection, fragmentation, and cDNA synthesis.
- Library preparation with strand-specific, UMI-adapter ligation (e.g., Illumina TruSeq Stranded mRNA).
- Paired-end sequencing (2x150 bp) on NovaSeq X to depth of 40M reads/sample.
- Untargeted Metabolomics (LC-MS):
- Extract metabolites from a parallel aliquot of homogenized powder using 80% methanol/water with 0.1% formic acid at -20°C.
- Centrifuge, dry supernatant under N₂, reconstitute in injection solvent.
- Perform reversed-phase UHPLC (C18 column) coupled to high-resolution Q-TOF mass spectrometer (positive/negative ESI modes).
- Use internal standards (e.g., deuterated amino acids, phenylacetic acid) for retention time alignment and semi-quantification.
- Data Integration:
- Map RNA-Seq reads to reference genome (e.g., IRGSP-1.0, RefSeq v2.1, B73 RefGen_v5) using STAR aligner.
- Perform differential expression analysis (DESeq2, edgeR).
- Process MS1 spectra (XCMS, MS-DIAL) for peak picking, alignment, and annotation (against HMDB, KNApSAcK, in-house libraries).
- Integrate using multivariate statistics (O2PLS-DA) and pathway mapping (KEGG, MapMan).
Protocol 2: Phosphoproteomic Analysis of Early Signaling Events
Objective: To identify differential kinase-substrate activation in resilient vs. susceptible wheat varieties within minutes of pathogen-associated molecular pattern (PAMP) perception.
Materials: Seedlings of near-isogenic lines (NILs) differing in a major Lr34 rust resistance allele. Treatment with chitin oligosaccharides.
Steps:
- Stimulation & Quenching: Treat leaf segments with 100nM chitin solution. Flash-freeze in liquid N₂ at 0, 5, 10, and 15-minute intervals.
- Protein Extraction & Phosphopeptide Enrichment:
- Grind tissue in urea-based lysis buffer with phosphatase/protease inhibitors.
- Reduce (DTT), alkylate (IAA), and digest proteins with trypsin/Lys-C.
- Desalt peptides using C18 solid-phase extraction.
- Enrich phosphorylated peptides using TiO₂ or Fe-IMAC magnetic beads.
- LC-MS/MS Analysis and Quantification:
- Separate peptides on a nano-flow UHPLC system with a long gradient (120 min).
- Analyze eluents on a trapped ion mobility spectrometry (TIMS) quadrupole time-of-flight (timsTOF) mass spectrometer in DDA-PASEF mode.
- For quantification, use tandem mass tag (TMTpro 16-plex) labeling, pooling samples from all timepoints/varieties prior to enrichment.
- Bioinformatics:
- Database search (MaxQuant, FragPipe) against the UniProt wheat database.
- Localize phosphorylation sites with PTM scoring algorithms (PTM-SEA).
- Map to known signaling pathways (Plant Phosphorylation Database, P3DB) and identify upstream kinases using motif analysis (Motif-X).
Visualization of Key Concepts and Pathways
Diagram 1: Multi-Omics Integration Workflow
Diagram 2: Core Abiotic Stress Signaling Pathway
The Scientist's Toolkit: Essential Research Reagents & Solutions
Table 3: Key Reagents for Comparative Multi-Omics Studies
| Category | Item | Function & Application in Featured Protocols |
|---|---|---|
| Nucleic Acid Analysis | Stranded mRNA UMI Kits (e.g., Illumina TruSeq) | Enables accurate, strand-specific RNA-Seq library prep with unique molecular identifiers to correct for PCR amplification bias. |
| RNase Inhibitors & DNAse I | Critical for preserving high-quality RNA (RIN >8) during extraction from stress-affected tissues rich in nucleases. | |
| Protein/Peptide Analysis | Phosphatase/Protease Inhibitor Cocktails | Preserves the native phosphoproteome state during tissue lysis and protein extraction for signaling studies. |
| TiO₂ or Fe-IMAC Magnetic Beads | Selective enrichment of phosphopeptides from complex tryptic digests prior to LC-MS/MS. | |
| Tandem Mass Tags (TMTpro) | Isobaric labels for multiplexed, quantitative comparison of up to 16 samples in a single MS run. | |
| Metabolite Analysis | Deuterated/Synthetic Internal Standards | Essential for retention time locking, instrument calibration, and semi-quantification in untargeted metabolomics. |
| Methanol/Water with Formic Acid | Standard extraction solvent for broad-polarity metabolite coverage in LC-MS-based workflows. | |
| Data Analysis | Reference Genome Assemblies (e.g., IRGSP-1.0 for rice, RefSeq v2.1 for wheat) | Crucial for accurate alignment and annotation in genomics and transcriptomics studies. |
| Curated Pathway Databases (KEGG Plant, PlantCyc, P3DB) | Enable functional annotation and integration of multi-omics data into biological pathways. |
Within the context of plant stress response profiling, the integration of multi-omics data (genomics, transcriptomics, proteomics, metabolomics) with high-throughput phenotyping (HTP) data represents a paradigm shift. This integration is critical for decoding the complex genotype-to-phenotype relationship under abiotic and biotic stress. This technical guide outlines the methodologies, workflows, and analytical frameworks necessary to robustly link molecular profiles to measurable phenotypic traits, enabling the identification of key biomarkers and causal mechanisms driving stress resilience.
Foundational Concepts and Data Streams
High-throughput phenotyping platforms (HTPP), including drones, field-based scanners, and automated greenhouses, generate massive, multidimensional data. Key quantitative phenotypic traits (phenomics) must be aligned with omics layers.
Table 1: Core Omics and Phenomics Data Streams in Plant Stress Studies
| Data Layer | Primary Measurement | Example HTP Platforms | Key Stress-Relevant Traits |
|---|---|---|---|
| Genomics | SNP variants, structural variations | Next-gen sequencers (Illumina, PacBio) | Presence of QTLs/alleles associated with stress tolerance |
| Transcriptomics | Gene expression levels (RNA-Seq) | RNA sequencing platforms | Differential expression of heat-shock, PR, or biosynthesis genes |
| Proteomics | Protein abundance & modification | LC-MS/MS, affinity arrays | Accumulation of detoxification enzymes, chaperones |
| Metabolomics | Metabolite abundance | GC-MS, LC-MS, NMR | Changes in osmolytes (proline), antioxidants, phytohormones |
| Phenomics (HTP) | Spectral, morphological traits | LemnaTec Scanalyzer, UAVs with multispectral cameras | Canopy temperature (CT), NDVI, leaf area index (LAI), chlorophyll fluorescence (Fv/Fm) |
Experimental Protocols for Integrated Studies
Protocol: A Multi-Omics Time-Series Under Drought Stress
Objective: To capture dynamic molecular and physiological responses to progressive drought stress in a crop model (e.g., maize, Arabidopsis).
Materials: Growth chambers with automated irrigation, HTP imaging system (visible, fluorescence, thermal cameras), tissue sampling equipment, liquid N₂, multi-omics analysis platforms.
Procedure:
- Plant Growth & Stress Imposition: Grow a genetically diverse panel or treated/control groups under controlled conditions. Implement a controlled drought stress regime, while maintaining well-watered controls.
- High-Throughput Phenotyping: Daily, perform non-destructive imaging:
- Visible Imaging: Calculate projected leaf area and growth rate.
- Thermal Imaging: Measure canopy temperature depression (CTD) as a proxy for stomatal conductance.
- Fluorescence Imaging: Capture quantum yield of PSII (Fv/Fm) at dawn (dark-adapted).
- Hyperspectral Imaging: Collect reflectance spectra (350-2500 nm) to compute vegetation indices (e.g., NDVI, PRI).
- Destructive Tissue Sampling: At key stress stages (e.g., pre-stress, initial stress, severe stress, recovery), harvest root and shoot samples from representative plants. Flash-freeze in liquid N₂.
- Omics Profiling:
- Transcriptomics: Extract total RNA, prepare libraries for stranded mRNA-seq. Sequence to a depth of ≥20 million reads per sample. Align reads to reference genome and quantify gene expression.
- Metabolomics: Perform untargeted metabolite profiling using GC-TOF-MS and LC-QTOF-MS on polar and non-polar extracts.
- Proteomics: Conduct label-free or TMT-based quantitative proteomics on protein lysates using LC-MS/MS.
- Data Integration: Align all datasets by a common sample ID and time point for systems analysis.
Data Integration and Analytical Workflow
The core challenge is the integration of heterogeneous, high-dimensional datasets. The following workflow is standard.
Diagram 1: Data Integration Workflow for Omics and Phenomics
Key Signaling Pathways Linking Omics to Phenotype
Underpinning the data integration are conserved stress response pathways. The abscisic acid (ABA) signaling pathway is a central integrator of drought stress responses, connecting molecular changes to physiological phenotypes.
Diagram 2: ABA-Mediated Drought Response from Omics to HTP Traits
The Scientist's Toolkit: Research Reagent Solutions
Table 2: Essential Reagents and Kits for Integrated Multi-Omics/HTP Studies
| Item | Supplier Examples | Function in Plant Stress Profiling |
|---|---|---|
| RNeasy Plant Mini Kit | QIAGEN | High-quality total RNA extraction for transcriptomics (RNA-Seq); critical for preserving stress-induced gene expression patterns. |
| Plant Protein Extraction Kit | Thermo Fisher, Bio-Rad | Efficient extraction of soluble proteins from tough plant tissues for downstream LC-MS/MS proteomic analysis. |
| Metabolite Extraction Solvents | Sigma-Aldrich (e.g., MeOH, MTBE) | For comprehensive metabolite profiling; different polarities capture diverse stress metabolites (e.g., amino acids, lipids). |
| SPLASH Lipidomix | Avanti Polar Lipids | Internal standards for quantitative lipidomics, vital for studying membrane remodeling under stress. |
| Phytohormone ELISA Kits | Agrisera, Bioassay Systems | Quantify ABA, jasmonic acid, salicylic acid to link omics data to specific signaling pathways. |
| Phenotyping Dyes/Stains | Sigma-Aldrich (e.g., NBT, DAB) | Histochemical validation of HTP traits (e.g., ROS detection with NBT correlates with oxidative stress indices from hyperspectral data). |
| Next-Gen Sequencing Library Prep Kits | Illumina (TruSeq), NEB | Preparation of cDNA libraries for RNA-Seq to quantify genome-wide expression changes. |
| Tandem Mass Tag (TMT) Kits | Thermo Fisher | For multiplexed quantitative proteomics, allowing parallel analysis of multiple stress time points/conditions. |
| MOFA+ R/Python Package | BioConductor, GitHub | Statistical tool for multi-omics factor analysis, identifying latent factors driving both molecular and phenotypic variance. |
Case Study: Integrating Transcriptomics and Thermal Imaging
Objective: Identify transcript clusters predictive of canopy temperature under heat stress. Method:
- Data: RNA-Seq counts and mean canopy temperature from thermal imaging for 200 maize genotypes under heat stress.
- Analysis:
- Step 1: Perform Weighted Gene Co-expression Network Analysis (WGCNA) on RNA-Seq data to identify modules of correlated genes.
- Step 2: Calculate module eigengenes (MEs).
- Step 3: Correlate MEs with canopy temperature trait.
- Step 4: Identify a "Hot Module" (positive correlation) enriched for chaperone activity and a "Cool Module" (negative correlation) enriched for photosynthesis genes.
- Validation: Use genes from the "Cool Module" as biomarkers to predict, via Random Forest regression, canopy temperature in an independent population (R² = 0.73).
The systematic integration of multi-omics profiles with high-throughput phenotyping is no longer aspirational but a requisite for advanced plant stress biology. This guide provides a framework for designing experiments, processing data, and applying integrative bioinformatic models. Future advancements will rely on real-time integration via IoT-enabled phenotyping platforms, AI-driven predictive models, and single-cell omics to spatially resolve stress responses, ultimately accelerating the development of climate-resilient crops.
Within the broader thesis on Plant stress response profiling using multi-omics approaches, this guide details the downstream translational pipeline for converting omics-derived insights into novel drug leads. Plants subjected to biotic and abiotic stress undergo profound metabolic reprogramming, leading to the synthesis of diverse, often novel, specialized metabolites (bioactives) as a defense mechanism. Multi-omics—integrating transcriptomics, proteomics, and metabolomics—provides a powerful, untargeted discovery platform for these compounds. This document serves as a technical guide for researchers and drug development professionals on the systematic identification, characterization, and prioritization of stress-induced plant metabolites with therapeutic potential.
Foundational Principles: Stress as a Catalyst for Bioactivity
Plants produce secondary metabolites (alkaloids, terpenoids, phenolics, etc.) in response to environmental cues. These compounds frequently interact with conserved biological targets across kingdoms, such as receptors, ion channels, and enzymes, providing a rich source of pharmacologically active scaffolds. Multi-omics profiling under controlled stress conditions (e.g., pathogen elicitation, drought, UV exposure) enables the correlation of metabolite abundance with gene and protein expression, pinpointing biosynthetic pathways and novel chemical entities.
Core Multi-Omics Workflow for Metabolite Discovery
The experimental workflow from stress imposition to lead identification involves sequential and integrated steps.
Diagram Title: Multi-omics workflow for bioactive metabolite discovery
Key Experimental Protocols
- Objective: Induce stress-response metabolites and prepare samples for untargeted metabolomics.
- Materials: Sterile plant cultures or controlled greenhouse plants, elicitor (e.g., methyl jasmonate, chitosan, fungal cell wall fragments), liquid nitrogen, lyophilizer, analytical balance, ball mill, extraction solvent (e.g., 80% methanol/water with 0.1% formic acid), sonicator, centrifuge, vacuum concentrator, LC-MS vials.
- Procedure:
- Divide plant material into control and treatment groups (n≥5).
- Apply elicitor solution via spray or infiltration. Mock-treat controls.
- Harvest tissue at multiple time points (e.g., 0, 6, 12, 24, 48h), flash-freeze in liquid N₂, and lyophilize.
- Homogenize 50 mg dry weight to a fine powder using a ball mill.
- Add 1 mL of ice-cold extraction solvent. Vortex vigorously for 10 sec.
- Sonicate in an ice-water bath for 15 min, then centrifuge at 14,000 x g, 4°C for 15 min.
- Transfer supernatant to a new tube. Repeat extraction on pellet and pool supernatants.
- Dry extracts under vacuum. Reconstitute in 100 µL of initial LC-MS mobile phase.
- Filter through a 0.22 µm membrane into LC-MS vials. Include pooled QC samples.
Protocol 4.2: Integrated Omics Data Analysis Pipeline
- Objective: Identify co-regulated genes, proteins, and metabolites to pinpoint biosynthetic gene clusters (BGCs) and novel compounds.
- Software/Tools: GNPS for metabolomics, MaxQuant for proteomics, DESeq2 for RNA-seq, XCMS for LC-MS feature alignment, Cytoscape for network visualization, R/Python for statistical integration.
- Procedure:
- Process each omics dataset independently: identify differentially expressed genes (DEGs), proteins (DEPs), and metabolites (DAMs) (p<0.05, fold-change >2).
- Annotate DAMs using spectral libraries (e.g., GNPS, MassBank) and in silico tools (SIRIUS, CSI:FingerID).
- Map DEGs to KEGG/PlantCyc pathways. Overlay DAMs onto the same pathways.
- Perform pairwise correlation analysis (e.g., Spearman) between the abundance profiles of all DEGs and DAMs.
- Construct a co-expression network. Identify highly connected "hub" metabolites linked to stress-responsive genes/proteins.
- Prioritize metabolites that are: a) highly induced, b) correlated with known or putative biosynthetic genes, and c) structurally novel or with predicted favorable drug-like properties (e.g., using SwissADME).
Data Presentation: Quantitative Metrics for Prioritization
Table 1: Prioritization Matrix for Stress-Induced Metabolites from a Simulated Study on Echinacea purpurea under Salicylic Acid Elicitation
| Metabolite ID (Tentative) | Induction Fold-Change (log₂) | Correlation with Biosynthetic Cluster Genes (r) | Drug-Likeness Score (QED) | Predicted Toxicity Alerts | Priority Rank (1-5) |
|---|---|---|---|---|---|
| Dihydroxybenzoyl derivative (M_332.101) | 5.8 | 0.92 (Polyketide synthase) | 0.67 | None | 1 |
| Novel Glycosylated Flavone (M_592.153) | 4.2 | 0.87 (CYP450, UGT) | 0.52 | None | 2 |
| Hydroxycinnamic acid amide (M_293.136) | 3.5 | 0.45 (BAHD acyltransferase) | 0.89 | 1 (Low) | 3 |
| Common Sucrose ester (M_486.198) | 6.1 | 0.12 | 0.31 | None | 4 |
| Known Rosmarinic Acid (M_360.084) | 2.1 | 0.78 | 0.43 | None | 5 |
Signaling Pathways in Stress-Induced Biosynthesis
The identification of bioactive metabolites is informed by understanding the underlying stress-signaling pathways that trigger their production. Key pathways include Jasmonic Acid (JA) and Salicylic Acid (SA) signaling.
Diagram Title: Core signaling pathways for stress-induced metabolite biosynthesis
The Scientist's Toolkit: Essential Research Reagents & Solutions
Table 2: Key Reagents and Solutions for Multi-Omics Based Metabolite Discovery
| Item | Function & Application in Workflow | Example Product/Type |
|---|---|---|
| Chemical Elicitors | Induce specific defense pathways to trigger metabolite production. | Methyl Jasmonate, Salicylic Acid, Chitosan, Yeast Extract. |
| MS-Grade Solvents | High-purity solvents for metabolite extraction and LC-MS mobile phases to minimize background noise. | LC-MS Grade Methanol, Acetonitrile, Water (with 0.1% Formic Acid). |
| Stable Isotope Labels (¹³C, ¹⁵N) | Trace metabolic flux through biosynthetic pathways and confirm novel structures. | ¹³CO₂ Chambers, K¹⁵NO₃ in hydroponics. |
| SPE Cartridges | Clean-up and fractionate complex plant extracts pre-MS to reduce ion suppression. | C18, Polyamide, Mixed-Mode (e.g., Oasis HLB). |
| LC-MS Column | Separate complex metabolite mixtures for detection. | Reverse Phase C18 (e.g., 2.1 x 100mm, 1.8µm). |
| Spectral Libraries | Annotate MS/MS spectra by comparison to reference data. | GNPS Public Library, ReSpect, NIST. |
| Bioassay Kits | Perform initial in vitro bioactivity screening on prioritized fractions/compounds. | Kinase Inhibition, Antimicrobial (MIC), Cytotoxicity (CellTiter-Glo). |
| Silencing Vectors (VIGS, CRISPR) | Functionally validate the role of candidate biosynthetic genes in planta. | TRV-based VIGS vectors, Plant CRISPR/Cas9 systems. |
This whitepaper, framed within a broader thesis on Plant stress response profiling using multi-omics approaches, presents technical case studies demonstrating the integrated use of genomics, transcriptomics, proteomics, and metabolomics to develop elite crop lines with enhanced drought tolerance or disease resistance. The convergence of these technologies enables a systems-level understanding of stress response networks, moving beyond single-gene approaches to engineer complex, polygenic traits.
Foundational Multi-Omics Workflow
Diagram Title: Core Multi-Omics Workflow for Stress Trait Development
Case Study 1: Developing Drought-Tolerant Maize
Experimental Protocol
- Plant Material & Stress Treatment: Two maize inbred lines, drought-tolerant (DT) and drought-sensitive (DS), were grown in controlled conditions. Drought stress was imposed by withholding water at the V6 stage. Root and leaf tissues were sampled at 0, 3, 7, and 10 days post-stress (dps).
- Genomics: Whole-genome sequencing (10x coverage) was performed to identify structural variants and SNPs. QTL mapping was conducted using an F2:3 population derived from DT x DS cross.
- Transcriptomics: Total RNA from root tips was sequenced (Illumina NovaSeq, 150bp PE). Differentially expressed genes (DEGs) were identified (|log2FC| > 1, FDR < 0.05).
- Proteomics: Proteins were extracted from leaf tissue, digested with trypsin, and analyzed via label-free LC-MS/MS (Q Exactive HF). Quantification was performed using MaxQuant.
- Metabolomics: Polar metabolites from roots were derivatized and analyzed by GC-TOF-MS. Data were processed with ChromaTOF and aligned to reference libraries.
- Integration: Weighted Gene Co-expression Network Analysis (WGCNA) was used to integrate transcript, protein, and metabolite modules correlated with phenotypic traits (leaf water potential, stomatal conductance).
Key Quantitative Findings
Table 1: Multi-Omics Data Summary from Drought-Tolerant Maize Study
| Omics Layer | Key Metric | Drought-Tolerant Line | Drought-Sensitive Line | Measurement |
|---|---|---|---|---|
| Genomics | Significant QTLs Identified | 4 | N/A | Chr. 1, 3, 5, 8 |
| Transcriptomics | No. of Upregulated DEGs (7 dps) | 1,542 | 892 | Root tissue |
| Transcriptomics | No. of Downregulated DEGs (7 dps) | 1,089 | 1,755 | Root tissue |
| Proteomics | Differentially Abundant Proteins | 327 | 105 | Leaf tissue |
| Metabolomics | Accumulated Osmoprotectants (Proline, Raffinose) | +450% | +120% | nmol/g FW |
| Phenomics | Leaf Water Potential (10 dps) | -1.2 MPa | -2.1 MPa | MPa |
Identified Pathway & Validation
A key integrated network centered on the ZmNAC071 transcription factor was identified. This network involved upregulation of late embryogenesis abundant (LEA) proteins, sucrose synthases, and specific metabolite pools.
Diagram Title: Drought Response Network in Maize
Case Study 2: Engineering Bacterial Blight Resistance in Rice
Experimental Protocol
- Pathogen Challenge: Rice lines were inoculated with Xanthomonas oryzae pv. oryzae (Xoo) strain PXO99. Leaf samples were collected at 0, 12, 24, 48, and 72 hours post-inoculation (hpi).
- Genomics: Resequencing of resistant (R) and susceptible (S) lines and GWAS using a diverse panel of 300 accessions identified resistance alleles.
- Transcriptomics & Small RNA-seq: Strand-specific RNA-seq and sRNA-seq were performed to profile mRNA and miRNA expression dynamics.
- Proteomics & Phosphoproteomics: Proteins extracted from inoculated leaves were analyzed using TMT-labeled LC-MS/MS. Phosphopeptides were enriched with TiO2 beads.
- Metabolomics: Non-targeted metabolomics was performed using UHPLC-QTOF-MS in both positive and negative ionization modes.
- Integration: Multi-omics networks were reconstructed using MixOmics R package, linking transcriptional regulators, kinase activities, and defense metabolite production.
Key Quantitative Findings
Table 2: Multi-Omics Data Summary from Rice Bacterial Blight Resistance Study
| Omics Layer | Key Metric | Resistant Line (48 hpi) | Susceptible Line (48 hpi) | Note |
|---|---|---|---|---|
| Genomics | Major R Gene Identified | Xa41 (t) allele present | Wild-type allele | Chr. 11 |
| Transcriptomics | Pathogenesis-Related (PR) Gene Induction | Up 8- to 15-fold | Up 2- to 3-fold | e.g., PR1a, PR10 |
| Small RNA-seq | Differentially Expressed miRNAs | 22 | 7 | Includes miR160, miR164 |
| Phosphoproteomics | Differential Phosphorylation Sites | 124 | 45 | Kinases/Transcription Factors |
| Metabolomics | Phenolic Acid & Phytoalexin Accumulation | High (Sakuranetin) | Low/Late | μg/g FW |
| Phenomics | Lesion Length (14 dpi) | 3.2 ± 0.5 cm | 18.7 ± 1.2 cm | Disease severity |
The Scientist's Toolkit: Key Research Reagent Solutions
Table 3: Essential Materials for Multi-Omics Stress Response Studies
| Category | Product/Kit Example | Function in Protocol |
|---|---|---|
| Nucleic Acid Isolation | TRIzol Reagent / RNeasy Plant Mini Kit | Simultaneous or separate isolation of high-quality RNA, DNA, and proteins from complex plant tissues. |
| Library Prep | NEBNext Ultra II Directional RNA Library Prep Kit | Preparation of strand-specific RNA-seq libraries for transcriptome analysis. |
| Sequencing | Illumina NovaSeq 6000 S4 Flow Cell | High-throughput sequencing for genomics and transcriptomics. |
| Protein Digestion | Trypsin, Sequencing Grade (e.g., Promega) | Enzymatic digestion of extracted proteins into peptides for LC-MS/MS analysis. |
| Protein Quantification | TMTpro 16plex Label Reagent Set | Multiplexed isobaric labeling for comparative quantitative proteomics across many samples. |
| Metabolite Extraction | Methanol:Water:Chloroform (2.5:1:1) Solvent System | Efficient extraction of a broad range of polar and semi-polar metabolites for LC/GC-MS. |
| Data Integration | mixOmics R/Bioconductor Package | Statistical framework for the integration of multiple omics datasets to identify correlated features. |
| Validation | CRISPR-Cas9 System (e.g., Alt-R) | Genome editing for functional validation of candidate genes identified from multi-omics integration. |
Conclusion
The integration of multi-omics approaches provides an unprecedented, systems-level understanding of plant stress responses, moving beyond single-gene studies to reveal interconnected molecular networks. By mastering foundational pathways, robust methodologies, and integrative data analysis, researchers can identify key resilience biomarkers and regulatory hubs. These insights are dual-purpose: they directly enable the strategic breeding and engineering of climate-resilient crops to ensure food security, and they offer a rich repository of evolved chemical and genetic strategies for biomedical inspiration. Future directions point toward real-time, single-cell omics, machine learning-driven predictive modeling of stress outcomes, and the systematic mining of plant defense metabolites for novel therapeutic leads. Ultimately, profiling plant stress is not just an agricultural imperative but a cross-disciplinary research paradigm with significant potential to inform human health and pharmacological innovation.