Decoding Nature's Pharmacy: Advanced GC-MS Analysis of Volatile Biomarkers in Medicinal Plants for Drug Discovery
This comprehensive guide details the application of Gas Chromatography-Mass Spectrometry (GC-MS) for profiling volatile organic compounds (VOCs) in medicinal plants, serving as a critical methodology for modern phytochemical research and...
Decoding Nature's Pharmacy: Advanced GC-MS Analysis of Volatile Biomarkers in Medicinal Plants for Drug Discovery
Abstract
This comprehensive guide details the application of Gas Chromatography-Mass Spectrometry (GC-MS) for profiling volatile organic compounds (VOCs) in medicinal plants, serving as a critical methodology for modern phytochemical research and drug development. We explore the foundational role of plant volatiles as chemotaxonomic and bioactive markers. A step-by-step methodological framework covers sample preparation, headspace techniques, and data acquisition. The article provides solutions for common analytical challenges and emphasizes method validation, including comparative analyses against reference standards and other techniques like GC-IMS or LC-MS. Targeted at researchers and industry professionals, this resource bridges analytical chemistry with pharmacognosy to accelerate the identification of novel lead compounds.
The Volatile Fingerprint: Understanding Plant VOC Biomarkers and Their Significance in Pharmacognosy
Volatile Organic Compounds (VOCs) are low molecular weight, carbon-based compounds with high vapor pressure at room temperature. In medicinal plants, they represent a critical fraction of bioactive metabolites, serving as chemotaxonomic markers, quality control indicators, and active pharmaceutical ingredients. This Application Note details the definition, classification, and analytical profiling of key VOCs—primarily terpenes and phenylpropanoids—within the framework of a thesis focused on GC-MS profiling for the discovery of volatile markers in medicinal plants.
Classification and Significance of Key VOCs
Terpenes and Terpenoids
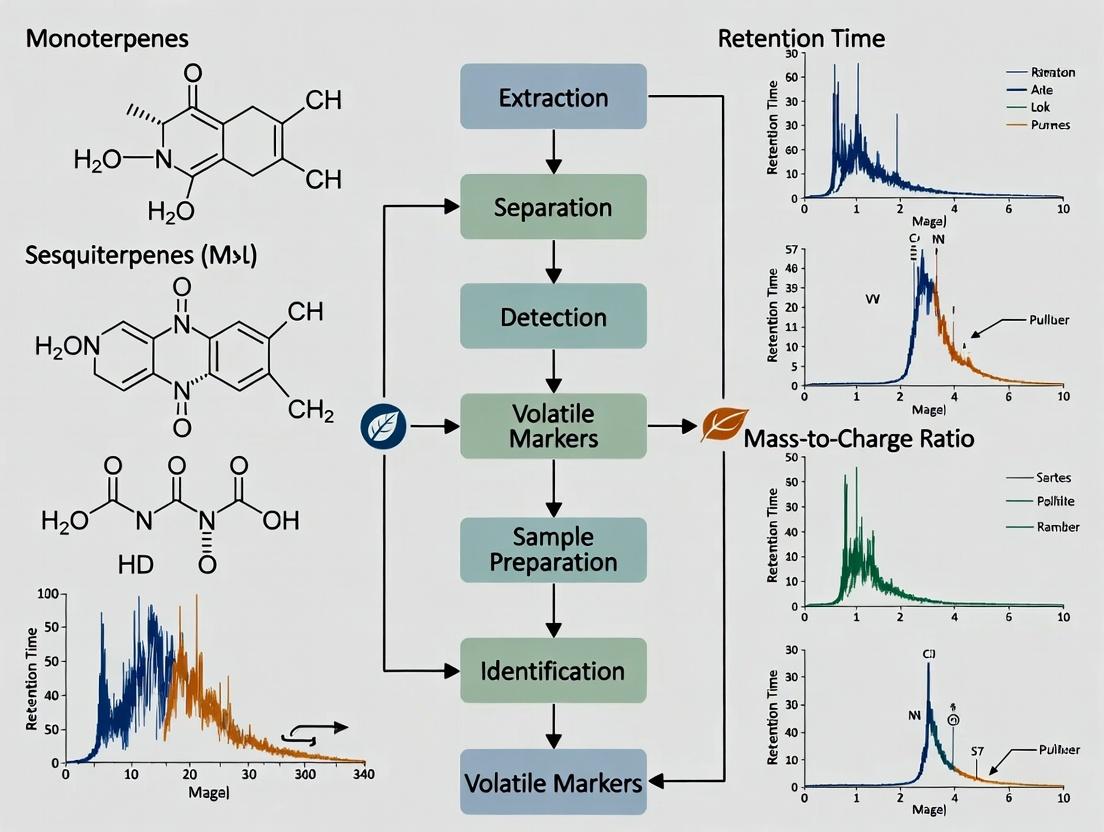
Derived from isoprene (C5H8) units, they constitute the largest and most diverse class of plant VOCs.
- Monoterpenes (C10): Often responsible for characteristic aromas (e.g., limonene, pinene). Exhibit antimicrobial, anti-inflammatory activities.
- Sesquiterpenes (C15): Less volatile, contribute to earthy scents (e.g., β-caryophyllene). Notable for anti-cancer and analgesic properties.
- Diterpenes (C20): Less common as volatiles due to higher molecular weight.
Phenylpropanoids and Benzenoids
Derived from the shikimate/phenylalanine pathway. Characterized by a C6-C3 (phenylpropane) skeleton or simpler C6-C1 benzenoid structures.
- Examples: Eugenol (clove), estragole (basil), cinnamaldehyde (cinnamon). Known for antioxidant, antimicrobial, and analgesic effects.
Other VOC Classes
Include fatty acid derivatives (green leaf volatiles like hexenal), nitrogen/sulfur-containing compounds (glucosinolate breakdown products), and various aldehydes, ketones, and alcohols.
Quantitative Data on Common Medicinal Plant VOCs
Table 1: Representative VOCs and Their Relative Abundance in Select Medicinal Plants
| Plant Species (Common Name) | Primary VOC Class | Key Identified Compounds (Marker Compounds) | Typical Relative % Area (GC-MS) | Reported Bioactivity |
|---|---|---|---|---|
| Ocimum basilicum (Sweet Basil) | Phenylpropanoids / Monoterpenes | Estragole, Linalool, (E)-α-Bergamotene | Estragole: 50-85%, Linalool: 1-20% | Antimicrobial, Antioxidant |
| Mentha × piperita (Peppermint) | Monoterpenoids | Menthol, Menthone, 1,8-Cineole | Menthol: 30-55%, Menthone: 15-30% | Analgesic, Digestive aid |
| Zingiber officinale (Ginger) | Sesquiterpenes | α-Zingiberene, Ar-curcumene, β-Sesquiphellandrene | α-Zingiberene: 20-35% | Anti-inflammatory, Anti-emetic |
| Syzygium aromaticum (Clove) | Phenylpropanoids | Eugenol, Eugenyl Acetate, β-Caryophyllene | Eugenol: 70-90% | Anesthetic, Antibacterial |
| Lavandula angustifolia (Lavender) | Monoterpenoids / Esters | Linalool, Linalyl Acetate, Terpinen-4-ol | Linalool: 20-35%, Linalyl Acetate: 25-45% | Anxiolytic, Sedative |
Experimental Protocols for VOC Profiling via GC-MS
Protocol 4.1: Headspace Solid-Phase Microextraction (HS-SPME) Sampling
Principle: Adsorption of headspace VOCs onto a coated fiber for thermal desorption in the GC injector. Materials: GC-MS system, SPME assembly, fused silica fiber (e.g., 50/30 μm DVB/CAR/PDMS), thermostatic agitator. Procedure:
- Plant Preparation: Homogenize 100 mg fresh plant tissue (leaf/flower) in a 20 mL HS vial.
- Equilibration: Incubate vial at 60°C for 10 min with agitation (250 rpm).
- Adsorption: Expose and adsorb VOCs onto the SPME fiber for 30 min at 60°C.
- Desorption: Insert fiber into GC injector (splitless mode) at 250°C for 5 min for thermal desorption.
- GC-MS Analysis: Proceed with analysis per Protocol 4.3.
Protocol 4.2: Hydrodistillation (Clevenger-type) for Essential Oil Isolation
Principle: Co-distillation of water and plant VOCs, followed by separation and collection of the essential oil layer. Materials: Clevenger apparatus, round-bottom flask, heat mantle, condenser, separating funnel. Procedure:
- Charge 50 g dried plant material and 500 mL deionized water into a 1 L flask.
- Assemble Clevenger apparatus and heat to sustained boiling for 3 hours.
- Collect the distilled essential oil from the condenser side arm.
- Dry the oil over anhydrous sodium sulfate and store at -20°C.
- Dilute 10 μL oil in 1 mL hexane for GC-MS injection.
Protocol 4.3: GC-MS Analysis Parameters
System: GC coupled with Quadrupole MS and Electron Ionization (EI) source. Column: Low-polarity stationary phase (e.g., HP-5MS, 30 m × 0.25 mm × 0.25 μm). Method:
- Carrier Gas: He, constant flow 1.0 mL/min.
- Injector: 250°C, split ratio 10:1 (for liquid) or splitless (for SPME).
- Oven Program: 40°C (hold 3 min), ramp at 5°C/min to 250°C (hold 5 min).
- Transfer Line: 280°C.
- Ion Source: 230°C, Electron Energy 70 eV, Scan Range m/z 35-450.
- Identification: Compare mass spectra to NIST/Adams libraries and authentic standards. Use Kovats Retention Index for confirmation.
Biosynthetic Pathway Diagrams
Diagram Title: Terpene Biosynthesis Pathways (MEP & MVA)
Diagram Title: Phenylpropanoid Biosynthesis Pathway
Diagram Title: VOC Profiling Workflow for Medicinal Plants
The Scientist's Toolkit: Essential Research Reagents & Materials
Table 2: Key Reagents and Materials for VOC Analysis
| Item/Category | Specific Example/Description | Function in VOC Research |
|---|---|---|
| SPME Fibers | 50/30 μm DVB/CAR/PDMS, 100 μm PDMS | Adsorbent phase for non-destructive headspace sampling of a broad range of VOCs. |
| Internal Standards | Deuterated Toluene (Toluene-d8), Alkane Mix (C7-C30) | For semi-quantification and calculation of Kovats Retention Indices (RI) for compound identification. |
| GC-MS Column | HP-5MS (5% Phenyl Methylpolysiloxane), Equity-5 | Standard low-polarity column for optimal separation of complex VOC mixtures. |
| Calibration Mix | Terpene Standard Mix, Phenylpropanoid Mix | Contains authentic chemical standards for absolute quantification and confirmation of identity. |
| Sample Vials | 20 mL Headspace Vials, PTFE/Silicone Septa | Inert, sealed containers for sample incubation and SPME sampling. |
| Drying Agent | Anhydrous Sodium Sulfate (Na2SO4) | Removes trace water from essential oils or extracts post-isolation to prevent instrument damage. |
| Solvents (GC-MS Grade) | Hexane, Dichloromethane, Methanol | High-purity solvents for sample dilution and cleaning; minimal background contamination. |
| Mass Spectral Library | NIST Mass Spectral Library, Adams Essential Oil Library | Reference databases for tentative identification of compounds based on EI mass spectra. |
Within the broader thesis on GC-MS profiling of volatile markers in medicinal plants, this application note establishes volatile organic compounds (VOCs) as critical chemotaxonomic markers. The chemical profile defined by VOCs provides a powerful tool for linking botanical identity (genus/species) to specific chemotypes, which has direct implications for authentication, quality control, and bio-prospecting in drug development.
Core Principles: VOC Profiles as Taxonomic Signatures
Plant taxa produce characteristic blends of VOCs (terpenes, aldehydes, ketones, aromatic compounds) via specialized metabolic pathways. Interspecific and intraspecific variations (chemotypes) are discernible through quantitative and qualitative analysis of these volatile signatures.
Application Notes
Note 1: Authentication and Adulteration Detection
Comparative VOC profiling can distinguish between genuine medicinal species and common adulterants, a critical step in ensuring phytopharmaceutical quality.
Table 1: Key Discriminatory VOCs for Selected Medicinal Plants and Adulterants
| Plant Species (Genus) | Common Adulterant | Key Discriminatory VOC Marker(s) | Typical Concentration Range in Authentic Species (μg/g dry weight) | Reference Method |
|---|---|---|---|---|
| Ocimum basilicum (Sweet Basil) | Ocimum americanum (Lime Basil) | Methyl chavicol (Estragole) | 5,000 - 12,000 | HS-SPME-GC-MS |
| Mentha × piperita (Peppermint) | Mentha spicata (Spearmint) | Menthol / Carvone Ratio | Menthol: 25,000-45,000; Carvone: <500 | Hydrodistillation-GC-MS |
| Lavandula angustifolia (True Lavender) | Lavandula × intermedia (Lavandin) | Linalyl acetate / Camphor Ratio | Linalyl acetate: 25,000-45,000; Camphor: 500-2,000 | Steam Distillation-GC-MS |
Note 2: Chemotype Differentiation within a Species
Single species often exhibit distinct chemotypes with significant pharmacological implications. VOC profiling is essential for their classification.
Table 2: Chemotypes of Thymus vulgaris L. Based on Dominant Monoterpene Phenol
| Chemotype | Dominant VOC Marker(s) | Percentage of Total Oil (Mean ± SD) | Associated Bioactivity |
|---|---|---|---|
| Thymol | Thymol | 40.5% ± 5.2% | Potent antimicrobial, antioxidant |
| Carvacrol | Carvacrol | 38.2% ± 6.1% | Strong antimicrobial, anti-inflammatory |
| Linalool | Linalool | 65.8% ± 8.4% | Sedative, anxiolytic |
| Geraniol | Geraniol | 45.3% ± 4.9% | Antimicrobial, insect repellent |
Note 3: Linking Phylogeny to VOC Biosynthesis
Advances in genomics and metabolomics allow correlation of genetic markers (e.g., terpene synthase gene variants) with specific VOC profiles, strengthening chemotaxonomy.
Experimental Protocols
Protocol 1: Headspace Solid-Phase Microextraction (HS-SPME) Coupled to GC-MS for Leaf VOC Profiling
Purpose: Non-destructive, sensitive profiling of living or freshly collected plant material VOCs.
Materials:
- Fresh plant leaf tissue (100-200 mg)
- 20 mL glass headspace vials with PTFE/silicone septa
- SPME fiber assembly (e.g., 50/30 μm DVB/CAR/PDMS, 65 μm PDMS/DVB)
- Gas Chromatograph-Mass Spectrometer (GC-MS) system
- Internal standard solution (e.g., 10 μg/mL nonane in methanol)
Procedure:
- Weigh 100 mg of freshly chopped leaf tissue into a 20 mL headspace vial. Immediately cap.
- Incubate vial in a heating block at 40°C for 5 min to establish equilibrium.
- Introduce the conditioned SPME fiber through the septum and expose it to the headspace for 15-30 min at 40°C.
- Retract the fiber and immediately inject it into the GC inlet for thermal desorption (250°C for 5 min, splitless mode).
- GC Conditions: Use a mid-polarity column (e.g., DB-35ms, 30 m x 0.25 mm, 0.25 μm). Oven program: 40°C (hold 2 min), ramp at 5°C/min to 150°C, then at 10°C/min to 280°C (hold 5 min). Helium carrier gas, constant flow 1 mL/min.
- MS Conditions: Transfer line 280°C, ion source 230°C, electron ionization at 70 eV, scan range m/z 40-400.
- Identify compounds by comparing mass spectra to NIST/Wiley libraries and linear retention indices. Quantify relative to internal standard or via total ion current (TIC) area percentage.
Protocol 2: Hydrodistillation (Clevenger-type) and GC-MS Analysis of Essential Oils
Purpose: Quantitative isolation and profiling of total volatile essences from dried botanical material.
Materials:
- Dried plant material (coarsely ground, 50 g)
- Clevenger apparatus
- 2 L round-bottom flask
- Heating mantle
- Anhydrous sodium sulfate
- Hexane or dichloromethane (GC grade)
Procedure:
- Place 50 g of dried material in a 2 L flask with 1 L of deionized water. Assemble the Clevenger apparatus.
- Heat using a heating mantle to maintain a steady boiling rate. Distill for 3-4 hours or until no more oil collects.
- Drain the collected essential oil and water mixture into a glass vial. Extract the oil from the water using 2 x 1 mL of hexane.
- Dry the combined organic layer over anhydrous sodium sulfate. Filter and gently evaporate under a nitrogen stream to a precise volume (e.g., 1 mL).
- Dilute 10 μL of oil in 1 mL of hexane containing internal standard. Analyze 1 μL via GC-MS using conditions similar to Protocol 1, but with a suitable split ratio (e.g., 1:50).
Visualizations
Title: VOC-Based Chemotaxonomy Workflow
Title: Major Biosynthetic Pathways to Plant VOCs
The Scientist's Toolkit: Essential Research Reagents & Materials
| Item | Function & Relevance to VOC Chemotaxonomy |
|---|---|
| SPME Fibers (50/30 μm DVB/CAR/PDMS) | Adsorbs a broad range of VOCs from headspace; crucial for non-destructive, sensitive sampling of live plant emissions. |
| Clevenger Apparatus | Standard glassware for quantitative isolation of essential oils via hydrodistillation, enabling yield calculation. |
| Internal Standards (e.g., Alkane series, deuterated compounds) | Allows for calculation of Retention Indices (RI) for compound identification and precise quantification. |
| Anhydrous Sodium Sulfate | Drying agent for removing trace water from organic solvent extracts of essential oils prior to GC-MS. |
| NIST/Adams/Wiley Mass Spectral Libraries | Reference databases for preliminary identification of volatile compounds based on electron ionization mass spectra. |
| Standard Reference Compounds (e.g., α-pinene, limonene, linalool) | Used for creating calibration curves for quantification and confirming GC retention times. |
| Stable Isotope Labeled Precursors (¹³C-Glucose, D₂O) | Tracers for elucidating biosynthetic pathways of specific VOCs, linking genetics to chemistry. |
| Silanized Glass Vials/Inserts | Prevents adsorption of volatile compounds onto active glass surfaces, ensuring accurate quantification. |
Application Notes
Volatile organic compounds (VOCs) serve as critical biomarkers in medicinal plants, offering a direct link to their bioactivity. Their pharmacological potential spans anti-inflammatory, antimicrobial, anticancer, and neuroprotective effects, largely mediated through modulation of key cellular signaling pathways. Precise profiling via GC-MS is fundamental to validating these compounds as leads for drug development.
Table 1: Key Volatile Biomarkers, Their Plant Sources, and Reported Bioactivities
| Volatile Biomarker | Common Plant Source | Primary Reported Bioactivity (In Vitro/In Vivo) | Key Molecular Targets/Pathways Implicated |
|---|---|---|---|
| β-Caryophyllene | Cannabis sativa, Black Pepper | Anti-inflammatory, Analgesic | Cannabinoid receptor type 2 (CB2) agonist; NF-κB pathway inhibition |
| Linalool | Lavender, Coriander | Anxiolytic, Neuroprotective | GABA_A receptor modulation; NMDAR inhibition; NF-κB & MAPK pathway downregulation |
| Thymol | Thyme, Oregano | Antimicrobial, Antioxidant | Bacterial membrane disruption; Nrf2 pathway activation |
| α-Humulene | Hops, Ginger | Anti-inflammatory, Anticancer | NF-κB pathway inhibition; COX-2 suppression; apoptosis induction |
| 1,8-Cineole (Eucalyptol) | Eucalyptus, Rosemary | Anti-inflammatory, Mucolytic | TNF-α & IL-1β suppression; TRPM8 channel modulation |
Table 2: Quantitative Bioactivity Data for Select Volatile Biomarkers
| Compound | Assay Model | Key Efficacy Metric | Reference Concentration |
|---|---|---|---|
| β-Caryophyllene | Murine model of neuropathic pain | ~60% reduction in pain response | 10-100 mg/kg (in vivo) |
| Linalool | LPS-induced microglia (in vitro) | ~50% reduction in TNF-α release | 100 µM |
| Thymol | Staphylococcus aureus (MIC) | Minimum Inhibitory Concentration (MIC) | 125-250 µg/mL |
| α-Humulene | Human colon adenocarcinoma cells | IC₅₀ for cell proliferation inhibition | ~45 µM |
Experimental Protocols
Protocol 1: GC-MS Profiling of Volatile Biomarkers from Plant Material
Objective: To extract, separate, identify, and quantify volatile compounds from dried medicinal plant material.
Materials:
- Research Reagent Solutions & Essential Materials:
- Solid-Phase Microextraction (SPME) Fiber (e.g., 50/30 µm DVB/CAR/PDMS): For headspace sampling of volatiles; adsorbs a broad range of compound chemistries.
- Gas Chromatograph-Mass Spectrometer (GC-MS): Equipped with a capillary column (e.g., DB-5ms, 30m x 0.25mm, 0.25µm film).
- Internal Standard Solution (e.g., 4-Methyl-1-pentanol in methanol, 100 µg/mL): For semi-quantitative analysis; corrects for instrumental variance.
- Alkane Standard Mixture (C7-C30): For calculation of Linear Retention Indices (LRI) to aid compound identification.
- NIST/Adams/Wiley Mass Spectral Libraries: For tentative identification by spectral matching.
Procedure:
- Sample Preparation: Precisely weigh 100 mg of finely ground plant material into a 20 mL headspace vial. Add 10 µL of internal standard solution. Seal vial with a PTFE/silicone septum cap.
- Headspace Equilibration: Incubate the vial in a heating block at 80°C for 10 minutes with agitation.
- SPME Extraction: Insert the conditioned SPME fiber through the septum and expose it to the headspace for 30 minutes at 80°C.
- GC-MS Injection & Desorption: Retract the fiber and immediately inject it into the GC inlet. Desorb volatiles in splitless mode at 250°C for 5 minutes.
- Chromatographic Separation: Use helium as carrier gas (1.0 mL/min constant flow). Oven program: 40°C (hold 3 min), ramp at 5°C/min to 250°C (hold 5 min).
- Mass Spectrometric Detection: Operate MS in EI mode (70 eV). Scan range: m/z 35-350. Ion source temperature: 230°C.
- Data Analysis: Process chromatograms using instrument software. Identify compounds by matching mass spectra (>85% similarity) and LRI (±10 units) to reference databases. Perform semi-quantification relative to the internal standard.
Protocol 2: In Vitro Anti-inflammatory Assay for Volatile Biomarker Validation
Objective: To assess the inhibition of nitric oxide (NO) production in LPS-stimulated macrophages by a volatile biomarker.
Materials:
- Research Reagent Solutions & Essential Materials:
- RAW 264.7 Murine Macrophage Cell Line: Standard model for inflammation studies.
- Lipopolysaccharide (LPS) from E. coli: Potent inducer of inflammatory response (e.g., NO, TNF-α).
- Griess Reagent System: For colorimetric quantification of nitrite, a stable metabolite of NO.
- Dimethyl Sulfoxide (DMSO) + 0.1% Tween 80: Co-solvent system to improve aqueous solubility of lipophilic volatiles.
- Cell Viability Assay Kit (e.g., MTT or Resazurin): To confirm anti-inflammatory effects are not due to cytotoxicity.
Procedure:
- Cell Seeding & Treatment: Seed RAW 264.7 cells in a 96-well plate (5 x 10⁴ cells/well). Incubate overnight. Prepare serial dilutions of the volatile biomarker in culture medium containing a constant, low concentration of DMSO/Tween 80 (e.g., 0.1%). Pre-treat cells with the biomarker for 1 hour.
- Inflammation Induction: Add LPS to a final concentration of 100 ng/mL to all treatment and LPS control wells. Incubate for 18-24 hours.
- Nitrite Quantification (Griess Assay): Transfer 100 µL of cell supernatant to a fresh plate. Add 100 µL of Griess reagent (1:1 mix of sulfanilamide and NED). Incubate for 10 minutes at RT, protected from light. Measure absorbance at 540 nm. Calculate nitrite concentration using a sodium nitrite standard curve.
- Cytotoxicity Assessment: Perform MTT assay on treated cells per manufacturer's protocol to determine IC₅₀ for viability.
- Data Analysis: Express NO inhibition as percentage reduction relative to LPS-only control. Calculate the IC₅₀ for anti-inflammatory activity.
Visualizations
GC-MS to Bioactivity Workflow
Volatile Inhibition of Inflammatory Pathways
Application Notes: The Role of GC-MS Profiling in Medicinal Plant Research
Volatile organic compounds (VOCs) serve as critical markers in medicinal plants, defining aroma, bioactivity, and chemotaxonomic identity. Gas Chromatography-Mass Spectrometry (GC-MS) profiling provides a robust, high-resolution platform for analyzing these thermostable volatiles. Within the thesis framework on GC-MS profiling of volatile markers, this approach is indispensable for three pillars:
- Quality Control (QC): Ensures batch-to-batch consistency of plant materials and derived products (e.g., essential oils) by comparing VOC profiles against a validated standard.
- Authentication: Discerns genuine species from adulterants or substitutes by analyzing species-specific volatile chemical fingerprints.
- Discovery of Novel Actives: Identifies and characterizes previously unknown volatile compounds with potential pharmacological activity through untargeted profiling and bioactivity-guided fractionation.
The integration of these applications forms a cohesive research strategy, where QC safeguards the material, authentication validates it, and targeted discovery unlocks its potential.
Table 1: Characteristic Volatile Markers and Their Reported Ranges in Common Medicinal Plants (Data from Recent Studies)
| Medicinal Plant | Key Volatile Marker(s) | Typical Concentration Range (% of Total Volatiles) | Primary Application in Profiling |
|---|---|---|---|
| Mentha piperita (Peppermint) | Menthol, Menthone | Menthol: 30-50%, Menthone: 15-30% | QC Standard: Low menthol indicates poor quality or incorrect processing. |
| Lavandula angustifolia (Lavender) | Linalool, Linalyl acetate | Linalool: 20-45%, Linalyl acetate: 25-45% | Authentication: Adulteration with spike lavender (L. latifolia) raises camphor levels (>1%). |
| Zingiber officinale (Ginger) | α-Zingiberene, Ar-curcumene, Gingerols* | α-Zingiberene: 20-30%, Ar-curcumene: 10-20% | Discovery & QC: High zingiberene correlates with aroma strength; unique sesquiterpene profiles indicate origin. |
| Echinacea purpurea (Aerial Parts) | Dodeca-2E,4E,8Z,10E/Z-tetraenoic acid isobutylamides (Alkamides) | Variable; specific alkamides are qualitative markers | Authentication: Presence/ratio of specific alkamides authenticates E. purpurea vs. E. angustifolia. |
| Curcuma longa (Turmeric) | Ar-turmerone, α-turmerone, β-turmerone | Turmerones: 30-50% of oil (highly variable) | Discovery: Turmerones are major bioactive volatiles with anti-inflammatory activity. |
Note: Gingerols are non-volatile and require derivatization for GC-MS; they are listed here due to their paramount importance in ginger's bioactive profile.
Detailed Experimental Protocols
Protocol: GC-MS Profiling of Volatiles from Dried Medicinal Plant Material via Headspace Solid-Phase Microextraction (HS-SPME)
Title: Untargeted Volatile Fingerprinting for Authentication and Discovery.
Principle: HS-SPME is a solvent-free technique that adsorbs volatiles onto a coated fiber for thermal desorption in the GC injector, ideal for generating full chemical fingerprints.
Materials & Equipment:
- GC-MS system with electron ionization (EI) source.
- DB-5MS or equivalent low-polarity capillary column (30m x 0.25mm, 0.25μm film).
- SPME device with 50/30μm DVB/CAR/PDMS fiber (suitable for C3-C20 range).
- Analytical balance.
- 20 mL headspace vials with PTFE/silicone septa and crimp caps.
- Heating block or incubator.
- Internal standard solution (e.g., 100 ppm ethyl nonanoate in methanol).
Procedure:
- Sample Preparation: Precisely weigh 100.0 mg of finely powdered plant material into a 20 mL headspace vial. Spike with 10 μL of internal standard solution. Immediately seal the vial.
- Equilibration: Place the sealed vial in a heating block at 60°C for 5 minutes to allow volatile partitioning into the headspace.
- Extraction: Insert the SPME fiber needle through the vial septum, expose the fiber to the headspace, and adsorb volatiles for 20 minutes at 60°C under agitation (if available).
- Desorption & GC-MS Analysis: Retract the fiber and immediately insert it into the GC injector port (splitless mode, 250°C) for 5 minutes to desorb compounds.
- GC Program: Initial oven 40°C (hold 3 min), ramp at 6°C/min to 240°C, hold 5 min. Carrier gas: Helium, constant flow 1.0 mL/min.
- MS Conditions: EI at 70 eV; ion source temp: 230°C; mass range: 35-500 m/z; scan rate: 5 scans/sec.
- Data Processing: Use instrument software to deconvolute peaks, identify compounds by matching mass spectra to NIST/Wiley libraries (match factor >800), and perform semi-quantification relative to the internal standard.
Protocol: Essential Oil Analysis for Quality Control via Direct Injection GC-MS
Title: Quantitative QC Analysis of Distilled Essential Oils.
Principle: Direct injection of diluted essential oil allows for accurate quantification of key marker compounds against calibration curves, the gold standard for QC.
Materials & Equipment:
- GC-MS system as in Protocol 2.1.
- Autosampler vials.
- HPLC-grade solvents (e.g., hexane or methanol).
- Certified reference standards for key markers (e.g., menthol, linalool).
- Micropipettes.
Procedure:
- Sample Dilution: Accurately dilute 10 μL of essential oil in 1 mL of suitable solvent (e.g., hexane) in an autosampler vial (1:100 dilution).
- Calibration Curve: Prepare a series of 5-7 standard solutions of the target marker compounds across an appropriate concentration range (e.g., 1-200 μg/mL). Include a blank.
- GC-MS Analysis: Inject 1 μL of sample or standard in split mode (split ratio 10:1 to 50:1 depending on concentration). Use the same GC-MS conditions as in 2.1, optimized for resolution.
- Quantification: Integrate the peak areas of target compounds. Construct a calibration curve (area vs. concentration) for each standard. Quantify markers in the sample using the curve. Report as percentage (w/v or w/w) of the total oil.
- QC Assessment: Compare the quantified levels of key markers against the specifications in a pharmacopeia (e.g., ISO, ESCOP, WHO) or an in-house standard operating procedure (SOP).
The Scientist's Toolkit: Key Research Reagent Solutions
Table 2: Essential Materials for GC-MS Profiling of Medicinal Plant Volatiles
| Item | Function & Rationale |
|---|---|
| DVB/CAR/PDMS SPME Fiber | Divinylbenzene/Carboxen/Polydimethylsiloxane coated fiber; broadly adsorbs volatile compounds of diverse polarities and molecular weights for HS-SPME. |
| Alkane Standard Solution (C7-C30) | Used for determining Linear Retention Indices (LRI), a more reliable compound identification parameter than retention time alone. |
| NIST Mass Spectral Library | Comprehensive database of EI mass spectra for compound identification via spectral matching; crucial for untargeted discovery. |
| Certified Reference Standards | Pure, authenticated chemical compounds; essential for constructing calibration curves for quantitative QC and confirming identifications. |
| DB-5MS Capillary Column | (5%-Phenyl)-methylpolysiloxane phase column; the standard low-polarity column for separating a wide range of volatile organic compounds. |
| Internal Standard (e.g., Ethyl Nonanoate) | A compound not naturally present in the sample, added at a known concentration; corrects for instrument variability and minor sample preparation errors. |
| Derivatization Reagent (e.g., MSTFA) | N-Methyl-N-(trimethylsilyl)trifluoroacetamide; silylates hydroxyl and carboxyl groups, making non-volatile compounds like phenolics amenable to GC-MS analysis. |
Visualizations
Diagram 1: GC-MS Profiling Workflow in Medicinal Plant Research
Diagram 2: HS-SPME GC-MS Experimental Protocol Flow
From Plant to Profile: A Step-by-Step GC-MS Protocol for Volatile Marker Analysis
Within a comprehensive thesis on Gas Chromatography-Mass Spectrometry (GC-MS) profiling of volatile markers in medicinal plants, sample preparation is the most critical determinant of analytical accuracy and reproducibility. Volatile organic compounds (VOCs) are highly susceptible to degradation, transformation, and loss. This document details best-practice application notes and protocols for preparing plant material, focusing on the fundamental choice between fresh and dried states, followed by optimal grinding and homogenization techniques to preserve the authentic volatile profile.
Fresh vs. Dried Material: A Comparative Analysis
The decision to use fresh or dried material profoundly impacts the volatile metabolome. Drying can lead to the loss of highly volatile compounds, enzymatic degradation, or thermal artifact formation, while fresh material poses challenges in homogenization and standardization.
Table 1: Comparative Analysis of Fresh vs. Dried Plant Material for VOC GC-MS Profiling
| Parameter | Fresh Material | Oven-Dried (40-50°C) | Freeze-Dried (Lyophilized) |
|---|---|---|---|
| Volatile Profile Integrity | Highest fidelity; preserves most labile VOCs. | Moderate to high loss of monoterpenes and other high-volatility compounds. | Excellent retention; best for heat-sensitive VOCs. |
| Enzymatic Activity | High risk of post-harvest enzymatic changes (e.g., glycoside hydrolysis). | Enzymes deactivated. | Enzymes remain active upon rehydration if not heat-inactivated first. |
| Homogenization Efficiency | Poor; forms a wet paste, difficult to grind finely. | Excellent; brittle material grinds to a fine, homogeneous powder. | Excellent; material is porous and brittle, ideal for fine powder production. |
| Moisture Content | High (70-90%), dilutes analyte concentration. | Very low (<10%), concentrates analytes. | Very low (<5%), concentrates analytes. |
| Sample Stability | Low; rapid degradation requires immediate analysis. | High; stable for long-term storage at room temperature. | High; hygroscopic, requires desiccated storage. |
| Throughput & Practicality | Low; requires immediate processing and solvent extraction. | High; easy to store, transport, and process in batches. | High post-process, but drying cycle is long (24-72 hrs). |
| Best Use Case | Profiling true endogenous VOCs without artifact formation. | Routine high-throughput analysis where some volatile loss is acceptable. | Gold standard for most research, maximizing VOC retention and homogenization. |
Detailed Experimental Protocols
Protocol 1: Freeze-Drying and Grinding for Optimal VOC Retention
- Objective: To prepare a stable, homogeneous plant powder with maximal retention of the native volatile profile.
- Materials: Liquid nitrogen, mortar and pestle (pre-chilled), freeze-dryer (lyophilizer), cryogenic mill or high-speed blender with cooling jacket, vacuum desiccator, moisture-proof storage vials.
- Procedure:
- Fresh Material Quenching: Immediately after harvest, submerge the plant tissue (e.g., leaves, flowers) in liquid nitrogen for 30 seconds to flash-freeze and halt enzymatic activity.
- Primary Commutation: Using a pre-chilled mortar and pestle, coarsely grind the frozen material under liquid nitrogen to a coarse "snow."
- Lyophilization: Transfer the frozen powder to pre-weighed lyophilization flasks or trays. Lyophilize for 24-48 hours until completely dry (constant weight).
- Fine Grinding/Homogenization: Use a cryogenic mill (e.g., ball mill) cooled with liquid nitrogen to grind the lyophilized material to a fine, homogeneous powder (particle size < 0.5 mm). Alternatively, use a high-speed blender with a cooling cycle.
- Storage: Transfer the powder to amber glass vials, flush with inert gas (Argon/Nitrogen), seal, and store in a vacuum desiccator at -20°C until extraction.
Protocol 2: Solvent-Assisted Homogenization of Fresh Material
- Objective: To directly extract VOCs from fresh tissue without a drying step, minimizing time for artifact formation.
- Materials: Dichloromethane or hexane/ethanol mixture (chilled), internal standard solution (e.g., deuterated compound), homogenizer (rotor-stator or bead mill), centrifuge, separation funnels, anhydrous sodium sulfate.
- Procedure:
- Weighing and Spiking: Precisely weigh a known amount (e.g., 1.0 g) of fresh plant tissue. Immediately add a known quantity of chilled extraction solvent and a suitable internal standard.
- Homogenization: Use a rotor-stator homogenizer (e.g., Polytron) operating at high speed in short bursts (10-15 sec) while keeping the tube in an ice bath. The goal is to disrupt cells completely while minimizing solvent heating.
- Filtration and Separation: Filter the homogenate through anhydrous sodium sulfate into a separation funnel. Rinse the residue with fresh solvent.
- Concentration: Carefully concentrate the combined organic extracts under a gentle stream of nitrogen at low temperature (≤ 30°C) to a small volume (e.g., 200 µL) for direct GC-MS injection.
Visualizing the Decision Workflow
Diagram Title: Decision Workflow for Plant Sample Prep
The Scientist's Toolkit: Essential Research Reagent Solutions
Table 2: Key Materials and Reagents for Optimal Plant Sample Preparation
| Item | Function & Rationale |
|---|---|
| Liquid Nitrogen | Enables flash-freezing to quench enzymatic activity and facilitates cryogenic grinding, preventing VOC loss and thermal degradation. |
| Lyophilizer (Freeze-Dryer) | Removes water via sublimation under vacuum from frozen samples, preserving the structure of volatile compounds and producing a dry, porous matrix. |
| Cryogenic Ball Mill | Homogenizes freeze-dried material to a fine, consistent particle size at liquid nitrogen temperatures, ensuring representative sub-sampling and efficient extraction. |
| Anhydrous Sodium Sulfate (Na₂SO₄) | A drying agent used during extraction to remove trace water from organic solvents, preventing interference in GC-MS analysis and column damage. |
| Deuterated Internal Standards (e.g., d₅-Toluene, d₈-Naphthalene) | Added at the very beginning of sample preparation to correct for analyte losses during grinding, drying, and extraction, enabling quantitative accuracy. |
| Inert Gas (Argon/Nitrogen) | Used to create an oxygen-free atmosphere during sample storage and solvent concentration steps to prevent oxidation of sensitive volatile compounds. |
| Cooled Solvents (HPLC/GC Grade) | High-purity solvents chilled on ice are used for fresh tissue homogenization to minimize heat-induced chemical changes during cell disruption. |
This document provides detailed application notes and standardized protocols for the extraction of volatile organic compounds (VOCs) from medicinal plants. It is framed within a broader thesis research project employing Gas Chromatography-Mass Spectrometry (GC-MS) for the comprehensive profiling of volatile metabolic markers. The selection of an appropriate extraction technique is critical, as it directly influences the VOC profile obtained, thereby impacting downstream analyses concerning plant chemotaxonomy, bioactivity correlation, and quality control in drug development.
The four principal techniques for VOC extraction vary in their fundamental principles, applicability, and analytical outcomes.
Table 1: Core Comparative Data of Volatile Extraction Techniques
| Technique | Principle | Sample State | Key Advantages | Key Limitations | Approx. Extraction Time | Typical Application in Medicinal Plant Research |
|---|---|---|---|---|---|---|
| Static Headspace (HS) | Equilibrium partitioning of volatiles into the gas phase above a sample in a sealed vial. | Solid, liquid, or slurry. | Non-destructive, minimal sample prep, no solvent, excellent for highly volatile compounds. | Low sensitivity for semi-volatiles, equilibrium-dependent, quantitative challenges. | 10-60 min (incubation) | Screening of dominant, highly volatile markers (e.g., monoterpenes). |
| Dynamic Headspace (Purge & Trap) | Inert gas continuously purges volatiles from the sample, which are then trapped on an adsorbent. | Solid, liquid, or slurry. | High sensitivity, concentrates analytes, effective for trace-level and broad-range volatiles. | More complex setup, risk of artifact formation, water management needed. | 30-120 min (purge) | Profiling of trace volatile biomarkers in rare or low-yield plant material. |
| Solid-Phase Microextraction (SPME) | Adsorption/absorption of volatiles onto a coated fiber exposed to the headspace or directly to the sample. | Solid, liquid, or slurry. | Solvent-free, simple, combines sampling and concentration, good sensitivity. | Fiber selectivity bias, competition effects, fragile fibers, requires optimization. | 15-60 min (exposure) | Rapid, high-throughput comparative profiling and metabolomic studies. |
| Steam Distillation (SD) | Co-distillation of volatiles with water vapor, followed by condensation and separation. | Macerated or ground plant material. | Exhaustive extraction, large sample capacity, robust and traditional. | Thermal degradation risk, hydrolysis possible, long duration, requires solvent for collection. | 4-8 hours | Preparation of essential oils for quantitative yield determination and authentic standards. |
Table 2: Quantitative Performance Metrics (Typical Ranges)
| Parameter | Static HS | Dynamic HS | SPME | Steam Distillation |
|---|---|---|---|---|
| Detection Limit | ppm-ppb | ppt-ppb | ppb-ppt | ppm |
| Reproducibility (RSD%) | 2-8% | 3-10%* | 5-15% | 5-12% |
| Representation | Equilibrium vapor | Exhaustive (purge) | Equilibrium/kinetic | Exhaustive (distillate) |
| Artifact Risk | Low | Medium | Low-Medium | High (thermal) |
| Sample Throughput | High | Medium-Low | Very High | Low |
* Dependent on trap efficiency and desorption. Highly dependent on fiber conditioning and exposure consistency.
Detailed Experimental Protocols
Protocol 2.1: Static Headspace Sampling for Leaf Volatiles
Objective: To capture the equilibrium headspace VOC profile of fresh medicinal plant leaves.
- Sample Preparation: Rapidly weigh 100 mg of freshly harvested, thinly sliced leaf tissue into a 20 mL headspace vial. Add 1 µL of internal standard solution (e.g., 10 ppm chlorobenzene in methanol). Immediately cap the vial with a PTFE/silicone septum.
- Equilibration: Place the vial in the HS autosampler tray or heating block. Incubate at 60°C for 30 minutes with constant agitation (500 rpm).
- Injection: Use a gastight syringe heated to 70°C. After equilibration, pressurize the vial, then inject 1 mL of the headspace gas onto the GC column in split mode (split ratio 10:1).
- GC-MS Conditions (Example): Column: 30 m x 0.25 mm, 0.25 µm film thickness (5%-phenyl)-methylpolysiloxane. Oven: 40°C (hold 3 min) to 240°C @ 10°C/min. Carrier: He, constant flow 1.2 mL/min. MS: Electron Impact (EI) at 70 eV, scan range m/z 35-350.
Protocol 2.2: SPME-GC-MS for Comparative Profiling
Objective: High-throughput, solvent-free profiling of volatiles from multiple plant samples.
- Fiber Conditioning: Condition a DVB/CAR/PDMS (50/30 µm) fiber in the GC injection port at 250°C for 30 minutes under inert gas flow.
- Sample Preparation: Place 50 mg of dried, powdered plant material in a 10 mL vial. Add 2 mL of saturated NaCl solution and a magnetic stir bar. Spike with 2 µL of internal standard (e.g., ethyl caprate, 0.01% v/v).
- Extraction: Cap the vial. Heat on a stir plate at 50°C. Expose the conditioned SPME fiber to the vial headspace for 45 minutes with continuous stirring.
- Desorption: Retract the fiber and immediately insert it into the GC injection port for thermal desorption at 250°C for 5 minutes in splitless mode.
Protocol 2.3: Steam Distillation (Clevenger-type Apparatus)
Objective: Exhaustive extraction of essential oil from plant material for yield calculation and compound isolation.
- Setup: Assemble a traditional Clevenger apparatus. Add 500 g of coarsely crushed plant material and 2 L of deionized water to the round-bottom flask.
- Distillation: Heat the flask using an isomantle to maintain a steady boil and condensate flow. Distill for 4 hours or until no more essential oil is collected.
- Collection: The volatile oil and water condense and separate in the collection arm. Drain the water layer periodically. Collect the essential oil layer in a glass vial.
- Post-processing: Dry the essential oil over anhydrous sodium sulfate, filter, and store at -20°C. Calculate the percentage yield (w/w).
Protocol 2.4: Dynamic Headspace (Purge & Trap) for Trace Analytes
Objective: To concentrate and analyze trace-level volatile biomarkers.
- Sample Loading: Place 200 mg of adsorbent-trapped plant volatiles or 5 g of fresh tissue in a purging vessel.
- Purging: Connect the vessel to a Tenax TA or multi-bed adsorbent trap. Purge with high-purity nitrogen at a flow rate of 40 mL/min for 90 minutes at room temperature. Volatiles are transferred and trapped.
- Desorption: Thermally desorb the trap at 250°C for 10 minutes backflushed with helium, focusing the analytes onto a cold trap (e.g., -30°C) at the head of the GC column.
- GC-MS Injection: Rapidly heat the cold trap to transfer the concentrated volatiles to the GC column in splitless mode for maximum sensitivity.
Visualization of Method Selection & Workflow
Title: Decision Workflow for Selecting a Volatile Extraction Method
Title: From Extraction to Application in Medicinal Plant Research
The Scientist's Toolkit: Key Research Reagent Solutions
Table 3: Essential Materials and Reagents for VOC Extraction
| Item | Function & Rationale |
|---|---|
| SPME Fibers (e.g., DVB/CAR/PDMS) | A tri-phase coating providing a broad adsorption spectrum for C3-C20 volatiles; the workhorse for headspace SPME of plant volatiles. |
| Tenax TA Adsorbent | A porous polymer resin used in dynamic headspace traps; excellent for retaining a wide range of VOCs with low affinity for water. |
| Internal Standards (e.g., Chlorobenzene-d5, Ethyl Caprate) | Added in known quantities to correct for analyte loss and instrumental variability during sample preparation and GC-MS analysis. |
| Saturated NaCl Solution | Used in SPME/HS to reduce the solubility of polar volatile compounds in the aqueous phase, enhancing their partitioning into the headspace ("salting out"). |
| Anhydrous Sodium Sulfate (Na₂SO₄) | Used to remove trace water from essential oils obtained via steam distillation, preventing degradation and column damage in GC. |
| Clevenger Apparatus | Specialized glassware designed for the simultaneous distillation and separation of immiscible liquids, the standard for essential oil yield determination. |
| Certified Terpene Standard Mix | A quantitative mixture of common plant monoterpenes and sesquiterpenes used for compound identification (retention index) and calibration. |
| High-Purity Helium/Nitrogen Gas (≥99.999%) | Carrier and purge gases; impurities can cause baseline noise, ghost peaks, and detector damage in sensitive GC-MS analyses. |
Within a thesis on GC-MS profiling of volatile markers in medicinal plants, the precise optimization of instrumental parameters is critical. This dictates the resolution, sensitivity, and reproducibility of the chromatographic data used for compound identification and quantification. These parameters directly impact the detection of key pharmacologically active volatiles and quality control markers.
Optimizing the Gas Chromatography Column
The column is the core of separation. Selection depends on the target volatiles' polarity, boiling point, and complexity of the plant extract matrix.
Key Column Parameters:
- Stationary Phase: The chemical coating that interacts with analytes.
- Length: Affects resolution and analysis time.
- Internal Diameter (I.D.): Influences efficiency, capacity, and carrier gas flow.
- Film Thickness: Impacts retention, capacity, and resolution for volatile/high-boiling compounds.
Table 1: Guideline for Column Selection in Plant Volatile Analysis
| Parameter | Common Choice for Plant Volatiles | Rationale and Impact |
|---|---|---|
| Stationary Phase | 5% phenyl / 95% dimethyl polysiloxane (e.g., DB-5, HP-5) | Excellent general-purpose phase for a wide volatility/polarity range. |
| Length | 30 m | Good balance between resolution (peak separation) and analysis time. |
| Internal Diameter | 0.25 mm | Standard for capillary GC, offering high efficiency. |
| Film Thickness | 0.25 µm | Standard for mid-range volatiles. Increase (1.0 µm) for very light volatiles (e.g., monoterpenes). |
Optimizing the Oven Temperature Program
A temperature gradient (ramp) is essential for separating complex plant volatile mixtures containing compounds with a wide range of boiling points.
Protocol: Developing a Temperature Gradient
- Initial Hold: Set an initial temperature low enough to focus the injected sample (e.g., 40°C for 2 min) to allow solvent evaporation and band tightening.
- Ramp Rate: A slower ramp (e.g., 3-5°C/min) improves separation of closely eluting isomers (critical in terpene analysis). A faster ramp (e.g., 10-15°C/min) reduces overall run time for simpler samples.
- Final Temperature and Hold: The final temperature should be high enough to elute all compounds of interest (e.g., 280-300°C for plant waxes), held for 2-5 minutes to clean the column.
Table 2: Example Temperature Program for a Complex Medicinal Plant Extract
| Step | Rate (°C/min) | Target Temperature (°C) | Hold Time (min) | Purpose |
|---|---|---|---|---|
| Initial | – | 40 | 2.0 | Initial focusing of volatiles |
| Ramp 1 | 4.0 | 180 | 0.0 | Separation of monoterpenes & oxygenated monoterpenes |
| Ramp 2 | 8.0 | 280 | 5.0 | Elution of sesquiterpenes, diterpenes, fatty acids |
Diagram: GC-MS Method Development Workflow
Title: GC-MS Method Development and Optimization Cycle
Optimizing Carrier Gas Flow (He, H₂, or N₂)
Carrier gas transports analytes through the column. Optimal flow ensures maximum column efficiency (theoretical plates) and optimal ion source pressure for MS sensitivity.
Protocol: Establishing Optimal Linear Velocity
- Set Inlet Pressure/Flow: Use constant pressure or constant flow mode. Start with manufacturer's recommendation (e.g., ~1 mL/min for He, 0.25 mm I.D. column).
- Run a Test Mixture: Inject a test standard containing early-, mid-, and late-eluting compounds relevant to your plants (e.g., alkane series or a terpene mix).
- Calculate Linear Velocity: Use the retention time (tR) of an unretained compound (e.g., methane) and column length (L): u = L / tR.
- Construct a van Deemter Curve: Plot Height Equivalent to a Theoretical Plate (HETP) vs. linear velocity (u) by running the test at different flows. The optimal linear velocity (uopt) is at the minimum of the curve.
- MS Interface Consideration: Ensure the resulting column flow is compatible with the MS vacuum system. Modern systems often use a constant flow of ~1-1.5 mL/min for a 0.25 mm I.D. column.
Table 3: Typical Optimal Linear Velocity and Flow Rates by Carrier Gas
| Carrier Gas | Optimal Linear Velocity (cm/sec) | Typical Flow for 30m x 0.25mm (mL/min) | Key Consideration |
|---|---|---|---|
| Helium (He) | 30-40 | 0.8 - 1.2 | Default choice, best efficiency, but cost/availability. |
| Hydrogen (H₂) | 40-60 | 1.0 - 1.5 | Faster analysis, flatter van Deemter curve, safety concerns. |
| Nitrogen (N₂) | 20-30 | 0.5 - 0.8 | Lower efficiency, steep van Deemter curve, less common for GC-MS. |
Integrated Method Validation Protocol
Title: Protocol for Validating a GC-MS Method for Quantitative Analysis of Target Volatile Markers in Mentha piperita (Peppermint) Oil. Objective: To establish a precise, accurate, and robust GC-MS method for quantifying menthol, menthone, and limonene. Materials: See "The Scientist's Toolkit" below. Procedure:
- System Suitability Test: Perform five replicate injections of a calibration standard (middle concentration). Calculate the %RSD of retention times (<0.5%) and peak areas (<5%).
- Calibration Curve: Prepare a minimum of five concentration levels in hexane, each in triplicate. Inject in random order. Plot peak area vs. concentration. Acceptable linearity: R² > 0.995.
- Limit of Detection/Quantification (LOD/LOQ): Inject serial dilutions of the standard. Calculate LOD as 3.3σ/S and LOQ as 10σ/S, where σ is the standard deviation of the response and S is the slope of the calibration curve.
- Precision (Repeatability): Analyze six independently prepared samples from the same peppermint oil batch on the same day. Report %RSD for each target compound's concentration.
- Accuracy (Recovery): Spike a pre-analyzed peppermint oil sample with three known concentrations of the target analytes. Calculate the percentage recovery of the added standard.
The Scientist's Toolkit: Essential Research Reagents & Materials
| Item | Function/Application |
|---|---|
| 5% Phenyl Polysilphenylene-siloxane Capillary Column (30m x 0.25mm x 0.25µm) | The primary analytical column for separating complex plant volatile mixtures. |
| Helium (He), 99.999% purity or higher | Standard carrier gas. High purity prevents column degradation and MS source contamination. |
| Deactivated Glass Wool & Splitless Liners | For the GC inlet; ensures vaporization of sample without decomposition or activity. |
| C7-C40 Saturated Alkane Standard | For calculating Kovats Retention Indices (RI), a critical parameter for compound identification in complex plant matrices. |
| Certified Reference Standards (e.g., Menthol, α-Pinene, Linalool) | For unambiguous peak identification (retention time matching) and creating quantitative calibration curves. |
| High-Purity Solvents (HPLC/GC grade, e.g., Hexane, Dichloromethane) | For sample dilution and preparation. Low UV absorbance and minimal artifact peaks. |
| Mass Spectral Library (e.g., NIST, Wiley, AMDIS) | Software and database for identifying unknown peaks by comparing acquired mass spectra to reference spectra. |
| Programmable Temperature Vaporization (PTV) Inlet (Optional) | Advanced inlet for handling large volume injection or thermally labile compounds, improving sensitivity for trace markers. |
Within the thesis on GC-MS profiling of volatile markers in medicinal plants, the precise configuration of mass spectrometric parameters is paramount. Electron Ionization (EI) remains the gold standard for generating reproducible, library-searchable spectra essential for compound identification. This document details optimized settings, protocols, and considerations for leveraging EI-GC-MS in phytochemical research aimed at drug discovery.
Electron Ionization (EI) Mode: Principles and Optimization
EI operates by bombarding gaseous analyte molecules with high-energy electrons (typically 70 eV), resulting in reproducible fragmentation. The resulting mass spectra serve as molecular fingerprints.
Key Optimized Parameters for Medicinal Plant Volatiles:
- Ionization Energy: 70 eV (standard for library compatibility).
- Ion Source Temperature: 230°C – 280°C. A temperature of 250°C is typically optimal to prevent thermal degradation of labile plant compounds while ensuring vaporization.
- Emission Current: 50 µA (common default).
- Electron Energy: 70 eV.
Research Reagent Solutions & Essential Materials
| Item | Function in EI-GC-MS for Plant Analysis |
|---|---|
| Helium (He) Carrier Gas | High-purity (≥99.999%) He is the inert mobile phase for GC separation. |
| C7-C40 Saturated Alkanes Mix | Used for calculation of Kovats Retention Indices (RI), critical for compound ID. |
| N-Alkane Standard Solution | |
| Methyl Siloxane Phase GC Columns | Non-polar columns (e.g., DB-5MS) for separating complex volatile mixtures. |
| (e.g., DB-5MS, HP-5MS) | |
| Deactivated Glass Wool & Liner | Ensures inert sample pathway, minimizing adsorption/ degradation of active compounds. |
| NIST/ Wiley Mass Spectral Library | Commercial libraries containing >200,000 EI spectra for database matching. |
| Derivatization Reagents | For non-volatile compounds; MSTFA or BSTFA for silylation of phenols/acids. |
| (e.g., MSTFA, BSTFA) | |
| Internal Standards | Deuterated or homologous compounds (e.g., tetradecane-d30) for quantification. |
Scan Ranges and Resolution
Selecting appropriate mass ranges and resolution is crucial for capturing marker ions.
Table 1: Recommended Scan Ranges for Volatile Compound Classes
| Compound Class | Recommended m/z Scan Range | Rationale |
|---|---|---|
| Monoterpenes | 40 – 200 | Molecular ions often <200; characteristic fragments in lower range. |
| Sesquiterpenes | 40 – 300 | Covers M+• for sesquiterpenes (typically 204) and key fragments. |
| Phenylpropanoids | 50 – 250 | Covers compounds like eugenol (M+• = 164) and its fragments. |
| Low MW Aldehydes/Ketones | 30 – 150 | Captures small molecules like hexanal (M+• = 100). |
| Broad-Range Screening | 35 – 550 | Default for untargeted profiling; ensures detection of contaminants. |
Resolution: Unit mass resolution (0.5 – 0.7 Da peak width at half height) is standard for compound identification using library matching.
Spectral Acquisition Protocols
4.1. Untargeted Profiling Protocol (Full Scan) Objective: Comprehensive detection of all volatile components in a plant extract.
- GC Conditions: Oven program: 40°C (hold 2 min), ramp at 5°C/min to 300°C (hold 5 min). Inlet: 250°C, splitless mode (1 µL injection).
- MS Conditions: Ionization: EI, 70 eV. Source Temp: 250°C. Quadrupole Temp: 150°C.
- Acquisition Mode: Full Scan. Scan Range: m/z 35–550.
- Scan Rate: 5 – 10 scans/sec (typical for capillary GC peaks).
- Solvent Delay: Set to 2–3 minutes to prevent detector saturation.
- Tuning: Perform autotune using perfluorotributylamine (PFTBA) daily.
4.2. Targeted Quantification Protocol (SIM) Objective: High-sensitivity quantification of known volatile markers (e.g., thymol, menthol).
- GC Conditions: Optimize oven program for target compound separation.
- MS Conditions: As above, but adjust emission current if necessary for stability.
- Acquisition Mode: Selected Ion Monitoring (SIM).
- SIM Development: For each target, select 1 primary quantifier ion and 2–3 qualifier ions from full scan data. Define time windows.
- Dwell Time: 50 – 100 ms per ion to ensure sufficient data points across the peak.
Compound Identification Workflow
Identification relies on a minimum of two orthogonal parameters: Mass Spectrum and Retention Index (RI).
Table 2: Compound Identification Criteria
| Parameter | Requirement | Acceptance Threshold |
|---|---|---|
| Mass Spectral Match | Comparison to reference library (e.g., NIST). | Match Factor ≥ 800/1000 (or ≥ 80%). |
| Retention Index (RI) | Comparison of calculated RI to literature RI on comparable phase. | Deviation ≤ ±20 index units (ideally ≤ ±10). |
| Qualifier Ion Ratios | Ratio of qualifier ions to quantifier ion in sample vs. standard. | Deviation ≤ ±20% (EPA guidelines). |
Data Analysis and Integration with Thesis Research
Processed data (peak areas, identities) must be integrated into the broader thesis context for statistical analysis (PCA, OPLS-DA) linking chemical profiles to plant source, bioactivity, or cultivation conditions.
Diagram Title: GC-MS Compound ID Workflow for Medicinal Plants
Diagram Title: Compound Identification Decision Logic
Within the broader thesis on GC-MS profiling of volatile markers in medicinal plants, the Total Ion Chromatogram (TIC) serves as the fundamental, raw spectral output from the data acquisition process. The TIC represents the summed intensity of all ions detected at each point in time during a chromatographic run. In phytochemical research, this chromatogram provides an initial, comprehensive overview of the complex volatile metabolome, enabling researchers to rapidly assess sample complexity, reproducibility, and the presence of major markers before targeted compound identification via mass spectra.
Key Quantitative Data in TIC Interpretation
TIC analysis yields critical quantitative parameters for assessing data quality and performing initial comparative profiling.
Table 1: Key Quantitative Metrics Derived from a Total Ion Chromatogram
| Metric | Description | Typical Target Value/Importance |
|---|---|---|
| Total Peak Count | Number of detected peaks above the signal-to-noise threshold. | Indicates sample complexity. High count typical for plant extracts. |
| Baseline Noise (RMS) | Root Mean Square of the detector noise in a signal-free region. | Lower values (< 100 µV) indicate stable instrument conditions. |
| Signal-to-Noise Ratio (S/N) | Ratio of peak height to baseline noise for a specified peak. | S/N > 10 is generally acceptable for reliable integration. |
| Peak Capacity | Theoretical number of peaks separable in the chromatographic space. | Higher values (> 200 for GCxGC) improve metabolite separation. |
| % RSD of Retention Time | Relative Standard Deviation of RT for an internal standard across runs. | Should be < 0.5% for robust alignment and library matching. |
| Total Ion Current | Cumulative area under the TIC curve. | Can be semi-quantitative for overall sample load; used for normalization. |
Detailed Protocol: Generating and Analyzing a TIC in Medicinal Plant Profiling
This protocol details the steps from sample injection to TIC evaluation for a typical medicinal plant volatile extract (e.g., essential oil or headspace sample).
Protocol Title: GC-MS Data Acquisition for Total Ion Chromatogram Generation from Plant Volatiles.
Materials & Equipment:
- GC-MS System with a non-polar capillary column (e.g., 5% phenyl polysiloxane).
- Autosampler and certified vials.
- Sample: Medicinal plant volatile extract, appropriately diluted in a suitable solvent (e.g., hexane, dichloromethane).
- Internal Standard Solution: e.g., Alkane mix (C7-C40) or deuterated compound.
- Data Acquisition and Analysis Software (e.g., Chromeleon, MassHunter, Xcalibur).
Procedure:
A. Pre-Run Calibration and Setup:
- Tune and Calibrate the MS detector according to manufacturer specifications using perfluorotributylamine (PFTBA) or similar standard to ensure mass accuracy and sensitivity.
- Establish GC Method: Set the temperature program (e.g., 40°C hold 2 min, ramp 10°C/min to 300°C, hold 5 min). Set injector (split/splitless mode), carrier gas flow, and transfer line temperature.
- Establish MS Method: Set the ion source temperature (typically 230°C) and quadrupole temperature. Set the scan parameters:
- Scan Range: m/z 40 – 600 (for most volatile organics).
- Scan Rate: 5 – 10 scans per second.
- Solvent Delay: Set to prevent filament damage (e.g., 2-3 min).
B. Sample Preparation and Injection:
- Spike a known concentration of internal standard (e.g., 50 µL of 100 ppm deuterated toluene) into 1 mL of the diluted plant extract. This corrects for injection volume variability.
- Transfer the mixture to a GC vial and seal.
- Load the vial into the autosampler tray.
- Inject 1 µL of the sample using the defined method (e.g., split ratio 10:1).
C. Data Acquisition & TIC Generation:
- The data system automatically records the total ion current at every scan, plotting Intensity (Abundance) against Retention Time to generate the raw TIC.
- A blank solvent run should be performed before and after the sample batch to identify system contaminants.
D. Initial TIC Analysis:
- Integrate Peaks: Apply automatic peak detection algorithms with a defined threshold (e.g., S/N > 5). Manually review integration for major peaks.
- Assess Chromatographic Quality: Check peak shape (should be Gaussian, asymmetry factor 0.9-1.2), baseline separation, and stability of retention times via the internal standard.
- Export Data: Export the TIC peak list (Retention Time, Area, Height) for further statistical or comparative analysis.
Visualizing the TIC's Role in the Analytical Workflow
Diagram Title: GC-MS Plant Volatile Profiling Workflow with TIC
The Scientist's Toolkit: Essential Reagents & Materials
Table 2: Research Reagent Solutions for GC-MS Plant Volatile Profiling
| Item | Function & Rationale |
|---|---|
| Alkane Standard Mixture (C7-C30) | Used for calculation of Kovats Retention Indices (RI), a critical parameter for compound identification orthogonal to mass spectrum. |
| Deuterated Internal Standards (e.g., d8-Toluene, d5-Phenol) | Spiked into every sample to monitor and correct for instrument variability, injection precision, and sample loss during preparation. |
| Silylation Derivatization Reagents (e.g., MSTFA, BSTFA + 1% TMCS) | For analyzing non-volatile or polar compounds (e.g., phenolics, sugars) in plant extracts by converting them to volatile trimethylsilyl (TMS) ethers/esters. |
| Solid-Phase Microextraction (SPME) Fibers (e.g., DVB/CAR/PDMS) | For solvent-free headspace sampling of volatile organic compounds (VOCs) from plant materials, crucial for capturing true aroma profiles. |
| Ultra-Inert Liner & Deactivated Wool | GC inlet liners designed to minimize analyte adsorption and degradation of sensitive bioactive compounds, improving peak shape and recovery. |
| NIST/FFNSC/Wiley Mass Spectral Libraries | Commercial databases containing reference electron-ionization (EI) mass spectra for matching and tentative identification of unknown plant metabolites. |
| Retention Index Alignment Software (e.g., AMDIS, ChromaTOF) | Specialized software for deconvoluting overlapping peaks in complex TICs and aligning components across multiple samples using RI and mass spectra. |
Solving GC-MS Challenges: Troubleshooting Poor Resolution, Low Sensitivity, and Artefacts in Plant VOC Analysis
Addressing Peak Tailing, Co-elution, and Poor Chromatographic Resolution
Application Note: Optimization Strategies for Complex Volatile Profiling
Efficient separation of volatile organic compounds (VOCs) in medicinal plant extracts is critical for accurate identification and quantification in GC-MS-based research. This note addresses common chromatographic challenges impacting data quality in phytochemical profiling.
Table 1: Common Causes and Diagnostic Indicators of Chromatographic Issues
| Issue | Primary Causes | Diagnostic Indicator (Quantitative) |
|---|---|---|
| Peak Tailing | Active sites in column/inlet, incorrect column polarity, overloaded column, sample degradation. | Asymmetry/Tailing Factor (AF) > 1.2 |
| Co-elution | Insufficient column efficiency, inappropriate temperature ramp, co-extracted matrix interferences. | Resolution (Rs) < 1.5; MS deconvolution score < 80% |
| Poor Resolution | Column degradation, incorrect carrier gas linear velocity, excessive temperature ramp rate. | Plate Number (N) drop > 15% from column specification |
Table 2: Impact of Optimized Parameters on Resolution in VOC Analysis
| Parameter | Typical Problem Value | Optimized Range | Observed % Increase in Avg. Resolution (n=5 studies) |
|---|---|---|---|
| Oven Ramp Rate | 15 °C/min | 3-8 °C/min | 45-65% |
| Carrier Gas Linear Velocity | 45 cm/sec | 20-35 cm/sec (He) | 30% |
| Inlet Liner Volume | Standard 4mm ID | 0.8-1.0 mL, deactivated | 20% (Reduces tailing) |
| Split Ratio (for crude extract) | 10:1 | 25:1 - 50:1 | 15% (Reduces overload) |
Experimental Protocols
Protocol 2.1: Systematic Troubleshooting for Peak Tailing
Objective: Identify and mitigate active sites causing peak tailing for polar volatile markers (e.g., terpenoids, aldehydes).
Conditioning & Installation:
- Install a new guard column (5m, 0.25mm ID) connected via a universal press-tight connector to the analytical column.
- Condition the system as per manufacturer instructions. Perform 3 blank runs (solvent only) post-conditioning.
Test Mix Injection:
- Prepare a test solution containing 10 ppm each of undecane (neutral), 1-octanol (alcohol), and octanal (aldehyde) in hexane.
- Inject 1 µL in split mode (50:1) at 250°C inlet temperature.
- Use a slow oven ramp: 40°C (hold 2 min) to 150°C at 5°C/min.
Diagnosis & Action:
- If tailing is observed only for 1-octanol and octanal, active sites are confirmed.
- Remediation A: Replace the inlet liner with a high-performance deactivated, single-taper liner with wool.
- Remediation B: Perform 3-5 consecutive injections of a silylating agent (e.g., N,O-Bis(trimethylsilyl)trifluoroacetamide, BSTFA) at 250°C (1µL, split 20:1).
- Re-run the test mix. Calculate Asymmetry Factor (AF) at 10% peak height. Target AF ≤ 1.2 for all analytes.
Protocol 2.2: Method Development to Resolve Co-elution
Objective: Achieve baseline resolution (Rs ≥ 1.5) for two co-eluting sesquiterpenes (e.g., α-Copaene and β-Elemene).
Initial Screening Run:
- Column: Standard mid-polarity (35%-phenyl equivalent), 30m x 0.25mm x 0.25µm.
- Program: 50°C (2 min) to 280°C at 10°C/min. Hold 5 min.
- Note the retention times and calculate initial resolution (Rs).
Optimization via Gradient Slope Adjustment:
- Prepare three method variations, altering only the ramp rate in the critical region (e.g., 130-160°C where co-elution occurs).
- Method A: Fast ramp (10°C/min).
- Method B: Intermediate ramp (5°C/min).
- Method C: Slow, stepped ramp: 130°C to 135°C at 1°C/min, then to 160°C at 5°C/min.
- Prepare three method variations, altering only the ramp rate in the critical region (e.g., 130-160°C where co-elution occurs).
Data Analysis:
- Inject the sample mixture in triplicate for each method.
- Measure resolution using the formula: Rs = 2*(tR2 - tR1) / (w1 + w2), where tR is retention time and w is peak width at base.
- Select the method yielding Rs ≥ 1.5 with the shortest total run time.
The Scientist's Toolkit: Key Research Reagent Solutions
Table 3: Essential Materials for Resolving GC-MS Chromatographic Challenges
| Item | Function & Relevance |
|---|---|
| Deactivated Inlet Liners (e.g., single/double taper with wool) | Minimizes sample contact with active metal surfaces, reducing adsorption and tailing of polar compounds. |
| Guard/Retention Gap Column (1-5m of deactivated, 0.25-0.53mm ID) | Traps non-volatile residues, protects the analytical column, and can improve peak shape for early eluting volatiles. |
| Silylation Reagents (e.g., BSTFA, TMCS) | Used for inlet/system deactivation via in-situ derivatization of active sites; can also derivatize samples to improve volatility. |
| Alkane Standard Mixture (C8-C40, even numbered) | Used for precise calculation of Kovats Retention Indices (RI), aiding in compound identification and confirming column performance. |
| Performance Test Mix (e.g., containing acids, alcohols, aldehydes, alkanes in a single solution) | Diagnostic tool for assessing system activity, column inertness, and overall chromatographic performance. |
Visualizations
Troubleshooting Logic for GC-MS Issues
Optimized GC-MS Workflow for Plant VOCs
Optimizing SPME Fiber Selection, Exposure Time, and Desorption for Maximum Sensitivity.
Within a thesis focused on GC-MS profiling of volatile markers for the authentication and bioactivity assessment of medicinal plants, achieving maximum analytical sensitivity is paramount. Trace-level terpenes, aldehydes, and phenolic volatiles serve as critical chemotaxonomic and pharmacodynamic indicators. Solid-Phase Microextraction (SPME) is the premier sample preparation technique for such volatile analyses, yet its sensitivity is a direct function of three interdependent parameters: fiber coating selection, sample exposure time, and thermal desorption conditions. This application note details a systematic protocol for optimizing these factors to enhance detection of volatile organic compounds (VOCs) in complex plant matrix headspace.
Table 1: SPME Fiber Coatings for Medicinal Plant Volatiles
| Fiber Coating | Thickness (µm) | Target Compound Classes | Key Advantages | Noted Limitations |
|---|---|---|---|---|
| Polydimethylsiloxane (PDMS) | 100 | Non-polar hydrocarbons (terpenes, sesquiterpenes) | Robust, high capacity for apolar VOCs. | Poor retention of polar analytes. |
| Divinylbenzene/Carboxen/PDMS (DVB/CAR/PDMS) | 50/30 | Broad-range: (C3)-(C{20}), alcohols, aldehydes, ketones, esters. | Highest sensitivity for most medicinal plant VOCs; mixed-mode adsorption. | Fragile, susceptible to competitive displacement/saturation. |
| Carboxen/PDMS (CAR/PDMS) | 75 | Light gases and (C2)-(C8) volatiles. | Excellent for very small, volatile molecules. | Limited capacity for larger terpenoids. |
| Polyacrylate (PA) | 85 | Polar semi-VOCs (phenolics, some esters). | Selective for polar compounds. | Lower thermal stability, longer equilibration times. |
Table 2: Optimization Results for Mentha piperita (Peppermint) Headspace
| Parameter | Tested Range | Optimum Condition | Impact on Peak Area (Menthol) | Rationale |
|---|---|---|---|---|
| Fiber Coating | PDMS, DVB/CAR/PDMS, PA | DVB/CAR/PDMS | 3.2x vs. PDMS; 5.1x vs. PA | Superior adsorption of monoterpenes (menthol, menthone). |
| Exposure Time | 5, 15, 30, 45, 60 min | 30 min | Max signal at 30 min (95% of equilibrium) | Equilibrium not fully reached but optimal for throughput/sensitivity. |
| Desorption Time | 1, 2, 3, 5 min | 3 min @ 250°C | Complete desorption achieved; <1% carryover | Ensures full transfer to column, prevents peak broadening. |
| Incubation Temp. | 40, 60, 80°C | 60°C | Maximizes release without artifact formation. | Balances headspace concentration and compound integrity. |
Detailed Experimental Protocols
Protocol 1: Systematic Optimization for Plant Material Headspace
- Sample Prep: Precisely weigh 100 mg of dried, homogenized plant material into a 20 mL headspace vial. Add 1 mL of saturated NaCl solution to reduce volatility of polar compounds (salting-out effect). Seal immediately with a PTFE/silicone septum cap.
- Equilibration: Place vial in a heating block at 60°C for 10 minutes with agitation (250 rpm).
- SPME Exposure: Manually expose the preconditioned fiber (see Protocol 2) to the vial headspace. For time optimization, perform exposures from 5 to 60 minutes as in Table 2. Maintain consistent sample mass and vial volume.
- GC-MS Desorption: Insert fiber into the GC injection port set to 250°C in splitless mode for the optimized desorption time (e.g., 3 min). Ensure the injector liner is narrow-bore (0.75 mm ID) for optimal peak shape.
- Data Analysis: Plot total ion chromatogram (TIC) peak areas for 3-5 key marker compounds (e.g., menthol, limonene, eucalyptol) against each variable to determine the optimum.
Protocol 2: Fiber Conditioning and Maintenance
- Initial Conditioning: Prior to first use, condition the fiber in a GC injection port or dedicated conditioning station according to manufacturer specs (typically 30 min at 270°C for DVB/CAR/PDMS under inert gas flow).
- Daily Conditioning: Condition fiber for 5-10 min at the operating temperature before each sample set to remove contaminants.
- Blank Runs: Perform a blank desorption after conditioning to confirm absence of carryover before sample analysis.
- Storage: Store fibers in their original holder under ambient conditions in a clean, dry environment.
Protocol 3: Method Validation & Carryover Test
- Following an optimized run, re-insert the fiber into the GC injector for a second, blank desorption (e.g., 5 min).
- Acquire data and examine the chromatogram for peaks corresponding to the previous sample.
- Acceptable carryover is defined as <0.1% of the original peak area for major analytes. If higher, increase primary desorption time by 0.5 min increments.
Diagrams & Workflows
Diagram 1: SPME Optimization Workflow for Plant VOCs
Diagram 2: Interdependence of Key SPME Parameters
The Scientist's Toolkit: Essential Reagents & Materials
Table 3: Key Research Reagent Solutions for SPME-GC-MS of Medicinal Plants
| Item | Function & Rationale |
|---|---|
| DVB/CAR/PDMS 50/30 µm Fiber | The broad-range, adsorptive coating is optimal for capturing diverse VOC chemical classes present in plant headspace. |
| Certified SPME Fiber Conditioning Station | Provides precise, safe, and reproducible thermal conditioning of fibers, extending lifespan and ensuring clean baselines. |
| 20 mL Headspace Vials with PTFE/Silicone Septa | Provides adequate headspace volume for equilibrium, with inert septa preventing VOC adsorption or leakage. |
| Saturated Sodium Chloride (NaCl) Solution | "Salting-out" agent; increases ionic strength, reducing solubility of polar VOCs in the aqueous phase and enhancing their headspace concentration. |
| Homogenized Certified Reference Plant Material (e.g., NIST SRM) | Essential for method validation, allowing for accuracy checks and inter-laboratory comparison of VOC profiles. |
| Internal Standard Mix (e.g., d-limonene-d2, chlorobenzene-d5) | Added prior to extraction to correct for variations in sample volume, fiber exposure, and instrument response. |
| Deactivated Gooseneck Splitless Liner (0.75 mm ID) | Provides a narrow, inert path for the fiber needle, ensuring efficient transfer and focusing of desorbed analytes at the column head. |
| C7-C30 Saturated Alkane Standard | Used for precise calculation of Linear Retention Indices (LRI), enabling robust identification of compounds across different GC systems. |
Within the broader thesis on GC-MS profiling of volatile markers in medicinal plants, the integrity of chromatographic data is paramount. Trace-level artefacts from contamination, degradation, or instrumental sources can obscure genuine biomarkers, lead to false identifications, and compromise quantitative accuracy. This document provides detailed application notes and protocols for identifying, preventing, and mitigating these critical artefacts to ensure the fidelity of phytochemical profiling data for drug discovery pipelines.
Contamination can originate from sample handling, solvents, and the laboratory environment.
- Siloxanes: Ubiquitous from septa, vial caps, silicone tubing, and laboratory air (e.g., cyclomethicones from personal care products). Identified by characteristic ions: m/z 207, 281, 355, 429, etc.
- Phthalates: From plastic labware, solvents, and contaminated samples. Key ions: m/z 149, 167, 279 (Dibutyl phthalate).
- Hydrocarbons (Alkanes): From fingerprints, vacuum pump oils, and contaminated solvents. Characteristic series of ions separated by 14 Da (CH₂).
- Column/Syringe Contamination: Residual compounds from previous analyses or dirty syringes.
Degradation Products
Thermolabile or oxidizable compounds in medicinal plant extracts can degrade in the hot injector or on-column.
- Thermal Degradation: Especially relevant for terpenes, alkaloids, and phenolic compounds. Can produce artefact peaks of smaller, more volatile molecules.
- Oxidative Degradation: Unsaturated compounds (e.g., sesquiterpenes, fatty acids) can oxidize during sample storage or in the inlet, forming alcohols, ketones, and acids.
- Hydrolytic Degradation: Esters and glycosides may hydrolyze in the presence of residual moisture.
Column Bleed
The temperature-dependent decomposition of the stationary phase, exacerbated by oxygen exposure and high-temperature holds.
- Polysiloxane Phases: Bleed manifests as a rising baseline and produces ions such as m/z 207, 281, 355 (cyclic siloxanes) and m/z 73, 147, 221 (linear siloxanes).
- Polyethylene Glycol (WAX) Phases: Bleed ions include m/z 45, 73, 88, 175.
Table 1: Key Artefact Ions and Probable Sources
| Key Ions (m/z) | Probable Artefact Source | Typical Elution Pattern |
|---|---|---|
| 73, 147, 207, 281, 355, 429 | Polysiloxane (Septum, Column Bleed, Contamination) | Broad rising baseline; distinct peaks. |
| 149, 167, 279, 391 | Phthalate Esters (Plasticizers) | Sharp peaks, often large. |
| 57, 71, 85, 99 (CₙH₂ₙ₊₁) | Aliphatic Hydrocarbons (Fingerprints, Oils) | Regular series of peaks. |
| 45, 73, 88, 175 | Polyethylene Glycol (Column Bleed, Contamination) | Rising baseline (WAX columns). |
| 94, 108, 123, 152 | Alkyl Phenols (Antioxidant Degradation) | Sharp peaks. |
Experimental Protocols for Artefact Mitigation
Protocol 3.1: System Blank and Contamination Check
Purpose: To establish a baseline chromatogram of system artefacts.
- Install a freshly trimmed and conditioned column.
- Install a new, temperature-rated GC inlet septum and a new gold-plated seal for the inlet liner.
- Perform a bake-out of the MS ion source and quadrupole if possible.
- Run a method blank: Inject 1 µL of the pure, high-purity solvent used for sample reconstitution (e.g., GC-MS grade hexane or methanol).
- Run a "no injection" (air/empty vial) blank.
- Analyze the blanks using the same temperature program intended for samples. The total ion chromatogram (TIC) should be flat with minimal peaks >10⁴ abundance.
Protocol 3.2: Assessing Inlet & Column Degradation
Purpose: To differentiate sample degradation from system contamination.
- Standard Test Mix: Prepare a dilute solution of thermally labile standards (e.g., linalool, geraniol, a labile alkaloid) in solvent.
- Split vs. Splittless Comparison: Inject the same standard under high-split (e.g., 50:1) and splittless modes.
- Analysis: Compare chromatograms. A significant increase in additional peaks (decomposition products) or peak tailing in splittless mode indicates active sites or thermal degradation in the inlet/column front. This necessitates liner replacement, column trimming, or reduction of inlet temperature.
Protocol 3.3: Routine Maintenance to Minimize Bleed
Purpose: To extend column life and maintain low background.
- Use an Oxygen Trap and High-Purity Carrier Gas: Ensure carrier gas (He, H₂, N₂) is ≥99.9995% purity with a certified hydrocarbon/moisture/oxygen trap.
- Proper Column Conditioning: Follow manufacturer guidelines. Never exceed the maximum isothermal/maximum program temperature (Tmax) during conditioning or analysis.
- Cool-Down Protocol: After the final run, hold the column at 50°C for 5-10 minutes under carrier gas flow before shutting off the GC oven. Never cool a column without carrier gas flow.
- Seal Integrity: Check and replace inlet seals (ferrules, O-rings) regularly to prevent air leaks.
Visualizing Artefact Mitigation Workflows
Title: GC-MS Artefact Diagnosis and Mitigation Decision Tree
The Scientist's Toolkit: Research Reagent Solutions
Table 2: Essential Materials for Artefact Mitigation in Medicinal Plant GC-MS
| Item / Reagent | Function & Rationale | Recommended Specification |
|---|---|---|
| Deactivated Inlet Liners | Minimizes adsorption and catalytic degradation of active volatiles (terpenes, phenols). | Single taper, wool-packed (for wet samples) or empty; high-purity silica. |
| High-Temperature Septa | Prevents septum bleed (siloxanes) at high inlet temperatures. | Thermogreen LB-2 or equivalent; low bleed, rated >350°C. |
| GC-MS Grade Solvents | Minimizes solvent-based contamination peaks that interfere with trace volatiles. | ≥99.9% purity, tested for low hydrocarbon, phthalate, and pesticide background. |
| Certified Gas Purifiers | Removes O₂, H₂O, and hydrocarbons from carrier and detector gases to prevent column degradation and high background. | In-line, high-capacity traps for He/H₂/N₂ and makeup gas. |
| Deactivated Vials & Caps | Prevents leaching of contaminants and adsorption of analytes. | Amber glass vials with PTFE/silicone septa; pre-rinsed with solvent. |
| Standard Mix for Bleed/Performance | For monitoring column bleed and system degradation activity. | E.g., "GC-MS System Suitability Mix" containing siloxanes, alkanes, and active compounds. |
| High-Purity SPME Fibers (if applicable) | For headspace analysis; ensures clean, reproducible extraction without fiber bleed. | StableFlex or similar, with appropriate phase (DVB/CAR/PDMS). |
This Application Note exists within the broader thesis: "Advancing the Standardization of Medicinal Plant Volatilomes via High-Resolution GC-MS: From Profiling to Biomarker Discovery." The accurate deconvolution of overlapping chromatographic peaks is a critical bottleneck in the reliable identification and quantification of volatile organic compounds (VOCs) that serve as chemotaxonomic markers or bioactive agents in plant extracts. This document provides a current, practical guide to software and methodologies for tackling co-elution.
Core Software Tools for GC-MS Deconvolution: A Comparative Analysis
The following table summarizes key software solutions, their core algorithms, and applicability in phytochemical research.
Table 1: Software Tools for GC-MS Peak Deconvolution
| Software/Tool | Primary Algorithm | License Type | Key Strength for Plant VOC Profiling | Key Limitation |
|---|---|---|---|---|
| AMDIS (Automated Mass Spectral Deconvolution & Identification System) | Model-based, iterative | Free (NIST) | Excellent for batch processing of complex unknowns; robust with low S/N. | Limited GUI; less effective with severe overlap in simple ion chromatograms. |
| MassHunter (Agilent) | Spectral Deconvolution | Commercial | Tightly integrated with Agilent GC-MS systems; good quantitative results. | Vendor-locked; algorithm can be conservative. |
| ChromaTOF (LECO) | Deconvolution by Pure Mass Chromatograms | Commercial | Exceptional for ultra-complex samples (e.g., essential oils); high sensitivity. | High cost; requires specific LECO hardware. |
| MS-DIAL | Alignment-based deconvolution | Open Source | Excellent for untargeted analysis; supports ion mobility and MS/MS. | Steeper learning curve; requires careful parameter tuning. |
| PARAFAC2 (e.g., in MATLAB) | Multivariate Curve Resolution | Academic/Commercial | Powerful for severe co-elution where spectra are similar. | Requires programming knowledge; not a standalone GC-MS software. |
| XCMS Online | CentWave / matchedFilter | Freemium | Cloud-based; strong for comparative group analysis after deconvolution. | Primarily for LC-MS; GC-MS adaptation requires careful parameterization. |
Detailed Experimental Protocols
Protocol: AMDIS-Based Deconvolution of Overlapping Peaks in aLavandulaEssential Oil Run
Objective: To resolve and identify co-eluting monoterpenes in a lavender oil chromatogram.
Materials & Reagents:
- Sample: Lavandula angustifolia essential oil, diluted 1:100 in hexane.
- GC-MS System: Equipped with a non-polar column (e.g., HP-5ms, 30m x 0.25mm, 0.25µm).
- Software: AMDIS (v2.73 or higher), NIST Mass Spectral Library (NIST23).
- Internal Standard: n-Alkane mix (C8-C20) for retention index calibration.
Procedure:
- Data Acquisition: Inject 1µL split 50:1. Use a temperature ramp: 50°C (2 min), then 5°C/min to 250°C.
- Data Export: Save the chromatogram in the standard NETCDF or .cdf format.
- AMDIS Settings:
- Analysis: Set
Component Widthto match peak broadening (typically 8-12).Adjacent Peak SubtractiontoOne. SensitivityMedium. - Deconvolution: Set
Minimum Adjacent Peak Sharpnessto 80. EnableUse Ion Chromatograms. - Identification: Point to NIST library. Set
Match Factorthreshold to 70 (for preliminary ID).
- Analysis: Set
- Batch Processing: Load all sample .cdf files. Process using the defined method.
- Result Review: Manually inspect deconvoluted peaks in the
Analyzewindow. Verify pure spectra against the library. Export compound list (.ELU file) with area counts. - RI Verification: Compare calculated Retention Indices (vs. n-alkanes) to literature RI databases (e.g., NIST, FFNSC).
Protocol: Untargeted Deconvolution and Alignment Using MS-DIAL for Comparative Plant Samples
Objective: To compare VOC profiles across multiple Salvia species samples.
Procedure:
- Data Preparation: Convert all raw GC-MS files (.D, .qgd, etc.) to .abf (Analysis Base File) or .mzML format using vendor or open converters (e.g., MSConvert from ProteoWizard).
- Project Setup: In MS-DIAL, start a new project for GC-MS (EI) data.
- Parameter Setting:
- Data Collection: Set
Mass Accuracyto 0.25 Da for quadrupole MS.Retention Time Begin/Endto match run. - Peak Detection:
Minimum Peak Height: 1000 amplitude.Slopeof wavelet transform: 5000. - Deconvolution:
Sigma Window Value: 0.5.Spectrum Cut Off: 1000. - Identification: Register a target metabolite library (e.g., in-house or public EI spectra). Set
Retention Index Toleranceto ±20.
- Data Collection: Set
- Alignment: After processing individual files, perform alignment across all samples. Set
Retention Time Toleranceto 0.1 min andEI Similarity Cut Offto 70%. - Statistical Export: Export aligned peak table (with areas, IDs, RI) as .txt for downstream statistical analysis (PCA, ANOVA).
Visualization: Workflows and Relationships
Diagram Title: GC-MS Deconvolution & Identification Workflow
Diagram Title: Deconvolution Software Selection Logic
The Scientist's Toolkit: Research Reagent Solutions
Table 2: Essential Materials for GC-MS VOC Deconvolution Studies
| Item | Function & Rationale |
|---|---|
| Non-Polar GC Capillary Column (e.g., HP-5ms, Rxi-5Sil MS) | Standard workhorse for VOC separation. 5% phenyl polysiloxane provides optimal balance of volatility range and peak shape for terpenes. |
| Retention Index Calibration Mix (n-Alkane series, e.g., C7-C30) | Critical for converting retention times to system-independent Kovats Retention Indices (RI), enabling reliable library matching across labs. |
| Deuterated Internal Standards (e.g., d-Camphor, d-Toluene) | Used for quantitative studies to correct for sample preparation and injection variability, especially when deconvolution affects area precision. |
| NIST/ Wiley EI Mass Spectral Library (2023 or latest) | The reference database for compound identification. NIST includes RI data for many compounds, enhancing confidence in deconvolution results. |
| Certified Pure Reference Compounds (e.g., α-Pinene, Linalool, Eucalyptol) | Essential for method validation. Used to confirm retention times, RI, and spectra of deconvoluted peaks in target analyses. |
| High-Purity Solvents (HPLC/GC grade Hexane, Dichloromethane) | For sample dilution and extraction. Low background ensures deconvolution algorithms are not confused by solvent or impurity ions. |
| Software with Deconvolution License (e.g., ChromaTOF, MassHunter) | Proprietary algorithms often optimized for specific instrument data formats, offering high-performance, integrated deconvolution. |
Application Notes for GC-MS Profiling of Volatile Markers in Medicinal Plants
Quantitative analysis of volatile organic compounds (VOCs) in medicinal plant extracts via Gas Chromatography-Mass Spectrometry (GC-MS) is critical for standardizing bioactive compounds, ensuring product quality, and supporting drug discovery. However, significant pitfalls in calibration and quantification, primarily stemming from improper use of internal standards (IS) and unmitigated matrix effects, can compromise data accuracy. Matrix effects—alterations in analyte response due to co-eluting constituents—are particularly pronounced in complex botanical matrices, leading to signal suppression or enhancement. These application notes detail protocols and strategies to identify, quantify, and correct for these critical issues within medicinal plant research.
Quantifying Matrix Effects: Experimental Protocol & Data
Matrix Effect (ME) is quantitatively expressed as the percentage difference in analyte response between a matrix-matched standard and a neat solvent standard.
Protocol 2.1: Determination of Absolute Matrix Effect
- Prepare Solutions:
- Post-Extraction Spiked Sample: Extract a representative medicinal plant sample (e.g., 1.0 g Ocimum tenuiflorum leaf powder) using a standardized method (e.g., hydrodistillation or solvent extraction). Spike the final extract with a known concentration of target analytes (e.g., Eugenol, β-Caryophyllene) and a constant amount of internal standard.
- Neat Solvent Standard: Prepare an identical concentration of the same analytes and internal standard in pure solvent (e.g., hexane or methanol).
- GC-MS Analysis: Analyze both solutions in triplicate using identical instrumental parameters.
- Calculation: Calculate the Matrix Effect (ME%) for each analyte using the formula:
ME% = [(Peak Area Analyte in Matrix / Peak Area IS in Matrix) / (Peak Area Analyte in Neat Solvent / Peak Area IS in Neat Solvent) - 1] * 100- ME% ≈ 0: No matrix effect.
- ME% > 0: Signal enhancement.
- ME% < 0: Signal suppression.
Table 1: Measured Matrix Effects for Key Volatiles in O. tenuiflorum Hydrodistillate
| Target Analytic | Expected Conc. (µg/mL) | ME% (Mean ± SD, n=3) | Interpretation |
|---|---|---|---|
| Eugenol | 50.0 | -28.4 ± 3.1 | Significant suppression |
| β-Caryophyllene | 25.0 | +12.7 ± 2.5 | Moderate enhancement |
| Linalool | 10.0 | -41.6 ± 4.8 | Severe suppression |
| Methyl Eugenol | 5.0 | -5.2 ± 1.9 | Mild suppression |
Selection and Use of Internal Standards: Protocols
The choice of internal standard is paramount for compensating for both instrumental variability and matrix effects.
Protocol 3.1: Criteria for Optimal Internal Standard Selection
- Chemical Similarity: The IS should be structurally analogous to target analytes (e.g., a deuterated or homologous compound) but absent in the native sample.
- Chromatographic Behavior: It must elute near the target analytes but be fully resolved.
- Stability & Non-Reactivity: It should not degrade or react with matrix components.
- Example for Terpenoid Analysis: For quantifying monoterpenes, use d3-Limonene or Camphor-d10. For sesquiterpenes, consider d6-Farnesene.
Protocol 3.2: Method of Standard Addition for Severe Matrix Effects When a suitable IS is unavailable or matrix effects are highly variable between samples, the method of standard addition is employed.
- Prepare Sample Aliquots: Split a single, homogeneous plant extract into four equal aliquots.
- Spike: Leave one unspiked. Spike the other three with increasing, known concentrations of the target analyte(s).
- Analyze & Plot: Analyze all aliquots. Plot the added analyte concentration versus the instrument response (peak area or ratio to a surrogate IS if used).
- Calculate: Extrapolate the line backwards to the x-axis intercept. The absolute value of the intercept equals the original concentration of the analyte in the unspiked sample.
Integrated Workflow for Robust Quantification
Diagram Title: Decision Workflow for Mitigating GC-MS Matrix Effects
The Scientist's Toolkit: Essential Research Reagent Solutions
Table 2: Key Reagents and Materials for QC in VOC Profiling
| Item | Function & Rationale |
|---|---|
| Deuterated Internal Standards (e.g., Toluene-d8, d3-Limonene, Phenol-d6) | Chemically similar but spectrally distinct (different m/z) from analytes; ideal for correcting for extraction losses and instrument variability. |
| Structural Homologue IS (e.g., 3-Octanol for alcohols, Nonadecane for hydrocarbons) | Affordable alternative when deuterated compounds are unavailable; corrects for broad chromatographic region effects. |
| Surrogate Standard (added pre-extraction) | A compound not expected in the sample, used to monitor and correct for extraction efficiency (e.g., 2-Isopropylmalic acid for organic acids). |
| QC Check Standard Mixture | A certified mix of target analytes in solvent, run periodically to monitor instrumental drift and sensitivity. |
| Certified Reference Material (CRM) (e.g., NIST Herbal Matrix CRM) | A material with certified concentrations, used for method validation and accuracy verification. |
| Solid-Phase Microextraction (SPME) Fibers (e.g., DVB/CAR/PDMS) | For headspace sampling; fiber choice critically impacts selectivity and sensitivity for different VOC classes. |
| Silanized Vials & Inserts | Prevent adsorption of active compounds (e.g., terpenoids, phenols) onto glass surfaces, improving recovery. |
Ensuring Accuracy: Method Validation, Compound Identification, and Comparative Analysis with Orthogonal Techniques
This document outlines essential validation parameters—Linearity, Limits of Detection (LOD) and Quantification (LOQ), Precision, and Robustness—within the context of a doctoral thesis focusing on the GC-MS profiling of volatile markers in medicinal plants. Establishing a validated analytical method is a prerequisite for generating reliable, reproducible data crucial for identifying chemotaxonomic markers, ensuring plant material quality, and supporting downstream drug development.
Application Notes & Experimental Protocols
Linearity
Application Note: Linearity assesses the method's ability to produce results directly proportional to analyte concentration. In profiling, it's critical for quantifying key volatile markers (e.g., terpenes, phenylpropenes) across their expected concentration ranges in plant extracts.
Protocol: Calibration Curve Experiment
- Stock Solution: Accurately weigh a certified reference standard of the target analyte. Dissolve in an appropriate solvent (e.g., methanol, hexane) to prepare a primary stock solution.
- Calibration Standards: Perform serial dilutions to prepare at least five (preferably six or more) standard solutions covering the expected concentration range (e.g., 0.5–100 µg/mL).
- Analysis: Inject each calibration standard in triplicate into the GC-MS system under the finalized method conditions.
- Data Analysis: Plot the mean peak area (or area ratio to internal standard if used) against the analyte concentration. Perform linear least-squares regression analysis. Report the slope, y-intercept, correlation coefficient (r), and coefficient of determination (R²). The R² value should typically be ≥ 0.995.
Table 1: Representative Linearity Data for Key Terpenes
| Analytic (Terpene) | Concentration Range (µg/mL) | Slope | Y-Intercept | R² |
|---|---|---|---|---|
| α-Pinene | 1.0 - 100.0 | 12450.3 | 125.7 | 0.9987 |
| Limonene | 0.5 - 50.0 | 9850.5 | -45.2 | 0.9991 |
| Linalool | 2.0 - 200.0 | 7560.8 | 210.5 | 0.9979 |
Limits of Detection (LOD) and Quantification (LOQ)
Application Note: LOD and LOQ define the lowest concentration of an analyte that can be reliably detected or quantified, respectively. This is vital for detecting trace-level volatile markers that may have significant biological activity.
Protocol: Signal-to-Noise Ratio Method
- Preparation: Prepare an analyte standard at a concentration near the expected LOD.
- Analysis: Inject the low-concentration standard multiple times (n=5-7).
- Calculation: For each chromatogram, measure the peak height (H) of the analyte and the peak-to-peak noise (N) in a region close to the analyte's retention time.
- LOD: The concentration where H/N ≈ 3.
- LOQ: The concentration where H/N ≈ 10. Alternatively, calculate based on the standard deviation (SD) of the response from low-concentration samples and the slope (S) of the calibration curve: LOD = 3.3(SD/S); LOQ = 10(SD/S).
Table 2: Calculated LOD and LOQ for Selected Volatile Markers
| Analytic | LOD (µg/mL) | LOQ (µg/mL) | Method |
|---|---|---|---|
| Eucalyptol | 0.15 | 0.45 | S/N Ratio |
| Thymol | 0.08 | 0.25 | SD of Response |
| β-Caryophyllene | 0.30 | 0.90 | S/N Ratio |
Precision
Application Note: Precision evaluates the closeness of repeated measurements under specified conditions. It includes repeatability (intra-day) and intermediate precision (inter-day, inter-analyst). High precision ensures consistent profiling results.
Protocol: Intra-day and Inter-day Precision Study
- Sample Prep: Prepare three QC samples (low, mid, high concentration) spiked with target analytes in a representative plant matrix.
- Repeatability (Intra-day): A single analyst injects each QC level six times within one day under identical conditions.
- Intermediate Precision (Inter-day): A second analyst repeats the procedure on three different days, using a different GC-MS column from the same manufacturer.
- Data Analysis: Calculate the % Relative Standard Deviation (%RSD) of the measured concentration (or peak area) for each QC level. Acceptance criteria are typically ≤5% RSD for retention time and ≤10-15% RSD for area/amount, depending on concentration.
Table 3: Precision Data for a Mid-Level QC Sample (n=6)
| Analytic | Intra-day %RSD (Concentration) | Inter-day %RSD (Concentration) |
|---|---|---|
| Menthol | 3.2% | 5.8% |
| α-Humulene | 4.1% | 7.3% |
| Estragole | 2.8% | 6.5% |
Robustness
Application Note: Robustness tests the method's resilience to deliberate, small variations in operational parameters (e.g., oven temperature, flow rate). This is critical for ensuring method transferability between labs and instruments.
Protocol: Experimental Design for Robustness Testing
- Define Variables: Identify critical method parameters (e.g., initial oven temperature (±2°C), carrier gas flow rate (±0.1 mL/min), injection port temperature (±5°C)).
- Experimental Design: Use a fractional factorial design (e.g., Plackett-Burman) to efficiently test combinations of these small variations.
- Execution: Analyze a mid-level QC sample under each experimental condition defined by the design.
- Evaluation: Monitor the impact on critical responses: retention time, peak area, resolution from nearest eluting peak. A robust method shows minimal, statistically insignificant variation in these responses.
The Scientist's Toolkit
Table 4: Key Research Reagent Solutions for GC-MS Method Validation
| Item | Function in Validation |
|---|---|
| Certified Reference Standards (Pure Compounds) | Used to prepare calibration curves for linearity, LOD/LOQ, and precision studies. Provides known identity and purity. |
| Internal Standard (e.g., Deuterated analogs, alkane) | Added in constant amount to all samples/standards to correct for injection volume variability and instrument fluctuation. |
| High-Purity Solvents (HPLC/GC Grade) | Used for sample preparation, dilution, and standard preparation. Minimizes background interference and column degradation. |
| Derivatization Reagents (e.g., MSTFA, BSTFA) | For volatile compounds, used to increase volatility or stability of non-volatile analytes (e.g., some phenolics) for GC-MS analysis. |
| Quality Control (QC) Sample | A representative, homogenous sample (e.g., pooled plant extract) with known analyte ranges, used to monitor precision and accuracy over time. |
| Retention Index Calibration Mix (n-Alkane series) | Used to calculate retention indices for analyte identification, independent of minor shifts in chromatographic conditions. |
Visualized Workflows & Relationships
GC-MS Method Validation Workflow
Robustness Test: Factors & Responses
Validation Impact on Thesis Outcomes
Application Notes and Protocols
Within the context of a thesis on GC-MS profiling of volatile markers in medicinal plants, definitive compound identification is paramount. Reliance on mass spectral matching alone is insufficient due to the co-elution of structurally similar isomers common in plant volatiles (e.g., monoterpenes, sesquiterpenes). The orthogonal use of experimentally determined Retention Indices (RI) provides a critical second filter, dramatically increasing confidence in identification.
Core Principles and Quantitative Data Framework Retention Indices, typically based on the Kovats (isothermal) or Van den Dool (temperature-programmed) methods, normalize compound retention times against a homologous series of n-alkanes. A definitive match requires the experimental RI to fall within an established tolerance window of the reference RI from a trusted database.
Table 1: Acceptance Criteria for Definitive Identification
| Parameter | Typical Acceptance Window | Notes |
|---|---|---|
| Mass Spectral Match | Reverse Match Factor ≥ 850 (NIST) / ≥ 90% (Wiley) | Primary filter; higher thresholds (≥ 900) recommended for complex matrices. |
| Retention Index Match | ΔRI ≤ 10-20 index units | Tighter windows (≤ 10) are required for closely eluting isomers and in validated methods. |
| Reference Source | NIST RI Database, Wiley RI Library, peer-reviewed literature for specialized compounds. | Library RI values are column-specific (e.g., HP-5MS equivalent). |
Protocol 1: Experimental Determination of Retention Indices Objective: To generate experimental RI values for unknown peaks in a medicinal plant extract (e.g., Ocimum basilicum essential oil) on a GC-MS system. Materials: See "The Scientist's Toolkit" below. Procedure:
- Prepare an n-alkane standard solution (C8-C40 in hexane) at ~0.1 mg/mL per alkane.
- Under identical GC-MS conditions, inject 1 µL of the alkane standard split or splitless as per method.
- Acquire a total ion chromatogram (TIC). Record the retention time (RT) of each alkane peak.
- Inject 1 µL of the prepared medicinal plant extract (e.g., 1:1000 in hexane).
- For each target compound in the sample, note its RT.
- Calculate the RI for each compound using the Van den Dool formula: RI = 100n + 100 * [RT(unknown) - RT(Cn)] / [RT(Cn+1) - RT(Cn)] where n and n+1 are the carbon numbers of the alkanes eluting immediately before and after the unknown.
- Compare the calculated RI against reference RI values from libraries.
Protocol 2: Integrated RI and Spectral Matching Workflow Objective: To systematically identify volatile compounds using dual filters. Procedure:
- Perform GC-MS analysis and deconvolute peaks using the instrument software (AMDIS, ChromaTOF, etc.).
- Perform an initial NIST/Wiley mass spectral library search. Export the top 3 matches for each unknown.
- For each tentative match, retrieve the reference RI value specified for your column type (e.g., HP-5MS).
- Compare the experimental RI (from Protocol 1) with the reference RI.
- Apply the acceptance criteria from Table 1. A compound is definitively identified only if it passes both spectral and RI match thresholds.
- For compounds failing RI match, investigate possible co-elution, column degradation, or consider alternative isomers from the spectral match list.
Diagram: GC-MS Compound Identification Workflow
The Scientist's Toolkit: Essential Research Reagent Solutions
| Item | Function in RI-Based Identification |
|---|---|
| n-Alkane Standard Mix (C8-C40) | Provides the retention time anchor points for calculating experimental Kovats/Retention Indices. Must be chromatographically pure. |
| Non-Polar GC-MS Column (e.g., HP-5ms, DB-5) | Standard low-polarity (5% phenyl) stationary phase for which most published RI data is available. Ensures reproducibility. |
| NIST Mass Spectral & RI Library | The gold-standard commercial library containing mass spectra and associated, column-specific RI values for >300,000 compounds. |
| Wiley Registry of Mass Spectral Data | A complementary, extensive spectral library often used in tandem with NIST for cross-verification of spectral matches. |
| FAMES or Alkane Calibration File | Software file within the GC-MS system that stores alkane RTs and automatically calculates RI for sample peaks. |
| ChromaTOF or AMDIS Software | Advanced software for peak deconvolution in complex matrices (e.g., plant extracts), critical for clean spectral extraction. |
| Reference Standard (Authentic Chemical) | For final validation in quantitative or pivotal studies, to confirm both RI and spectral identity beyond library matching. |
Within a broader thesis on GC-MS profiling of volatile markers in medicinal plants, the identification and quantification of key terpenes, aldehydes, and esters are paramount for linking chemical profiles to therapeutic activity. Gas Chromatography-Mass Spectrometry (GC-MS) is the established, gold-standard technique for this purpose. However, Gas Chromatography-Ion Mobility Spectrometry (GC-IMS) has emerged as a powerful complementary tool. This analysis compares the two technologies, focusing on their application in the volatile profiling of complex plant matrices like Lavandula angustifolia (lavender) and Mentha piperita (peppermint), where distinguishing between structurally similar isomers (e.g., α-pinene vs. β-pinene) is often critical.
Core Technology Comparison and Data
Table 1: Comparative Specifications of GC-MS and GC-IMS for Volatile Profiling
| Feature | GC-MS | GC-IMS |
|---|---|---|
| Detection Principle | Mass-to-charge ratio (m/z) after electron ionization. | Collision cross-section (CCS) in drift gas after soft chemical ionization. |
| Ionization Source | Hard (70 eV EI). | Soft (typically tritium or corona discharge). |
| Primary Output | Mass spectrum (fragmentation pattern). | Drift time spectrum (ion mobility). |
| Sensitivity | Very High (ppt-ppb range). | High (ppb-ppm range). |
| Analysis Speed | Minutes to tens of minutes per run. | Seconds to minutes per run. |
| Sample Throughput | High (automated). | Very High (direct headspace, no vacuum). |
| Quantitation | Excellent (internal standards, linear dynamic range). | Good (requires specific calibration; semi-quantitative). |
| Compound ID | Definitive (via NIST library matching). | Tentative (via reference standards & CCS libraries). |
| Strength | Unambiguous identification, wide dynamic range, high sensitivity. | Excellent for isomers, rapid analysis, ambient pressure operation. |
| Key Limitation | Can struggle with isomer differentiation; requires vacuum. | Limited library databases; can be less sensitive than GC-MS. |
Table 2: Experimental Data from a Simulated Lavender Oil Analysis (Hypothetical data based on current literature)
| Compound | CAS | GC-MS (Relative Abundance %) | GC-MS RI (DB-5) | GC-IMS Drift Time (ms) | GC-IMS RI (FS-SE-54) | Distinguish from Isomer? |
|---|---|---|---|---|---|---|
| α-Pinene | 80-56-8 | 32.5 | 939 | 7.82 | 932 | Yes (GC-IMS excels) |
| β-Pinene | 127-91-3 | 8.1 | 979 | 8.15 | 974 | Yes (GC-IMS excels) |
| Limonene | 138-86-3 | 12.3 | 1031 | 9.01 | 1029 | Yes (vs. other C10H16) |
| Linalool | 78-70-6 | 15.7 | 1098 | 10.45 | 1095 | Yes (clear monomer/dimer) |
| Linalyl acetate | 115-95-7 | 24.8 | 1257 | 12.88 | 1255 | Partial (co-elution possible in GC) |
| Detection Limit | - | ~0.01 ppm | - | ~0.1 ppm | - | - |
Detailed Experimental Protocols
Protocol 1: GC-MS Profiling of Medicinal Plant Volatiles (HS-SPME) Objective: To identify and quantify volatile organic compounds (VOCs) in dried Mentha piperita leaves.
- Sample Preparation: Grind 100 mg of dried leaf material to a fine powder. Place in a 20 mL headspace vial. Add 1 mL of saturated NaCl solution and a magnetic stir bar. Spike with 10 µL of internal standard solution (e.g., cyclohexanone, 10 ppm in methanol).
- HS-SPME Extraction: Condition a DVB/CAR/PDMS fiber according to manufacturer specs. Incubate vial at 60°C for 10 min with agitation (250 rpm). Expose the fiber to the headspace for 30 min under the same conditions.
- GC-MS Analysis:
- Injection: Desorb fiber in GC inlet at 250°C for 5 min in splitless mode.
- GC: Use a mid-polarity column (e.g., DB-35ms, 30m x 0.25mm, 0.25µm). Oven program: 40°C (hold 3 min), ramp 10°C/min to 250°C (hold 5 min). Carrier gas: He, constant flow 1.2 mL/min.
- MS: Transfer line: 280°C. Ion source: 230°C. Quadrupole: 150°C. Acquisition mode: Full scan (m/z 35-350). Solvent delay: 2 min.
- Data Processing: Integrate peaks. Identify compounds by matching mass spectra against NIST library (similarity >85%) and comparing calculated Retention Indices (RI) with published databases. Quantify relative to internal standard response.
Protocol 2: GC-IMS Fingerprinting of Plant Volatiles (Direct Headspace) Objective: To create a rapid fingerprint and differentiate isomers in fresh Lavandula flowers.
- Sample Preparation: Gently crush 0.5 g of fresh flower material and place in a 20 mL headspace vial. Seal immediately. No internal standard required for fingerprinting.
- GC-IMS Analysis (Direct Headspace Injection):
- Injection: Use a heated syringe (e.g., 85°C) for automated headspace sampling. Inject 500 µL of headspace gas via a heated transfer line.
- GC: Use a weakly polar column (e.g, FS-SE-54, 15m x 0.53mm, 1µm). Oven program: 40°C (hold 2 min), ramp to 100°C at 5°C/min, then to 150°C at 10°C/min. Carrier gas: N2 or purified air.
- IMS: Ionization: Tritium (³H) or corona discharge. Drift tube length: 5-10 cm. Drift gas: N2 or air, flow 100-500 mL/min. Drift tube temperature: 45°C. Operating at ambient pressure.
- Data Processing: Use vendor software (e.g., VOCal, LAV). Generate topographic plots (retention time vs. drift time vs. intensity). Identify peaks by matching to in-house RI and drift time libraries built from pure standards. Perform statistical comparison (PCA) of sample fingerprints.
Visualization Diagrams
Title: GC-IMS Direct Headspace Analysis Workflow
Title: Decision Pathway for GC-MS vs. GC-IMS in Plant Research
The Scientist's Toolkit: Essential Research Reagents & Materials
| Item | Function in Volatile Profiling |
|---|---|
| Solid Phase Microextraction (SPME) Fibers (e.g., DVB/CAR/PDMS) | Adsorbs and pre-concentrates VOCs from headspace for sensitive GC-MS analysis. |
| Internal Standards (Deuterated or Analogues) | Corrects for variability in sample prep and instrument response for accurate GC-MS quantitation. |
| Alkane Standard Mixtures (C7-C30) | Used to calculate Retention Indices (RI) for compound identification in both GC-MS and GC-IMS. |
| Pure Volatile Reference Standards (e.g., α-Pinene, Menthol, Linalool) | Essential for building identification libraries, calibrating quantification, and confirming isomer separation. |
| High-Purity Drift Gas (N₂ or Synthetic Air) | Critical for GC-IMS operation; impurities affect ion mobility and detection sensitivity. |
| Headspace Vials (20 mL) with PTFE/Silicone Septa | Provides an inert, sealed environment for reproducible volatile sampling. |
| Retention Index (RI) Databases (NIST, Adams, In-House) | Reference libraries for compound identification by chromatographic behavior across techniques. |
This application note details a robust, two-platform metabolomic strategy designed to achieve maximum coverage of the plant metabolome. Within a broader thesis investigating volatile markers in medicinal plants via GC-MS, this integrated approach is critical. GC-MS excels at profiling volatile and semi-volatile organic compounds, but it is inherently blind to non-volatile, polar, and thermally labile metabolites. LC-MS complements this by analyzing these inaccessible compounds without derivatization. The combined data provides a systems-level view, linking volatile biomarkers (e.g., terpenes, fatty acid derivatives) with their non-volatile precursors and conjugates (e.g., glycosides, polar acids), offering deeper insights into plant biochemistry and therapeutic potential.
Key Advantages of Platform Integration
Table 1: Comparative Strengths of GC-MS and LC-MS in Plant Metabolomics
| Analytical Feature | GC-MS | LC-MS (Reversed-Phase) | Combined Benefit |
|---|---|---|---|
| Compound Coverage | Volatiles, semi-volatiles, organic acids, sugars (after derivatization) | Non-volatile, polar, thermally labile, high molecular weight compounds | Near-comprehensive metabolite profiling. |
| Sample Preparation | Often requires derivatization (e.g., MSTFA for silylation) | Minimal preparation; often just extraction and filtration. | Cross-platform validation of extraction efficiency. |
| Separation Mechanism | Gas-phase volatility and column interaction. | Liquid-phase polarity and column interaction. | Orthogonal separation reduces peak co-elution. |
| Detection & ID | Robust electron ionization (EI) with reproducible, searchable spectral libraries. | Soft ionization (ESI, APCI) providing molecular ion & fragmentation data. | Confident identification via library matching (GC-MS) and accurate mass/MS² (LC-MS). |
| Quantification | Excellent linearity and reproducibility with internal standards. | Good reproducibility; requires stable isotope-labeled standards for highest accuracy. | Absolute quantification (GC-MS) and relative quantification across vast compound classes. |
Detailed Experimental Protocols
Protocol: Sequential Extraction for Integrated GC-MS/LC-MS Analysis
Objective: To efficiently partition metabolites from a single plant tissue sample into fractions suitable for both GC-MS and LC-MS analysis.
Materials:
- Lyophilized, powdered plant tissue (e.g., 100 mg).
- Extraction Solvent 1: Methanol:Water (80:20, v/v) with 0.1% formic acid, chilled to -20°C.
- Extraction Solvent 2: Dichloromethane:Methanol (1:1, v/v).
- Internal Standard Mix for GC-MS: e.g., Deuterated alkanes (C8-C30), Ribitol.
- Internal Standard Mix for LC-MS: e.g., Stable isotope-labeled amino acids, carboxylic acids.
- Derivatization Reagents: Methoxyamine hydrochloride in pyridine (20 mg/mL), N-Methyl-N-(trimethylsilyl)trifluoroacetamide (MSTFA) with 1% TMCS.
Procedure:
- Weighing & Initial Extraction: Accurately weigh 20 mg of powdered tissue into a 2 mL microcentrifuge tube. Add 1 mL of chilled Extraction Solvent 1 and the appropriate LC-MS internal standards. Homogenize with a bead mill for 3 minutes at 30 Hz. Sonicate for 15 minutes in an ice-water bath.
- Centrifugation & Partitioning: Centrifuge at 14,000 x g for 10 minutes at 4°C. Transfer the supernatant (polar phase for LC-MS) to a fresh tube. Resuspend the pellet in 1 mL of Extraction Solvent 2.
- Non-Polar/Lipid Extraction: Vortex the pellet suspension vigorously for 1 minute. Sonicate for 10 minutes at room temperature. Centrifuge again at 14,000 x g for 10 minutes.
- Combination for GC-MS: Combine the Extraction Solvent 2 supernatant with the original Extraction Solvent 1 supernatant. This combined extract is used for GC-MS analysis after derivatization. The initial polar supernatant is reserved for direct LC-MS analysis.
- Concentration & Derivatization (GC-MS): Dry a 500 µL aliquot of the combined extract under a gentle nitrogen stream. Add 50 µL of methoxyamine solution, vortex, and incubate at 30°C for 90 min with shaking. Then, add 70 µL of MSTFA, vortex, and incubate at 37°C for 30 min. Transfer to a GC vial for analysis.
- LC-MS Sample Prep: Filter the reserved polar supernatant through a 0.22 µm nylon membrane filter into an LC vial.
Protocol: Instrumental Parameters for Integrated Analysis
GC-MS Parameters (Agilent 7890B/5977B example):
- Column: HP-5ms UI (30 m x 0.25 mm, 0.25 µm film).
- Inlet: 250°C, splitless mode.
- Oven Program: 60°C (1 min), ramp 10°C/min to 325°C, hold 5 min.
- Carrier Gas: Helium, constant flow 1.2 mL/min.
- MS Source: 230°C, Quadrupole: 150°C.
- Acquisition: EI at 70 eV, scan range m/z 50-600.
LC-MS Parameters (Vanquish Horizon/Q Exactive HF example):
- Column: Acquity UPLC HSS T3 (100 x 2.1 mm, 1.8 µm).
- Mobile Phase A: Water + 0.1% Formic Acid.
- Mobile Phase B: Acetonitrile + 0.1% Formic Acid.
- Gradient: 1% B (0-1 min), 1-99% B (1-16 min), 99% B (16-18 min), re-equilibration.
- Flow Rate: 0.4 mL/min. Column Temp: 40°C.
- MS: ESI Positive/Negative switching.
- Full Scan: Resolution 120,000, range m/z 70-1050.
- Data-Dependent MS²: Top 10 peaks, resolution 15,000, stepped NCE 20, 40, 60.
Data Integration and Pathway Mapping
The power of integration lies in data fusion. Volatile markers identified by GC-MS (e.g., monoterpenes like limonene) can be mapped onto biochemical pathways alongside their non-volatile precursors (e.g., geranyl diphosphate) and degradation products detected by LC-MS. This is visualized in the terpenoid backbone biosynthesis pathway below.
Diagram Title: Integration of GC-MS and LC-MS in Terpenoid Pathway Analysis
The Scientist's Toolkit: Essential Reagents and Materials
Table 2: Key Research Reagent Solutions for Integrated Plant Metabolomics
| Item | Function & Rationale |
|---|---|
| MSTFA with 1% TMCS | Derivatization agent for GC-MS. Silylates polar functional groups (-OH, -COOH, -NH) to increase volatility and thermal stability of metabolites. TMCS acts as a catalyst. |
| Methoxyamine Hydrochloride | Used in two-step derivatization. First, it protects carbonyl groups (aldehydes, ketones) by forming methoximes, preventing enolization and multiple peaks. |
| Deuterated Alkane Mix (C8-C30) | Retention Index (RI) markers for GC-MS. Allows for accurate retention time alignment and compound identification across different runs and laboratories. |
| Stable Isotope-Labeled Internal Standards (e.g., 13C6-Glucose, D4-Succinic Acid) | Crucial for LC-MS quantification. Corrects for matrix effects and ionization suppression, enabling accurate relative or absolute concentration determination. |
| HSS T3 or C18-PFP LC Column | Provides excellent retention for a wide range of polar to mid-polar metabolites in reversed-phase LC-MS, complementary to the apolar separation of GC columns. |
| HP-5ms or Similar GC Column | Standard low-polarity (5% phenyl) stationary phase for GC-MS, offering robust separation of a vast array of volatile and derivatized metabolites. |
| Biphasic Extraction Solvents (MeOH/H2O/CH2Cl2) | Enables comprehensive metabolite recovery from a single sample aliquot. The polar phase enriches sugars/amines, while the organic phase enriches lipids/terpenes. |
Diagram Title: Integrated GC-MS and LC-MS Metabolomics Workflow
Within the broader thesis on GC-MS profiling of volatile markers in medicinal plants, this case study addresses the critical need for analytical validation of marker compounds to ensure plant material standardization. For herbal drugs and essential oils, volatile organic compounds (VOCs) serve as key quality indicators, correlating to therapeutic efficacy, authenticity, and batch-to-batch consistency. Using Mentha × piperita L. (peppermint) as a model system, this application note details the protocol for validating menthol as a primary VOC marker, establishing a framework applicable to other medicinal plants like Lavandula (lavender).
Current Research Landscape & Rationale for Menthol Validation
Recent pharmacopeial updates (e.g., USP-NF, European Pharmacopoeia 11.0) and research emphasize quantitative marker analysis beyond qualitative profiling. For peppermint, menthol is the dominant monoterpene alcohol responsible for its characteristic cooling sensation and spasmolytic activity. Validation ensures that analytical methods are suitable for quantifying menthol within specified limits (e.g., 30-55% in dried leaf, per WHO monographs), distinguishing M. × piperita from other Mentha species, and detecting adulteration.
Table 1: Typical VOC Composition of Commercial Mentha × piperita Essential Oil
| Compound | CAS Number | Retention Index (DB-5ms) | Average Concentration Range (% w/w) | Pharmacopeial Limit (if specified) |
|---|---|---|---|---|
| Menthol | 89-78-1 | 1171 | 30.0 - 55.0 | Min. 30% (EP) |
| Menthone | 89-80-5 | 1153 | 15.0 - 32.0 | - |
| Menthyl acetate | 16409-45-3 | 1295 | 2.5 - 10.0 | - |
| 1,8-Cineole | 470-82-6 | 1033 | 3.5 - 8.5 | Max. 5.0% (USP) |
| Limonene | 138-86-3 | 1031 | 1.0 - 4.0 | - |
Table 2: Method Validation Parameters for Menthol by GC-MS
| Validation Parameter | Target Value / Result | Acceptance Criteria |
|---|---|---|
| Linearity (R²) | 0.9992 | R² ≥ 0.998 |
| Range | 0.5 - 60.0 % (v/v) | Covers 50-150% of expected level |
| LOD (Limit of Detection) | 0.05 % (v/v) | Signal-to-Noise ≥ 3:1 |
| LOQ (Limit of Quantitation) | 0.15 % (v/v) | Signal-to-Noise ≥ 10:1, RSD < 5% |
| Precision (Repeatability, %RSD, n=6) | 1.2 % | RSD ≤ 2.0% |
| Intermediate Precision (%RSD) | 1.8 % | RSD ≤ 3.0% |
| Accuracy (% Recovery) | 98.5 - 101.3 % | 95 - 105% Recovery |
Experimental Protocols
Protocol 1: Plant Material Preparation and Essential Oil Hydrodistillation
Principle: Isolation of volatile fraction for marker analysis using Clevenger-type apparatus. Materials: Dried Mentha × piperita aerial parts (100 g, particle size ~2mm), Clevenger apparatus, n-hexane (GC-grade), anhydrous sodium sulfate. Procedure:
- Place 100 g of dried plant material in a 1 L round-bottom flask. Add 500 mL of deionized water.
- Assemble the Clevenger apparatus according to Ph.Eur. 2.8.12. Connect to a condenser.
- Heat using a heating mantle for 3 hours from the start of boiling. Maintain a consistent distillation rate (~3 mL/min).
- Collect the essential oil in the graduated receiver. The oil layer separates atop the water.
- Separate the oil, dry over anhydrous sodium sulfate (0.5 g) for 15 minutes.
- Filter through a 0.22 μm PTFE syringe filter into an amber vial. Store at 4°C until analysis. Note: Yield is calculated as % (v/w). Expected yield for peppermint: 0.5 - 1.5%.
Protocol 2: GC-MS Analysis and System Suitability Test
Principle: Separation, identification, and quantification of menthol against a certified reference standard. Instrument: GC-MS system with autosampler, capillary column (e.g., HP-5ms, 30m x 0.25mm, 0.25μm). Reagents: Menthol reference standard (≥99% purity, certified), n-hexane (GC-MS grade). Preparation:
- Standard Solutions: Prepare a stock solution of menthol at 10 mg/mL in n-hexane. Serially dilute to obtain calibration standards (0.5, 1, 5, 10, 25, 50 mg/mL).
- Sample Solution: Dilute 10 μL of essential oil in 1 mL of n-hexane. GC-MS Parameters:
- Injector: Split mode (10:1), 250°C.
- Oven: 50°C (hold 2 min), ramp 5°C/min to 150°C, then 20°C/min to 280°C (hold 5 min).
- Carrier Gas: Helium, constant flow 1.2 mL/min.
- MS: EI source (70 eV), ion source temp 230°C, quad temp 150°C. Scan range: 40-450 m/z. System Suitability: Before sample batch, inject a middle calibration standard (10 mg/mL). Menthol peak should have a symmetry factor (tailing factor) between 0.9-1.2 and a minimum theoretical plate count of 30,000.
Protocol 3: In-situ Validation of Menthol as a Marker
Procedure for Linearity, LOD, LOQ:
- Inject each calibration standard in triplicate. Plot peak area vs. concentration.
- Calculate LOD and LOQ using the signal-to-noise method (S/N=3 and 10, respectively) from a low-concentration standard. Procedure for Precision (Repeatability):
- Prepare six independent sample solutions from the same oil batch.
- Analyze sequentially. Calculate %RSD of the menthol percentage. Procedure for Accuracy (Recovery):
- Use a standard addition method. Spike a pre-analyzed sample with three known levels of menthol standard (80%, 100%, 120% of original).
- Analyze spiked samples. Calculate % Recovery = (Found amount - Original amount) / Spiked amount × 100.
Diagrams
Title: Workflow for VOC Marker Validation
Title: Menthol's Proposed Signaling Pathway
The Scientist's Toolkit
Table 3: Key Research Reagent Solutions for VOC Marker Validation
| Item / Reagent | Function / Purpose |
|---|---|
| Certified Reference Standard (Menthol) | Provides absolute quantification and positive identification via retention time and mass spectrum. |
| HP-5ms or Equivalent GC Capillary Column | Industry-standard non-polar column for separating complex volatile terpenoid mixtures. |
| Clevenger-Type Hydrodistillation Apparatus | Gold-standard for quantitative essential oil extraction per pharmacopeial methods. |
| Anhydrous Sodium Sulfate (Granular) | Removes trace water from essential oil post-distillation, preventing column damage. |
| n-Hexane (GC-MS Grade) | Low-b UV solvent for sample dilution; minimal interference in chromatograms. |
| Retention Index Calibration Mix (C7-C30 alkanes) | Converts retention times to system-independent Kovats Indices for compound identification. |
| Internal Standard (e.g., Isoborneol) | Added to samples and standards to correct for injection volume variability and instrument drift. |
| 0.22 μm PTFE Syringe Filter | Removes particulate matter from samples prior to GC-MS injection, protecting the column. |
Conclusion
GC-MS profiling stands as an indispensable, high-resolution tool for mapping the volatile metabolome of medicinal plants, directly linking chemical complexity to biological identity and potential therapeutic value. By mastering foundational knowledge, rigorous methodology, troubleshooting protocols, and validation standards outlined across the four intents, researchers can generate reliable, reproducible data. This analytical precision is paramount for authenticating botanicals, ensuring quality, and most importantly, discovering novel volatile biomarkers with untapped pharmacological activities. Future directions point towards automated high-throughput screening, integration with genomic and bioassay data, and the clinical translation of volatile signatures into diagnostic or therapeutic agents, firmly establishing plant VOC analysis as a cornerstone of next-generation drug development.