A Comprehensive Guide to LC-MS Analysis of Plant Secondary Metabolites: From Extraction to Quantification
This article provides a detailed, step-by-step protocol for the targeted and untargeted analysis of plant secondary metabolites using Liquid Chromatography-Mass Spectrometry (LC-MS).
A Comprehensive Guide to LC-MS Analysis of Plant Secondary Metabolites: From Extraction to Quantification
Abstract
This article provides a detailed, step-by-step protocol for the targeted and untargeted analysis of plant secondary metabolites using Liquid Chromatography-Mass Spectrometry (LC-MS). Tailored for researchers and drug development professionals, it covers the foundational principles of plant metabolomics, method development for diverse compound classes, advanced troubleshooting for complex plant matrices, and strategies for method validation and comparison with alternative techniques. The guide integrates the latest advancements and best practices to enable robust identification, characterization, and quantification of phytochemicals for discovery and applied research.
Understanding Plant Secondary Metabolites and LC-MS Fundamentals: A Primer for Robust Analysis
The systematic profiling and quantification of plant secondary metabolites via Liquid Chromatography-Mass Spectrometry (LC-MS) requires precise upfront knowledge of the target compound classes. Alkaloids, phenolics, and terpenoids represent the three major, chemically diverse groups, each demanding tailored LC-MS protocols due to distinct physicochemical properties. This guide provides essential Application Notes and detailed Protocols for researchers developing a universal LC-MS thesis framework.
Major Classes: Chemical & Analytical Characteristics
Table 1: Core Properties & LC-MS Considerations of Major Plant Secondary Metabolite Classes
| Class | Basic Structure | Polarity | Example Compounds | Key LC-MS Challenges | Typical Ionization Mode |
|---|---|---|---|---|---|
| Alkaloids | Nitrogen-containing heterocycles | Low to Medium | Nicotine, Caffeine, Morphine, Berberine | Basicity causes peak tailing; require pH-controlled mobile phases. | ESI+ (predominant) |
| Phenolics | Aromatic rings with OH groups | Medium to High | Flavonoids, Tannins, Lignans, Chlorogenic acid | Structural diversity spans simple acids to complex polymers; need wide polarity gradients. | ESI- or ESI+ |
| Terpenoids | Built from isoprene (C5H8) units | Non-polar to Medium | Artemisinin, Paclitaxel, Menthol, Carotenoids | Low polarity necessitates reverse-phase C18 or C30 columns; poor ionization efficiency. | APCI+ often preferred for less polar types; ESI for glycosylated. |
Application Notes & Detailed Protocols
Generic LC-MS Protocol for Multi-Class Screening
This protocol is designed for the initial untargeted profiling of plant extracts.
A. Sample Preparation
- Material: 100 mg of lyophilized plant tissue.
- Extraction: Add 1 mL of methanol:water (80:20, v/v) with 0.1% formic acid. Sonicate for 30 min at 25°C. Centrifuge at 14,000 x g for 10 min. Filter supernatant through a 0.22 µm PTFE membrane.
B. LC Conditions (Reverse Phase)
- Column: C18 column (2.1 x 100 mm, 1.8 µm particle size).
- Mobile Phase: A: Water + 0.1% Formic Acid; B: Acetonitrile + 0.1% Formic Acid.
- Gradient: 5% B (0-2 min), 5-95% B (2-20 min), 95% B (20-23 min), 95-5% B (23-24 min), re-equilibrate at 5% B (24-30 min).
- Flow Rate: 0.3 mL/min. Column Temp: 40°C.
C. MS Conditions (Q-TOF or Orbitrap)
- Ionization: Dual ESI (Positive & Negative modes).
- Scan Range: m/z 100-1500.
- Gas Temp: 300°C. Drying Gas Flow: 8 L/min.
- Nebulizer Pressure: 35 psi.
- Capillary Voltage: 3500 V (positive), 3000 V (negative).
- Collision Energy: Ramped 10-40 eV for MS/MS.
D. Data Analysis
- Use software (e.g., MS-DIAL, XCMS) for peak picking, alignment, and deconvolution.
- Tentative identification via accurate mass (< 5 ppm error) and MS/MS matching to databases (GNPS, MassBank).
Class-Specific Optimization Notes
For Alkaloids:
- Use a basic mobile phase (e.g., ammonium bicarbonate, pH ~8.5) on a stable C18 column to improve peak shape for basic nitrogen compounds.
For Polar Phenolics:
- For very polar phenolics (e.g., catechins), consider a HILIC (Hydrophilic Interaction Liquid Chromatography) method as an alternative to reverse-phase.
For Non-Polar Terpenoids:
- Switch to an APCI (Atmospheric Pressure Chemical Ionization) source for better ionization of non-polar compounds like monoterpenes and sesquiterpenes.
The Scientist's Toolkit: Research Reagent Solutions
Table 2: Essential Materials for Plant Metabolite LC-MS Research
| Reagent / Material | Function & Rationale |
|---|---|
| Methanol (LC-MS Grade) | Primary extraction solvent; low UV cut-off and good solubility for a wide polarity range. |
| Formic Acid (≥99%, LC-MS) | Mobile phase additive (0.1%). Promotes protonation in ESI+, improves peak shape, and suppresses silanol activity in columns. |
| Ammonium Acetate / Formate | Volatile buffer salts for pH control in mobile phases, compatible with MS detection. |
| C18 Reverse-Phase Column | Workhorse column for separating a broad spectrum of semi-polar metabolites. |
| PTFE Syringe Filters (0.22 µm) | Removes particulates from extracts to prevent column and instrument clogging. |
| Deuterated Internal Standards | Compounds like caffeine-d9 or quercetin-d3 correct for matrix effects and instrument variability in quantification. |
| Solid Phase Extraction (SPE) Cartridges | Used for sample clean-up (removing chlorophyll, lipids) or fractionation (e.g., C18, Silica, NH2). |
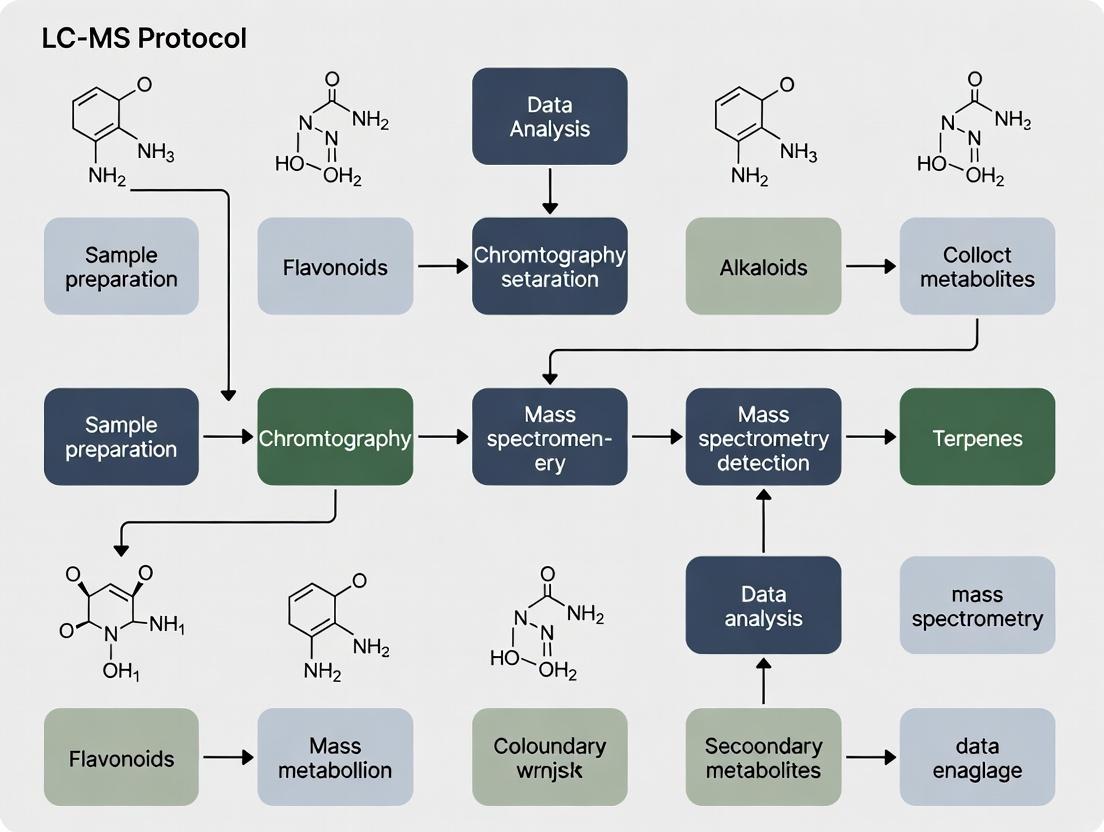
Visualized Workflows & Pathways
Diagram 1: Generic LC-MS Workflow for Plant Metabolites
Diagram 2: Core Biosynthetic Origins of Target Classes
Why LC-MS? Core Principles and Advantages for Plant Metabolomics
Core Principles
Liquid Chromatography-Mass Spectrometry (LC-MS) is a hyphenated analytical technique that combines the physical separation capabilities of liquid chromatography (LC) with the mass analysis and detection capabilities of mass spectrometry (MS). This synergy is exceptionally powerful for plant metabolomics.
Liquid Chromatography (LC) Principles:
- Separation Mechanism: Separates compounds in a liquid mixture based on their differential partitioning between a mobile phase (solvent) and a stationary phase (column packing material).
- Key Modes: Reversed-phase (RP-LC) is most common, separating metabolites by hydrophobicity. Other modes include HILIC (hydrophilic interaction) for polar compounds.
- Gradient Elution: A changing solvent composition over time (e.g., increasing organic solvent percentage) allows separation of a wide range of compounds with different polarities in a single run.
Mass Spectrometry (MS) Principles:
- Ionization: The LC eluent is ionized. Electrospray Ionization (ESI) is the dominant technique, gently producing ions ([M+H]⁺, [M-H]⁻, etc.) suitable for labile plant metabolites.
- Mass Analysis: Ions are separated by their mass-to-charge ratio (m/z). Quadrupole, Time-of-Flight (TOF), and Orbitrap analyzers are prevalent. High-resolution mass spectrometry (HRMS) like Q-TOF and Orbitrap provides exact mass measurements (<5 ppm accuracy) for elemental composition determination.
- Detection: The abundance of ions at each m/z is recorded, generating mass spectra and total ion chromatograms (TIC).
Data Acquisition Modes:
- Full Scan: Captures all ions within a specified m/z range, enabling untargeted profiling.
- Tandem MS/MS: Selects precursor ions for fragmentation, providing structural information critical for metabolite identification.
Advantages for Plant Metabolomics
LC-MS has become the cornerstone of modern plant metabolomics due to a combination of technical strengths perfectly aligned with the challenges of plant systems.
Table 1: Key Advantages of LC-MS for Plant Metabolomics
| Advantage | Description | Impact on Plant Metabolomics Research |
|---|---|---|
| Comprehensive Coverage | Combines separation (LC) with selective detection (MS). Can analyze hundreds to thousands of metabolites in a single run. | Captures the immense chemical diversity (primary & secondary metabolites) of plant extracts. |
| High Sensitivity | Modern MS detectors (e.g., triple quads, HRMS) can detect compounds at picogram (pg) to femtogram (fg) levels. | Enables analysis of low-abundance signaling molecules, phytohormones, and metabolites in small tissue samples (e.g., single root hair). |
| Chemical Specificity | MS detects exact m/z, and MS/MS provides unique fragmentation fingerprints. | Differentiates between structural isomers (e.g., flavonoid glycosides) which are common in plants and often co-elute. |
| Dynamic Range | Capable of quantifying metabolites across 5-6 orders of magnitude in concentration. | Allows simultaneous measurement of highly abundant sugars and trace-level specialized metabolites in one injection. |
| Molecular Characterization | HRMS provides exact mass; MS/MS provides fragmentation pathways. | Enables putative annotation of unknown metabolites against databases (e.g., KNApSAcK, PlantCyc, GNPS) without pure standards. |
| High-Throughput Potential | Automated sample preparation, fast LC gradients (e.g., UHPLC), and rapid MS scanning enable analysis of 100s of samples. | Essential for large-scale phenotyping, time-course studies, and population genetics studies in plants. |
| Minimal Derivatization | ESI ionizes a wide range of functional groups directly. | Simplifies sample prep, preserves labile structures, and speeds up analysis compared to techniques like GC-MS. |
Detailed Experimental Protocol: Untargeted Profiling of Leaf Secondary Metabolites
Context: This protocol is a core chapter methodology for a thesis focusing on the comparative analysis of secondary metabolites in response to abiotic stress in *Arabidopsis thaliana.*
I. Sample Harvest and Quenching
- Material: Liquid nitrogen, pre-cooled mortar and pestle, aluminum foil, forceps, 2.0 mL safe-lock microcentrifuge tubes.
- Procedure: Flash-freeze leaf tissue (≈100 mg FW) in situ by wrapping in aluminum foil and plunging into liquid N₂. Grind tissue to a fine powder under liquid N₂. Transfer powder to a pre-weighed tube and store at -80°C.
II. Metabolite Extraction (Modified 80% Methanol Method)
- Research Reagent Solutions:
- Extraction Solvent: Methanol/Water (80:20, v/v) with 0.1% Formic Acid. Function: Polar organic solvent system denatures enzymes and extracts a broad range of semi-polar to polar metabolites. Acid enhances ionization in positive ESI mode.
- Internal Standard Mix: Stable isotope-labeled compounds (e.g., [²H₄]-Succinic acid, [¹³C₆]-Caffeic acid) at 1 µg/mL in extraction solvent. Function: Monitors extraction efficiency, instrument performance, and aids in signal normalization.
- QC Pool Sample: A small aliquot (e.g., 10 µL) from every experimental sample combined into a single vial. Function: Used for system equilibration and monitoring instrumental reproducibility throughout the batch.
Table 2: Key Reagents and Materials for LC-MS Plant Metabolomics
| Item | Function/Justification |
|---|---|
| UHPLC System (e.g., Vanquish, Nexera) | Provides high-pressure (≥1000 bar) separation with sub-2µm particle columns for superior resolution and speed. |
| C18 Reversed-Phase Column (e.g., 150 x 2.1mm, 1.7µm) | Standard workhorse column for separating semi-polar plant secondary metabolites (flavonoids, alkaloids, phenolic acids). |
| Q-TOF or Orbitrap Mass Spectrometer | High-resolution, accurate mass (HRAM) analyzer essential for untargeted profiling and putative identification. |
| ESI Ion Source | "Soft" ionization technique ideal for thermally labile, non-volatile plant metabolites. |
| Solid-Phase Extraction (SPE) Cartridges (C18, HLB) | For sample clean-up to remove salts, pigments (chlorophyll), and lipids that cause ion suppression. |
| Ammonium Formate / Formic Acid | Volatile buffer and pH modifier for mobile phases; compatible with MS detection. |
| Leucine Enkephalin (for Lock Mass) | Standard for real-time internal mass calibration in HRMS systems like Q-TOF, ensuring sustained mass accuracy. |
| Metabolomics Databases (GNPS, METLIN, MassBank) | Spectral libraries for matching MS/MS data to annotate metabolites. |
| Data Processing Software (MS-DIAL, XCMS Online, Compound Discoverer) | For feature detection, alignment, peak picking, and statistical analysis of complex LC-MS datasets. |
- Protocol: a. Pre-cool centrifuge to 4°C. b. Add 1 mL of ice-cold extraction solvent containing the internal standard mix to 100 mg frozen powder. c. Vortex vigorously for 30 seconds. Sonicate in an ice-water bath for 15 minutes. d. Centrifuge at 16,000 × g for 15 minutes at 4°C. e. Transfer 800 µL of supernatant to a new 1.5 mL tube. f. Evaporate the extract to dryness in a vacuum concentrator (≤ 30°C). g. Reconstitute the dried extract in 100 µL of 20% methanol/water with 0.1% formic acid. Vortex for 1 min, sonicate for 5 min. h. Centrifuge at 16,000 × g for 10 min at 4°C. Transfer supernatant to a LC-MS vial with insert.
III. LC-MS Analysis
- Chromatography (Reversed-Phase UHPLC):
- Column: C18, 150 x 2.1 mm, 1.7 µm.
- Mobile Phase: A) 0.1% Formic acid in Water; B) 0.1% Formic acid in Acetonitrile.
- Gradient: 2% B to 98% B over 18 min, hold 2 min, re-equilibrate for 5 min.
- Flow Rate: 0.35 mL/min. Temperature: 40°C. Injection Volume: 5 µL.
- Mass Spectrometry (ESI-Q-TOF):
- Acquisition Mode: Data-Dependent Acquisition (DDA). Cycle: 1 Full scan (m/z 50-1200) at 4 Hz, followed by MS/MS of top 5 most intense ions at 8 Hz.
- Ionization: ESI positive and negative modes, separate runs. Capillary Voltage: ±3.0 kV. Source Temp: 150°C. Desolvation Temp: 500°C.
- Collision Energy: Ramped (e.g., 20-40 eV) for MS/MS.
- Lock Mass: Leucine Enkephalin ([M+H]⁺ = 556.2766) infused continuously for real-time calibration.
IV. Data Processing and Analysis
- Convert raw files to open format (.mzML/.mzXML).
- Use software (e.g., MS-DIAL) for:
- Peak Picking: Feature detection (retention time, m/z, intensity).
- Alignment: Across all samples.
- Gap Filling: Estimate missing values.
- Annotation: Match features to databases using exact mass, isotopic pattern, and MS/MS spectra (if available).
- Export a peak intensity table for statistical analysis (multivariate: PCA, PLS-DA; univariate: t-test, ANOVA).
LC-MS Plant Metabolomics Workflow
LC-MS Hyphenated Technique Principle
Within the framework of a thesis on LC-MS protocol development for plant secondary metabolite research, the selection of mass spectrometry hardware is paramount. The instrument defines the scope, depth, and quantitative rigor of the investigation. This application note details the core operating principles, performance characteristics, and specific experimental protocols for the three dominant high-performance LC-MS systems: Triple Quadrupole (QQQ), Quadrupole-Time of Flight (Q-TOF), and Orbitrap systems. The choice among them hinges on the research question—targeted quantification, untargeted profiling, or structural elucidation.
Hardware Comparison & Quantitative Specifications
The following table summarizes the key performance metrics and primary applications relevant to phytochemical analysis.
Table 1: Core LC-MS System Specifications for Metabolite Analysis
| Parameter | Triple Quadrupole (QQQ) | Quadrupole-Time of Flight (Q-TOF) | Orbitrap |
|---|---|---|---|
| Mass Analyzer | Q1 (RF/DC) → Q2 (Collision Cell) → Q3 (RF/DC) | Quadrupole → Collision Cell → Time-of-Flight | C-trap → Orbitrap (Electrostatic Field) |
| Mass Accuracy (RMS) | Unit mass resolution (~0.7 Da) | < 2 ppm (with internal calibration) | < 3 ppm (with external calibration) |
| Resolving Power (FWHM) | Unit resolution | 20,000 - 80,000 | 60,000 - 1,000,000+ |
| Scan Speed | Very High (> 10,000 Da/s) | High (10 - 100 Hz) | Moderate to High (Up to ~40 Hz at R=60k) |
| Dynamic Range | 10^5 - 10^6 (for SRM) | 10^4 - 10^5 | 10^3 - 10^4 |
| Primary Application | Targeted, high-sensitivity quantification (e.g., alkaloids, phytohormones) | Untargeted screening, metabolite profiling, accurate mass confirmation | Untargeted/metabolomics, structural elucidation (MS^n), high-resolution quantification |
| Key Strength | Ultimate sensitivity and reproducibility in quantification | Fast, accurate mass full-scan and MS/MS data acquisition | Ultra-high resolution and mass accuracy for complex mixtures |
| Typical Cost | $$ | $$$ | $$$$ |
Application Notes & Detailed Experimental Protocols
Application Note 1: Targeted Quantification of Jasmonates using a Triple Quadrupole (QQQ)
Objective: To quantitatively determine the levels of jasmonic acid and its bioactive derivatives (e.g., JA-Ile) in stressed plant tissue with high precision and sensitivity.
Protocol:
- Sample Preparation: Homogenize 100 mg of frozen leaf tissue in 1 mL of cold methanol:water (70:30, v/v) containing 0.1% formic acid and deuterated internal standards (e.g., d5-JA, d6-JA-Ile). Sonicate for 15 min, centrifuge at 15,000 x g for 10 min at 4°C. Pass supernatant through a C18 solid-phase extraction (SPE) cartridge. Elute, dry under nitrogen, and reconstitute in 100 µL of initial LC mobile phase.
- LC Conditions:
- Column: C18 reversed-phase (2.1 x 100 mm, 1.7 µm).
- Mobile Phase: A) 0.1% Formic acid in water; B) 0.1% Formic acid in acetonitrile.
- Gradient: 5% B to 95% B over 12 min, hold 2 min.
- Flow Rate: 0.3 mL/min.
- Injection Volume: 5 µL.
- QQQ MS Method (Multiple Reaction Monitoring - MRM):
- Ion Source: Electrospray Ionization (ESI), negative mode.
- Source Parameters: Capillary Voltage: 3.0 kV; Desolvation Temp: 500°C; Gas Flow: 800 L/hr.
- MRM Transitions: Optimize for each analyte (e.g., JA: 209 > 59; JA-Ile: 322 > 130). Use optimized collision energies (CE) for each transition.
- Dwell Time: 20-50 ms per transition.
- Data Analysis: Use instrument software to integrate MRM peak areas. Plot calibration curves (1 pg/µL to 1000 pg/µL) using analyte/internal standard peak area ratios. Calculate concentrations in the sample.
Diagram Title: Targeted QQQ MRM Workflow for Jasmonates
Application Note 2: Untargeted Profiling of Phenolic Compounds using a Q-TOF
Objective: To comprehensively profile and tentatively identify phenolic acids, flavonoids, and their conjugates in a plant extract.
Protocol:
- Sample Preparation: Extract 50 mg of dried, powdered material with 1 mL of methanol/water/acetic acid (70:29:1, v/v/v) in an ultrasonic bath for 30 min. Centrifuge, filter supernatant (0.22 µm PVDF), and dilute 1:10 with water prior to injection.
- LC Conditions:
- Column: HSS T3 reversed-phase (2.1 x 150 mm, 1.8 µm).
- Mobile Phase: A) 0.1% Formic acid in water; B) 0.1% Formic acid in acetonitrile.
- Gradient: 1% B to 99% B over 18 min.
- Flow Rate: 0.25 mL/min.
- Injection Volume: 2 µL.
- Q-TOF MS Method (Data-Dependent Acquisition - DDA):
- Ion Source: ESI, positive and negative mode (separate runs).
- Scan Cycle: Full scan TOF MS (m/z 50-1200) at 4 Hz, followed by MS/MS on top 5 most intense ions (cycle time 0.5 s) using collision energy ramping (e.g., 20-40 eV).
- Calibration: Use reference mass correction via lock mass (e.g., leucine enkephalin).
- Data Processing: Use vendor or third-party software (e.g., Progenesis QI, MS-DIAL) for peak picking, alignment, and deconvolution. Perform database searching (e.g., Metlin, PubChem, in-house library) using accurate mass (< 5 ppm) and MS/MS spectra for tentative identification.
Diagram Title: Untargeted Profiling DDA Workflow on Q-TOF
The Scientist's Toolkit: Research Reagent Solutions
Table 2: Essential Materials for Plant Metabolite LC-MS Analysis
| Item | Function & Rationale |
|---|---|
| Deuterated Internal Standards (e.g., d5-JA, d13-Caffeine) | Correct for matrix-induced ionization suppression/enhancement and losses during sample prep; essential for accurate QQQ quantification. |
| SPE Cartridges (C18, HLB, SCX) | Clean-up complex plant extracts, remove salts, pigments, and phospholipids to reduce matrix effects and ion source contamination. |
| UHPLC-Grade Solvents (MeCN, MeOH, Water) | Minimize background chemical noise and system contamination, ensuring high signal-to-noise ratios. |
| Volatile Additives (Formic Acid, Ammonium Formate/ Acetate) | Promote analyte protonation/deprotonation in ESI source and improve chromatographic peak shape in reversed-phase separations. |
| Lock Mass Compound (e.g., Leu-Enkephalin) | Provides a constant internal reference ion for real-time mass axis calibration in Q-TOF and Orbitrap systems, ensuring sub-ppm mass accuracy. |
| Retention Time Index (RTI) Standards | A mixture of compounds spanning a wide polarity range used to normalize retention times across multiple LC-MS runs in long-term metabolomics studies. |
Within the broader thesis on LC-MS protocols for plant secondary metabolites research, addressing the complexity of the plant matrix is a foundational challenge. The presence of primary metabolites (sugars, lipids, proteins), polymers (cellulose, lignin), and a vast array of secondary metabolites (alkaloids, phenolics, terpenoids) at dynamic concentrations creates significant interference during extraction, chromatography, and mass spectrometry detection. This application note details current strategies and specific protocols to overcome these hurdles, ensuring robust, reproducible, and quantitative analysis of target phytochemicals.
The following table summarizes key quantitative data on matrix effects and recovery rates from recent literature, highlighting the impact of different preparation strategies.
Table 1: Impact of Sample Preparation Techniques on Analytical Performance for Plant Metabolites (LC-MS)
| Matrix / Target Compound Class | Preparation Method | Average Matrix Suppression/Enhancement (%)* | Mean Recovery Rate (%)* | Key Interferent Mitigated | Reference Year |
|---|---|---|---|---|---|
| Cannabis sativa (Cannabinoids) | QuEChERS (Modified) | +12 to -8 | 94-102 | Chlorophyll, Terpenes | 2023 |
| Ginkgo biloba leaf (Flavonoids, Terpenes) | Solid-Phase Extraction (Polyamide) | -5 to +15 | 88-95 | Gingkolic acids, Polymeric tannins | 2024 |
| Root tissue (Isoquinoline Alkaloids) | Microwave-Assisted Extraction | -10 to +3 | 89-98 | Pectic polysaccharides, Starches | 2023 |
| Berry pulp (Anthocyanins) | Liquid-Liquid Extraction (Acidified Ethyl Acetate) | -20 to +5 | 75-85 | Sugars (Fructose, Glucose) | 2022 |
| Oleaginous Seeds (Lignans) | Sequential Solvent Extraction (Hexane then Methanol) | -8 to +2 | 91-103 | Triacylglycerides, Fatty Acids | 2024 |
*Matrix Effect = [(Response in post-spiked matrix extract / Response in pure solvent) - 1] x 100%. Negative indicates suppression, positive indicates enhancement.
Detailed Experimental Protocols
Protocol 1: Modified QuEChERS for Leaf Tissue (Targeting Alkaloids & Phenolics)
Principle: Quick, Easy, Cheap, Effective, Rugged, and Safe (QuEChERS) method adapted for pigment- and lipid-rich leaves.
Materials:
- Frozen plant tissue (lyophilized and ground to <0.5 mm particles)
- Liquid nitrogen, homogenizer
- Extraction solvent: Acetonitrile:Water:Formic acid (80:19:1, v/v/v)
- Buffered Salts: 4g MgSO4, 1g NaCl, 1g Trisodium citrate dihydrate, 0.5g Disodium hydrogen citrate sesquihydrate per sample.
- dSPE Clean-up sorbent: 150 mg MgSO4, 50 mg PSA, 50 mg C18EC, 7.5 mg GCB per 1 mL extract.
- Centrifuge, vortex mixer, LC-MS vials.
Procedure:
- Homogenization: Weigh 100 mg of lyophilized powder into a 50 mL centrifuge tube.
- Extraction: Add 10 mL of the chilled extraction solvent. Vortex vigorously for 1 min. Sonicate for 10 min at 4°C.
- Salting Out: Add the buffered salt mixture, immediately seal, and shake for 1 min. Centrifuge at 8000 x g for 5 min at 10°C.
- Clean-up: Transfer 1 mL of the supernatant (acetonitrile layer) to a dSPE tube containing the sorbent mixture. Vortex for 30 sec.
- Clarification: Centrifuge at 12000 x g for 3 min. Filter the supernatant through a 0.22 μm PTFE syringe filter.
- Analysis: Transfer to an LC-MS vial. Evaporate under nitrogen and reconstitute in 100 μL initial mobile phase for LC-MS injection.
Protocol 2: Two-Dimensional Solid-Phase Extraction (2D-SPE) for Complex Root Extracts
Principle: Sequential clean-up using orthogonal sorbents to remove non-polar and polar interferences in a single automated workflow.
Materials:
- Crude methanolic root extract (post-evaporation, reconstituted in 5% MeOH).
- SPE Manifold (automated preferred).
- 1st Cartridge: C18-E (500 mg, 6 mL). 2nd Cartridge: Mixed-Mode Cation Exchange (MCX, 60 mg, 3 mL).
- Conditioning solvents: MeOH, Water.
- Wash/Elution solvents: Water, 5% MeOH (v/v), 0.1% FA in MeOH.
Procedure:
- Conditioning: Condition C18 cartridge with 6 mL MeOH, then 6 mL H2O. Do not let dry.
- Loading & 1st Clean-up: Load the crude sample. Wash with 6 mL of 5% MeOH to elute neutral/polar interferences. Discard flow-through.
- Elution from C18: Elute retained semi-polar compounds with 6 mL of 0.1% FA in MeOH. Collect eluate.
- 2nd SPE Loading: Dilute the C18 eluate with 20 mL H2O (acidify with FA if needed). Load onto pre-conditioned MCX cartridge.
- Final Elution: Wash MCX with 3 mL 0.1% FA in MeOH. Elute basic/secondary metabolites with 3 mL of 5% NH4OH in MeOH. Collect.
- Analysis: Evaporate the final eluate to dryness. Reconstitute in appropriate solvent for LC-MS/MS analysis.
Visualizations
Diagram 1: Generalized Workflow for Plant Metabolite Analysis (79 chars)
Diagram 2: Simplified Pathways to Key Secondary Metabolite Classes (96 chars)
The Scientist's Toolkit: Research Reagent Solutions
Table 2: Essential Materials for Plant Matrix Sample Preparation
| Item | Function/Benefit |
|---|---|
| Freeze Dryer (Lyophilizer) | Removes water at low temperature, preserving thermolabile metabolites and creating a stable, easily homogenized powder. |
| Cryogenic Mill/Homogenizer | Efficiently pulverizes tough, fibrous plant material into a fine, homogeneous powder using liquid nitrogen, ensuring representative sampling. |
| Dispersive SPE Kits (dSPE) | Modified with PSA (for polar organics), C18 (lipids), GCB (pigments), and MgSO4 (water) for rapid, effective post-extraction clean-up. |
| Mixed-Mode SPE Cartridges (e.g., MCX, MAX, WAX) | Provide orthogonal selectivity (reverse-phase + ion-exchange) for isolating acidic, basic, or neutral compounds from complex plant extracts. |
| LC Columns: C18 with Polar Embedding (e.g., BEH Shield RP18) | Improves retention and peak shape for polar secondary metabolites (e.g., phenolic acids, glycosides) in aqueous-rich mobile phases. |
| Internal Standards (Deuterated or 13C-Labeled Analogs) | Critical for correcting matrix effects (ion suppression/enhancement) and losses during sample preparation for accurate quantification via LC-MS/MS. |
| Mass Spectrometry-Compatible Buffers (Ammonium Formate/Acetate, FA) | Provide volatile salts and pH control for efficient ionization in ESI and clean MS source operation, avoiding signal loss. |
Step-by-Step LC-MS Protocol Development: Extraction, Separation, and Detection
Within the broader thesis on developing a robust LC-MS protocol for plant secondary metabolites research, the sample preparation stage is critical. This phase dictates the accuracy and reproducibility of downstream analysis by ensuring the true metabolic profile is captured, interfering compounds are minimized, and analytes are stabilized for LC-MS detection. This application note details optimized protocols for quenching metabolic activity, selecting extraction solvents, and implementing clean-up strategies tailored for complex plant matrices.
Quenching of Metabolic Activity
The immediate halt of enzymatic activity upon harvesting is essential to preserve the in vivo metabolic state.
Protocol: Rapid Freeze-Quenching with Liquid Nitrogen
Objective: To instantaneously quench metabolism and preserve labile secondary metabolites.
Materials:
- Fresh plant tissue (e.g., leaf, root, bark).
- Liquid nitrogen in a dewar.
- Pre-cooled mortar and pestle (store at -80°C or in liquid nitrogen vapor for >30 min).
- Pre-labeled, pre-cooled 2.0 mL cryogenic vials.
- Forceps and spatulas (pre-cooled).
- Safety equipment: cryogenic gloves, face shield, lab coat.
Methodology:
- Harvest: Excise the plant tissue rapidly using sharp, clean tools.
- Quench: Immediately submerge the tissue in liquid nitrogen (<5 seconds post-excision). Hold for 60 seconds to ensure complete thermal equilibration.
- Grinding: Under continuous liquid nitrogen cooling, grind the tissue to a fine, homogeneous powder using the pre-cooled mortar and pestle. Add more liquid nitrogen as needed to keep the tissue frozen.
- Aliquoting: Using the pre-cooled spatula, quickly transfer aliquots (e.g., 50-100 mg) of the frozen powder into the pre-cooled cryogenic vials.
- Storage: Immediately place vials at -80°C for long-term storage. Avoid freeze-thaw cycles.
The Scientist's Toolkit: Quenching Essentials
| Item | Function/Benefit |
|---|---|
| Liquid Nitrogen | Provides rapid temperature drop to -196°C, instantly halting all enzymatic and chemical activity. |
| Pre-cooled Cryogenic Vials | Prevents partial thawing during sample transfer, maintaining metabolic quench. |
| Pre-cooled Mortar & Pestle | Enables homogeneous powder generation without thawing, ensuring representative sub-sampling. |
| Cryogenic Mill (Alternative) | For high-throughput or tough tissues, provides automated, controlled, and reproducible grinding at liquid nitrogen temperatures. |
Diagram 1: Liquid Nitrogen Quenching Workflow for Plant Tissue
Solvent Selection for Metabolite Extraction
The choice of extraction solvent is a compromise between polarity, selectivity, and compatibility with LC-MS.
Protocol: Dual-Phase Methanol/Water/Chloroform Extraction for Broad Coverage
Objective: To extract a wide range of secondary metabolites (polar to mid-polar).
Materials:
- Quenched plant powder (50 mg ± 0.1 mg).
- Pre-cooled (-20°C) methanol (HPLC grade).
- Pre-cooled (-20°C) water (LC-MS grade).
- Pre-cooled (-20°C) chloroform (HPLC grade).
- Cold 2.0 mL microcentrifuge tubes.
- Refrigerated centrifuge (4°C capability).
| Solvent System | Ratio (v/v/v) | Target Metabolite Classes | LC-MS Compatibility Notes |
|---|---|---|---|
| Methanol/Water | 80:20 | High Polarity: Phenolic acids, flavonoids (glycosides), alkaloids, carbohydrates. | Excellent. Low ion suppression. Compatible with RPLC & HILIC. |
| Methanol/Water/Chloroform | 8:4:3 | Broad Range: As above, plus Mid-Low Polarity: Terpenoids, aglycones, some lipids. | Chloroform must be evaporated; reconstitute in MeOH/H2O for RPLC. |
| Acetonitrile/Water | 80:20 | High Polarity (Alternative): Provides different selectivity, excellent for HILIC-MS. | Excellent. Low background. Preferred for proteomics/metabolomics. |
| Acidified Methanol (e.g., 1% Formic Acid) | - | Acidic/Basic Compounds: Stabilizes alkaloids, certain phenolics. | Enhances ionization in +ESI mode. Check column stability at low pH. |
Post-Extraction Clean-up Strategies
Removing pigments, lipids, and polymers is crucial for column longevity and reducing matrix effects in LC-MS.
Protocol: Solid-Phase Extraction (SPE) Clean-up using C18 Cartridges
Objective: To remove chlorophyll and non-polar interferences from polar/medium-polar metabolite extracts.
Materials:
- Crude extract in MeOH/H2O or reconstituted extract.
- C18 SPE cartridges (e.g., 100 mg/1 mL).
- Conditioning solvents: Methanol, LC-MS grade water.
- Elution solvent: Methanol/Water (e.g., 80:20 or as optimized).
- Vacuum manifold or centrifuge for SPE.
- Collection tubes.
- Nitrogen evaporator.
Methodology:
- Condition: Load cartridge with 1 mL methanol, apply gentle vacuum. Follow with 1 mL water. Do not let the sorbent dry.
- Equilibrate: Add 1 mL of solvent matching your sample's starting composition (e.g., 5% MeOH in water). Discard flow-through.
- Load: Apply the centrifuged supernatant of your crude extract. Slow flow rate (<1 mL/min) is optimal.
- Wash: Pass through 1-2 mL of a weak solvent (e.g., 5-10% methanol in water) to remove salts and very polar interferences. Discard.
- Elute: Elute target metabolites with 2 x 0.5 mL of your optimized elution solvent (e.g., 80% methanol) into a clean collection tube.
- Concentrate: Evaporate the eluate to dryness under a gentle stream of nitrogen or in a vacuum concentrator.
- Reconstitute: Redissolve the dried extract in an appropriate volume (e.g., 100 µL) of the initial mobile phase for your LC-MS method. Vortex thoroughly, centrifuge, and transfer to an LC vial.
Diagram 2: SPE Clean-up Process for Plant Extracts
Integrated Protocol: From Tissue to LC-MS Vial
Workflow Integration:
- Quench & Weigh: Perform liquid nitrogen quenching as in Protocol 1. Precisely weigh 50.0 mg of frozen powder into a cold 2 mL tube.
- Extract: Add 1 mL of pre-cooled (-20°C) extraction solvent (e.g., MeOH/H2O/CHCl3, 8:4:3). Vortex vigorously for 10 sec.
- Homogenize: Use a chilled bead homogenizer (4°C) for 2 minutes at high frequency.
- Centrifuge: Spin at 14,000 x g for 15 minutes at 4°C.
- Separate (for biphasic): For chloroform-containing solvent, carefully collect the upper (polar) and lower (non-polar) phases into separate tubes. Evaporate the polar phase under nitrogen.
- Clean-up: Reconstitute the dried polar extract in 200 µL of 5% methanol. Follow Protocol 3 (SPE Clean-up).
- Finalize: Reconstitute the final SPE eluate in 100 µL of initial LC mobile phase, filter through a 0.22 µm PTFE syringe filter, and transfer to an LC-MS vial.
Optimized sample preparation is the non-negotiable foundation for reliable plant secondary metabolite profiling via LC-MS. The protocols detailed herein—emphasizing instantaneous quenching, rationally selected solvent systems, and strategic clean-up—directly support the core thesis by enhancing metabolite recovery, reducing analytical variability, and minimizing matrix effects. This rigorous approach ensures that the data generated reflects biological reality, forming a robust basis for subsequent discovery and quantification in plant biochemistry and drug development research.
Within a broader thesis on LC-MS protocols for plant secondary metabolites research, the development of a robust liquid chromatography (LC) method is a critical foundational step. This application note details the systematic approach for selecting reverse-phase columns and optimizing mobile phase compositions to achieve high-resolution separation of complex plant metabolite extracts, ensuring compatibility with mass spectrometric detection for qualitative and quantitative analysis.
The separation of plant secondary metabolites—including flavonoids, alkaloids, terpenoids, and phenolic acids—presents unique challenges due to their diverse chemical structures, wide polarity range, and often similar isomeric forms. Reverse-phase liquid chromatography (RPLC) remains the dominant mode. The selection of the stationary phase (column) and the mobile phase chemistry are interdependent decisions that dictate selectivity, efficiency, and MS compatibility.
Critical Column Parameters for Metabolite Separation
Column selection is guided by stationary phase chemistry, particle size, pore size, column dimensions, and operating pressure.
Table 1: Comparison of Common Reverse-Phase Stationary Phases
| Stationary Phase | Key Characteristics | Best For (Metabolite Class) | Typical pH Range | Notes |
|---|---|---|---|---|
| C18 (Octadecylsilane) | High hydrophobicity, broad applicability. | Medium to non-polar compounds (flavonoids, terpenoids). | 2-8 | Most common; offers varied selectivity from different manufacturers. |
| C8 (Octylsilane) | Moderate hydrophobicity. | Mid-polarity compounds, larger molecules. | 2-8 | Slightly different selectivity vs. C18; can reduce retention of very hydrophobic compounds. |
| Phenyl / Phenethyl | π-π interactions with aromatic groups. | Aromatic metabolites (phenolic acids, flavonoids). | 2-8 | Enhances separation of structural isomers via planar interactions. |
| Polar-Embedded (e.g., Amide, Ether) | Reduced hydrophobic collapse, residual polarity. | Polar metabolites (glycosides, polar acids). | 2-8 | Improved retention and peak shape for very polar compounds under aqueous conditions. |
| HILIC (Silica, Amino, Cyano) | Hydrophilic interaction, normal-phase mode. | Very polar, hydrophilic metabolites (sugars, organic acids). | 2-8 | Used with high organic mobile phases; orthogonal to RPLC. |
Table 2: Column Physical Parameter Guidelines
| Parameter | Standard Option | High-Efficiency Option | Rationale |
|---|---|---|---|
| Length | 100-150 mm | 50-100 mm | Balances resolution and analysis time. Shorter columns for faster screening. |
| Internal Diameter | 2.1 mm (for MS) | 1.0 mm (for nano-MS) | 2.1 mm id offers optimal flow for ESI sensitivity. |
| Particle Size | 2.6-3.0 μm (superficially porous) | <2 μm (fully porous) | Smaller particles increase efficiency but require higher pressure. |
| Pore Size | 80-120 Å | 130-300 Å | 120 Å standard for small molecules. Larger pores beneficial for larger metabolites. |
Mobile Phase Optimization for Selectivity and MS Compatibility
Mobile phase choice affects ionization efficiency, chromatographic peak shape, and selectivity. Volatile buffers are mandatory for LC-MS.
Table 3: Common LC-MS Mobile Phase Additives and Buffers
| Component | Typical Concentration | Function & Metabolite Class Consideration | MS Compatibility Notes |
|---|---|---|---|
| Formic Acid | 0.1% (v/v) | Provides protons for positive ion mode; improves peak shape for acids. | Excellent volatility. Most common for positive ESI. |
| Acetic Acid | 0.1-0.5% (v/v) | Weaker acid than formic; different selectivity for organic acids/bases. | Excellent volatility. |
| Ammonium Formate | 2-10 mM | Volatile buffer; useful for pH control (~pH 3.5-4). | Excellent volatility. Good for both positive/negative modes. |
| Ammonium Acetate | 2-10 mM | Volatile buffer; useful for pH control (~pH 4.5-5.5). | Excellent volatility. Neutral pH useful for various modes. |
| Ammonium Hydroxide | 0.1% (v/v) | Used in basic mobile phases for negative ion mode analysis. | Volatile. Requires compatible column (high-pH stable). |
Gradient Elution Protocol: A generic starting gradient for plant metabolite screening on a C18 column (100 x 2.1 mm, 2.6 μm) is:
- Mobile Phase A: Water with 0.1% Formic Acid
- Mobile Phase B: Acetonitrile with 0.1% Formic Acid
- Flow Rate: 0.3 - 0.4 mL/min
- Column Temp: 40 °C
- Gradient: 5% B (0-2 min), 5% → 95% B (2-30 min), 95% B (30-35 min), 95% → 5% B (35-35.1 min), 5% B (35.1-40 min) for re-equilibration.
Experimental Protocol: Systematic Method Scouting
Objective: To empirically determine the optimal column and mobile phase combination for separating a target plant metabolite extract.
Materials:
- Test extract of plant material (e.g., Ginkgo biloba, Hypericum perforatum).
- LC-MS system with binary pump, column oven, and autosampler.
- Mass spectrometer (e.g., Q-TOF, Orbitrap, or TQ-MS).
- Candidate columns (e.g., C18, Phenyl, Polar-embedded, all same dimensions).
- HPLC-grade water, acetonitrile, methanol.
- Buffer salts/additives (formic acid, ammonium formate).
Procedure:
- Sample Prep: Prepare extract in a solvent composition close to the initial mobile phase (e.g., 80:20 A:B). Centrifuge and filter (0.22 μm).
- Initial Conditions: Start with a generic gradient (as above) on a standard C18 column.
- Column Screening: Inject the sample on each candidate column using the identical generic gradient. Monitor UV (e.g., 254, 280 nm) and/or TIC from MS.
- Mobile Phase Screening: Select the best 1-2 columns. Test different modifiers:
- Test 1: 0.1% Formic Acid in both A and B.
- Test 2: 10 mM Ammonium Formate (pH ~3.8).
- Test 3: 0.1% Acetic Acid.
- (For negative mode) Test 4: 10 mM Ammonium Acetate (pH ~5) or 0.1% NH₄OH.
- pH Adjustment: If needed, use pH-stable columns to test narrow pH ranges (e.g., pH 3, 5, 7) using ammonium buffers to manipulate selectivity.
- Organic Modifier: Compare acetonitrile vs. methanol using the selected buffer. Methanol offers different selectivity and strength.
- Gradient Optimization: For the best combination, adjust gradient steepness (e.g., 30, 60, 90 min gradients) to assess resolution gains. Fine-tune starting and ending %B.
- Data Analysis: Use chromatographic software to calculate key metrics: peak capacity, resolution of critical pairs, asymmetry factor, and S/N for key analytes.
Visualization of Method Development Workflow
Title: LC Method Development Workflow
The Scientist's Toolkit: Essential Research Reagents & Materials
Table 4: Key Research Reagent Solutions for LC Method Development
| Item | Function in Metabolite LC-MS | Example/Brand Notes |
|---|---|---|
| High-Purity Water (LC-MS Grade) | Mobile phase base; minimizes background ions and noise. | Opt for 18.2 MΩ·cm resistivity, TOC < 5 ppb. |
| LC-MS Grade Acetonitrile & Methanol | Organic mobile phase modifiers; different selectivity and elution strength. | Low UV cutoff, low residue after evaporation. |
| Volatile Additives (Formic/Acetic Acid) | Modifies mobile phase pH, improves peak shape, aids protonation/deprotonation. | Opt for ≥99% purity in LC-MS grade. |
| Volatile Buffer Salts (Ammonium Formate/Acetate) | Provides buffering capacity for reproducible retention times without MS contamination. | Prepare fresh solutions, filter. |
| Analytical Reference Standards | Essential for peak identification, determining retention time, and optimizing selectivity. | Isolate from plants or purchase (e.g., Sigma-Aldrich, Extrasynthese). |
| Column Regeneration & Storage Solvents | Maintains column performance and longevity. | High-purity solvents without buffers (e.g., MeOH/ACN, water). |
| Sample Filtration Units (0.22 μm) | Removes particulates from samples to prevent column blockage. | Use nylon or PTFE membranes; avoid cellulose for organic solvents. |
| Vial Inserts with Limited Volume | Maximizes injection precision for small sample volumes in autosamplers. | Polypropylene inserts with polymer feet. |
This application note provides detailed protocols for mass spectrometry (MS) parameter optimization, framed within a thesis investigating plant secondary metabolites (e.g., alkaloids, flavonoids, terpenoids) using Liquid Chromatography-Mass Spectrometry (LC-MS). Precise tuning of ionization sources, fragmentation parameters, and data acquisition modes is critical for the sensitive, selective, and comprehensive analysis of these complex compounds.
Ionization Source Parameter Optimization
Selection and tuning between Electrospray Ionization (ESI) and Atmospheric Pressure Chemical Ionization (APCI) is compound-dependent.
Table 1: Comparative Guide for Ionization Source Selection and Typical Parameters
| Parameter | ESI (Polar, Ionic, Thermally Labile Compounds) | APCI (Less Polar, Thermally Stable Compounds) |
|---|---|---|
| Typical Analytes | Flavonoid glycosides, alkaloids, saponins | Terpenes, carotenoids, aglycones |
| Source Temperature | 100-150°C (Desolvation) | 350-500°C (Vaporizer) |
| Capillary Voltage | 2.5-4.0 kV (Positive); 2.0-3.5 kV (Negative) | 3-5 kV (Discharge Current) |
| Nebulizer Gas (N2) | 20-50 psi | 30-60 psi |
| Drying Gas (N2) | 8-12 L/min, 250-350°C | 4-7 L/min, 250-350°C |
| Cone Voltage/Sheath Gas | 20-80 V / 30-50 arb (Assists Desolvation) | N/A (Vaporizer-driven) |
| Optimal Flow Rate | 0.1-0.5 mL/min (Standard) | 0.2-1.0 mL/min (Standard) |
Protocol: Systematic Ionization Source Tuning
Objective: To optimize ESI/APCI parameters for maximum [M+H]+/[M-H]- signal intensity for target metabolites.
- Prepare a standard solution (1 µg/mL) of a representative metabolite in mobile phase.
- Infuse the standard directly via syringe pump at 10 µL/min.
- For ESI: Start with mid-range values: Capillary Voltage: 3.0 kV, Source Temp: 120°C, Nebulizer: 30 psi, Drying Gas: 10 L/min at 300°C.
- For APCI: Start with: Vaporizer: 400°C, Discharge Current: 4.0 µA (Pos), Nebulizer: 40 psi, Drying Gas: 5 L/min at 300°C.
- In full-scan MS mode (e.g., m/z 50-1000), vary one parameter at a time while monitoring the total ion count (TIC) and extracted ion chromatogram (EIC) of the target ion.
- Record the parameter value yielding the maximum stable signal. Iterate for all key parameters.
- Validate the final optimized set using a mixture of standards spanning the polarity range of your samples.
Fragmentation Parameter Optimization
Collision-induced dissociation (CID) energy must be optimized to generate informative fragment patterns.
Table 2: Recommended Collision Energy Ranges for Plant Metabolite Classes
| Metabolite Class | Example Compound | Precursor Ion Type | Optimal Normalized Collision Energy Range (eV)* | Key Diagnostic Fragments |
|---|---|---|---|---|
| Flavonoid O-glycosides | Quercetin-3-O-glucoside | [M-H]- | 20-35 | Y0- (aglycone), cross-ring cleavages |
| Alkaloids | Berberine | [M]+ | 35-50 | Ring cleavage, neutral losses (CH3, H2O) |
| Terpenoid Glycosides | Ginsenoside Rb1 | [M+CH3COO]- | 40-60 | Sequential sugar losses, aglycone ions |
| Hydroxycinnamic Acids | Chlorogenic acid | [M-H]- | 15-25 | Quinic acid moiety (m/z 191), caffeic acid loss |
Note: Energy values are instrument-dependent. The table assumes a unit mass-resolving quadrupole.
Protocol: Stepped Collision Energy Optimization for MS/MS
Objective: To determine the ideal collision energy for structural elucidation of a target ion.
- Using the optimized ionization source, infuse the standard.
- In product ion scan (MS/MS) mode, isolate the precursor ion with an isolation width of 1-2 m/z.
- Use a stepped collision energy function. Example: Acquire MS/MS spectra at 10, 20, 30, 40, and 50 eV in a single run.
- Analyze the resulting spectra. The optimal energy is a compromise that:
- Produces several informative fragment ions (not just the precursor depleted).
- Maintains the intensity of key structural fragments.
- Avoids complete fragmentation to very low m/z, non-specific ions.
- For untargeted screening, implement data-dependent acquisition (DDA) with a dynamic collision energy ramp (e.g., 20-45 eV) based on precursor m/z and charge state.
Data Acquisition Mode Selection
The choice of scan mode dictates the breadth and depth of information captured.
Table 3: Data Acquisition Modes for Targeted and Untargeted Analysis
| Acquisition Mode | Primary Use | Key Parameters to Tune | Advantage for Plant Metabolomics |
|---|---|---|---|
| Full Scan | Untargeted profiling, broad detection. | Scan Range, Scan Time/Resolution. | Captures all ionizable compounds; ideal for fingerprinting. |
| SIM (Selected Ion Monitoring) | High-sensitivity targeted quantitation of known ions. | Dwell Time, Target m/z(s). | 10-100x gain in sensitivity for pre-defined compounds (e.g., low-abundance toxins). |
| Product Ion Scan (MS/MS) | Structural confirmation/elucidation. | Collision Energy, Isolation Width. | Generates fragment fingerprints for library matching. |
| Data-Dependent Acquisition (DDA) | Automated MS/MS on top-intensity ions. | Intensity Threshold, Exclusion List, CE Ramp. | Balances discovery and structural information without prior targeting. |
| Data-Independent Acquisition (DIA) | Comprehensive, reproducible MS/MS on all ions. | Isolation Windows (e.g., 20-30 m/z), CE. | No missing data; enables retrospective analysis; complex deconvolution needed. |
Protocol: Setting Up a DDA Method for Untargeted Screening
Objective: To automatically acquire MS/MS spectra for the most abundant ions in a complex plant extract.
- Begin with a full scan survey (m/z 100-1500, scan time 0.2 sec).
- Set an intensity threshold (e.g., 5000 counts) to trigger MS/MS scans.
- Set a maximum number of concurrent MS/MS scans per cycle (e.g., 5).
- Apply dynamic exclusion: exclude precursors for 15 seconds after 2 spectra to focus on co-eluting, lower-abundance ions.
- Use an isolation width of 1.3 m/z and a normalized collision energy ramp (e.g., 25, 35, 45 eV).
- Cycle time should be as short as possible to obtain sufficient data points across chromatographic peaks (>12 points/peak).
LC-MS Parameter Tuning Decision Workflow
The Scientist's Toolkit: Key Research Reagent Solutions
Table 4: Essential Materials for LC-MS Method Development in Plant Metabolomics
| Item | Function & Rationale |
|---|---|
| Authentic Standard Mixtures | Contains representative compounds (e.g., flavonoid, alkaloid, terpene). Used for retention time indexing, ionization/fragmentation optimization, and quantitative calibration. |
| Stable Isotope-Labeled Internal Standards (SIL-IS) | (e.g., 13C-, 15N-, or 2H-labeled analogs). Compensates for matrix effects and variability in extraction/ionization; essential for precise quantitation. |
| Quality Control (QC) Pooled Sample | A pooled aliquot of all study samples. Injected repeatedly throughout the sequence to monitor system stability, reproducibility, and for data normalization in untargeted studies. |
| LC-MS Grade Solvents & Buffers | Acetonitrile, Methanol, Water, Formic Acid, Ammonium Acetate/Formate. Minimize chemical noise, background ions, and column/source contamination. |
| Specialized LC Columns | C18 (reversed-phase), HILIC, Phenyl-Hexyl. Different selectivity for separating diverse metabolite classes based on polarity and structure. |
| Tuning/Calibration Solutions | Vendor-specific mixes (e.g., sodium formate, ESI Tuning Mix). For mass axis calibration and daily performance verification of the MS system. |
Within the framework of developing robust LC-MS protocols for plant secondary metabolites, the choice between targeted quantification and untargeted profiling is fundamental. Targeted methods focus on precise measurement of predefined compounds (e.g., specific alkaloids, flavonoids, terpenoids), offering high sensitivity and reproducibility for hypothesis-driven research. Untargeted methods aim to comprehensively detect as many metabolites as possible, enabling discovery-driven studies and hypothesis generation. This application note delineates the protocols, applications, and data outputs for both approaches.
Table 1: Core Comparison of Targeted vs. Untargeted Metabolomics
| Parameter | Targeted Quantification | Untargeted Profiling |
|---|---|---|
| Objective | Accurate absolute/semi-quantification of known analytes | Global detection & relative quantification of known/unknown features |
| Hypothesis | Confirmatory, hypothesis-driven | Exploratory, hypothesis-generating |
| LC-MS Method | Optimized, high-resolution SRM/MRM on triple quadrupole or high-res MS | Broad, high-resolution Full Scan (e.g., Q-TOF, Orbitrap) |
| Data Acquisition | Selective ion monitoring | Data-Dependent (DDA) or Data-Independent (DIA) acquisition |
| Throughput | High (short runs) | Lower (longer runs for separation) |
| Identification Level | Confirmed with authentic standards | Level 2-4 (annotations based on MS/MS, libraries, in silico) |
| Quantification | Absolute using calibration curves | Relative (fold-change, peak area) |
| Key Metric | Accuracy, Precision, Limit of Quantification (LOQ) | Metabolite Coverage, Reproducibility of feature detection |
Table 2: Typical Quantitative Data Output Examples
| Approach | Analyte (Example) | Conc. in Sample A (µg/g FW) | Conc. in Sample B (µg/g FW) | Fold-Change | p-value |
|---|---|---|---|---|---|
| Targeted | Nicotine (Tobacco leaf) | 12.5 ± 0.8 | 25.3 ± 1.2 | 2.02 | <0.001 |
| Targeted | Berberine (Goldenseal root) | 5.1 ± 0.3 | 1.2 ± 0.2 | 0.24 | <0.001 |
| Untargeted | Feature m/z 357.118 [M+H]+ | 1.5e6 ± 8e4 (Area) | 4.2e6 ± 2e5 (Area) | 2.80 | 0.003 |
| Untargeted | Feature m/z 609.146 [M-H]- | 8.3e5 ± 7e4 (Area) | 2.1e5 ± 3e4 (Area) | 0.25 | 0.001 |
Detailed Experimental Protocols
Protocol 1: Targeted Quantification of Alkaloids via LC-MS/MS (MRM)
Objective: Absolute quantification of specific alkaloids (e.g., morphine, codeine) in Papaver somniferum latex extracts. Sample Prep: 1. Homogenize 100 mg latex in 1 mL 80% MeOH/H₂O with 0.1% Formic Acid. 2. Sonicate (15 min), centrifuge (15,000 g, 10 min, 4°C). 3. Dilute supernatant 1:10 with mobile phase A, filter (0.22 µm PTFE). LC Method: Column: C18 (100 x 2.1 mm, 1.8 µm). Temp: 40°C. Flow: 0.3 mL/min. Mobile Phase A: H₂O + 0.1% FA; B: ACN + 0.1% FA. Gradient: 5% B to 95% B over 12 min, hold 2 min. MS Method: Ionization: ESI+. MS Platform: Triple Quadrupole. Scan Type: Multiple Reaction Monitoring (MRM). Key Parameters: Optimized compound-specific precursor → product ion transitions, dwell times, collision energies. Use deuterated internal standards for each analyte. Quantification: Integrate MRM peaks. Generate a 6-point calibration curve (e.g., 1-500 ng/mL) for each analyte using analyte/internal standard peak area ratio. Apply linear regression (1/x² weighting). Report concentration per fresh weight.
Protocol 2: Untargeted Profiling of Plant Root Extracts via LC-HRMS
Objective: Global metabolic profiling of Salvia miltiorrhiza roots under stress vs. control conditions. Sample Prep: 1. Grind 50 mg lyophilized root to powder. 2. Extract with 1 mL 70% MeOH/H₂O (vortex 1 min, sonicate 30 min, -20°C incubation 1 hr). 3. Centrifuge (15,000 g, 15 min, 4°C). 4. Collect supernatant, dry under nitrogen. 5. Reconstitute in 100 µL 10% ACN for LC-MS. LC Method: Column: HSS T3 (150 x 2.1 mm, 1.8 µm). Temp: 45°C. Flow: 0.25 mL/min. Mobile Phase A: H₂O + 0.1% FA; B: ACN + 0.1% FA. Gradient: 1% B to 99% B over 18 min. MS Method: Ionization: ESI+ and ESI- (separate runs). MS Platform: Q-TOF or Orbitrap. Scan Type: Full Scan (m/z 70-1050) at high resolution (≥70,000 FWHM). DDA: Top 10 most intense ions per cycle fragmented. Data Processing: Use software (e.g., MS-DIAL, XCMS, Compound Discoverer) for peak picking, alignment, deconvolution, and gap filling. Annotate using public MS/MS libraries (e.g., GNPS, MassBank) and in silico tools (SIRIUS, CSI:FingerID). Perform statistical analysis (PCA, t-test, fold-change) to identify significant features.
Pathway & Workflow Diagrams
Decision Workflow for Metabolomics Approaches
Flavonoid Biosynthesis Pathway Overview
The Scientist's Toolkit: Key Research Reagent Solutions
Table 3: Essential Materials for Plant Metabolomics LC-MS Workflows
| Item / Reagent Solution | Function & Application | Example (Vendor Neutral) |
|---|---|---|
| SPE Cartridges (C18, HLB) | Clean-up and pre-concentration of metabolites from complex plant extracts; remove salts and pigments. | Reverse-phase solid-phase extraction columns. |
| Deuterated Internal Standards | Critical for targeted quantification; corrects for matrix effects and ionization variability in MS. | d3-Morphine, d6-Caffeic Acid, d4-Succinic Acid. |
| MS-Grade Solvents & Additives | Ensure minimal background noise, ion suppression, and column degradation in sensitive LC-MS. | LC-MS Grade Water, Acetonitrile, Methanol, Formic Acid. |
| Retention Time Index (RTI) Kits | For untargeted LC-MS: calibrates RT across runs, improving alignment and identification confidence. | Fatty acid methyl ester (FAME) mix or other calibrant series. |
| QuEChERS Extraction Kits | Standardized, efficient extraction for a broad range of secondary metabolites; minimizes phospholipids. | Pre-packaged salts and dispersive SPE sorbents. |
| Commercial MS/MS Libraries | Annotate untargeted data by matching experimental MS2 spectra to reference spectra. | Plant-specific metabolome libraries, GNPS/MassBank access. |
| Quality Control (QC) Pool Sample | A pooled mixture of all study samples; run repeatedly to monitor system stability and data quality. | Essential for both targeted and untargeted workflows. |
| UHPLC Columns (C18, HILIC) | High-resolution separation of diverse metabolite classes based on hydrophobicity or polarity. | 1.7-1.8µm particle size, 100-150mm length columns. |
Solving Common LC-MS Challenges in Plant Metabolite Analysis: A Troubleshooting Manual
Addressing Matrix Effects and Ion Suppression in Complex Plant Extracts
Within the broader thesis on developing a robust LC-MS protocol for plant secondary metabolites research, addressing matrix effects (ME) and ion suppression/enhancement is paramount. Complex plant extracts contain myriad co-eluting compounds—sugars, lipids, polyphenols, alkaloids—that can significantly alter ionization efficiency in the ESI source, compromising quantitative accuracy and method sensitivity. This application note provides current, detailed protocols for the identification, evaluation, and mitigation of these effects to ensure reliable analytical data for drug discovery and phytochemical research.
Quantifying Matrix Effects: Key Approaches and Data
The following table summarizes common methods for assessing matrix effects, along with typical quantitative outcomes from recent studies on plant extracts.
Table 1: Methods for Matrix Effect Quantification in Plant Extracts
| Method | Formula/Description | Interpretation | Typical Range in Complex Plant Extracts (Literature Data) |
|---|---|---|---|
| Post-Extraction Spiking | ME (%) = [(Peak Area in Matrix / Peak Area in Solvent) - 1] × 100 | < -20% = Suppression± 20% = Acceptable> +20% = Enhancement | -65% to +40% (Varies by metabolite class and matrix) |
| Post-Column Infusion | Qualitative visualization of ion suppression zones in chromatographic baseline. | Identifies regions of severe suppression. | N/A (Qualitative) |
| Matrix Factor (MF) | MF = Peak Area Ratio (IS/Analyte) in Matrix / Peak Area Ratio (IS/Analyte) in SolventIS = Stable Isotope-Labeled Internal Standard (Preferred) | MF = 1: No MEMF < 1: SuppressionMF > 1: Enhancement | 0.35 - 1.8 (Without mitigation) |
| Standard Addition Method | Spiking known analyte amounts into successive aliquots of sample matrix. | Accounts for ME directly in calibration; slope comparison indicates ME. | Slope difference vs. solvent calibration: 10-80% |
Table 2: Impact of Clean-Up Techniques on Matrix Effects (Representative Data)
| Clean-Up Technique | Target Matrix Interferents | Reported Reduction in Ion Suppression (%) | Potential Analyte Loss Risk |
|---|---|---|---|
| SPE (C18) | Non-polar lipids, chlorophyll | 40-70% | Medium (for polar metabolites) |
| QuEChERS | Organic acids, sugars, some pigments | 30-60% | Low-Medium |
| LLE (Hexane wash) | Lipids, waxes | 20-50% | Low (for polar metabolites) |
| Phospholipid Removal SPE | Phospholipids | 60-90% | Low (for non-lipids) |
Detailed Experimental Protocols
Protocol 3.1: Systematic Assessment of Matrix Effects via Post-Extraction Spiking
Objective: To quantitatively determine the extent of ion suppression/enhancement for target analytes in a specific plant extract.
Materials: See The Scientist's Toolkit below. Procedure:
- Prepare Matrix-Blank Extracts: Extract at least five different batches of the plant material using your standard protocol. Pool the supernatants/post-extraction solutions to create a representative matrix blank. Ensure it contains no target analytes (verify via LC-MS).
- Prepare Solutions:
- Standard in Solvent: Prepare a mid-level calibration standard containing all target analytes in pure LC-MS grade solvent (e.g., MeOH/H₂O).
- Spiked Matrix: Spike the same absolute amount of analytes from the standard solution into the pooled matrix blank extract.
- Internal Standard (IS) Solution: Spike an isotopically labeled IS (if available) at a constant concentration into both the Standard in Solvent and Spiked Matrix samples.
- LC-MS Analysis: Inject all samples (n≥5 for each type) in randomized order.
- Calculation: For each analyte, calculate the Matrix Effect (ME%) as:
ME% = [(Mean Peak Area of Analyte in Spiked Matrix) / (Mean Peak Area of Analyte in Standard Solvent) - 1] × 100If using an IS, calculate the Matrix Factor (MF):MF = (Peak Area Analyte / Peak Area IS) in Spiked Matrix / (Peak Area Analyte / Peak Area IS) in Standard Solvent - Interpretation: ME% beyond ±20% or MF significantly deviating from 1.0 indicates a matrix effect requiring mitigation.
Protocol 3.2: Mitigation via Optimized Sample Cleanup (SPE for Phenolic Acids/Flavonoids)
Objective: To reduce ion suppression from organic acids and medium-polarity interferences in a leaf extract.
Procedure:
- Conditioning: Condition a reversed-phase C18 SPE cartridge (e.g., 500 mg) with 5 mL methanol, followed by 5 mL acidified water (0.1% Formic Acid).
- Loading: Load the crude plant extract (pre-evaporated and reconstituted in acidified water). Do not overload; test capacity.
- Washing: Wash with 5-10 mL of acidified water (0.1% FA) or low-percentage aqueous methanol (5-10%) to remove highly polar sugars and acids.
- Elution: Elute target analytes (phenolic acids, flavonoids) with 5-10 mL of methanol or methanol:ethyl acetate (80:20). Collect eluate.
- Concentration: Evaporate the eluate to dryness under a gentle nitrogen stream and reconstitute in the initial LC-MS mobile phase.
- Validation: Re-assess ME using Protocol 3.1 on the cleaned extract.
Visualized Workflows and Pathways
Title: Matrix Effect Assessment and Mitigation Workflow
Title: Mechanism of Ion Suppression in ESI Source
The Scientist's Toolkit: Key Research Reagent Solutions
Table 3: Essential Materials for Addressing Matrix Effects
| Item/Category | Specific Examples & Specifications | Function in Addressing ME/Ion Suppression |
|---|---|---|
| Internal Standards (IS) | Stable Isotope-Labeled Analogs (e.g., [²H₅], [¹³C₆]), Chemical Analog IS. | Gold Standard. Corrects for ME by co-eluting with analyte, experiencing identical suppression. |
| SPE Cartridges | Reversed-Phase (C18), Mixed-Mode (MCX, MAX), Phospholipid Removal (PLR). | Selective removal of matrix interferents (lipids, acids, pigments) prior to LC-MS injection. |
| QuEChERS Kits | Dispersive SPE kits with PSA (for acids), C18, or GCB (for pigments). | Rapid cleanup; PSA binds organic acids and sugars, common suppressors. |
| LC-MS Grade Solvents & Additives | Methanol, Acetonitrile, Water (LC-MS grade). Formic Acid, Ammonium Formate. | Minimize background noise; volatile buffers improve ionization efficiency and reproducibility. |
| UHPLC Columns | Sub-2µm particle, Core-Shell technology columns (e.g., 1.7-1.8µm). | Superior chromatographic resolution to separate analytes from co-eluting matrix compounds. |
| Post-Column Infusion Kit | T-connector, syringe pump, infusion line. | Diagnostic tool to visually identify chromatographic regions of ion suppression. |
Within the context of developing a robust LC-MS protocol for plant secondary metabolite research, optimizing sensitivity and resolution is paramount. These compounds, such as alkaloids, flavonoids, and terpenoids, often exist in complex matrices at low concentrations. This application note details practical strategies to enhance peak shape and signal-to-noise ratio (S/N), directly impacting the accuracy of quantification, the confidence in metabolite identification, and the overall success of phytochemical or drug discovery pipelines.
Key Parameters Affecting Sensitivity and Resolution
Optimal LC-MS performance is achieved by systematically addressing both the chromatographic (LC) and mass spectrometric (MS) dimensions.
| Parameter | Effect on Peak Shape | Effect on S/N | Optimal Adjustment Strategy for Plant Metabolites |
|---|---|---|---|
| Column Temperature | Sharpens peaks by reducing viscosity. | Improves S/N via sharper peaks. | 35-45°C for reversed-phase; higher for complex glycosides. |
| Mobile Phase pH | Controls ionization state, affecting retention & tailing. | Maximizes ion yield in ESI source. | Adjust ±0.2 units around pKa of target acidic/basic metabolites. |
| Gradient Steepness | Directly impacts peak width and resolution. | Shallower gradients improve S/N for co-eluting peaks. | Optimize slope for complex extracts; typically 0.5-1.5% B/min. |
| Flow Rate | Affects column efficiency and peak width. | Lower flow often improves ESI sensitivity. | 0.2-0.4 mL/min for 2.1 mm ID columns for optimal ESI. |
| ESI Source Voltage | Not applicable. | Crucial for efficient droplet formation and ion yield. | Optimize (±0.5 kV) for each compound class in infusion. |
| Capillary Temperature | Not applicable. | Higher temp can improve desolvation but may degrade thermolabile compounds. | Balance (250-350°C); lower for labile saponins/alkaloids. |
| Scan Rate (Orbitrap/MS) | Not applicable. | Faster scans reduce points across LC peak, potentially lowering S/N. | Ensure ≥12-15 points across peak for reliable integration. |
Detailed Experimental Protocols
Protocol 3.1: Systematic Optimization of LC Conditions for Peak Shape
Objective: To achieve symmetric, narrow chromatographic peaks for maximum resolution. Materials: LC system, C18 column (2.1 x 100 mm, 1.7-1.8 µm), standard mix of target metabolites, acidified water (A), acidified acetonitrile (B). Procedure:
- Initial Scouting: Inject standard mix under a generic gradient (e.g., 5-95% B in 10 min). Note peak asymmetry (As) and width.
- pH Optimization: Prepare mobile phases at pH 2.7, 3.5, 4.5, and 6.0 (using formic or ammonium formate). Run the gradient. Select pH providing best As (<1.2) and retention for your analyte set.
- Temperature Optimization: At optimal pH, run analyses at 25, 35, 45, and 55°C. Plot plate number (N) vs. temperature. Select temperature yielding highest N without degradation.
- Gradient Optimization: Using optimal pH and temp, test gradient slopes (e.g., 0.5, 1.0, 1.5, 2.0% B/min). Calculate resolution (Rs) between critical pair. Choose slope giving Rs > 1.5 for all pairs.
- Flow Rate Adjustment: Test flow rates from 0.2 to 0.5 mL/min. Select rate offering best compromise of efficiency (peak shape), backpressure, and ESI compatibility.
Protocol 3.2: ESI Source Optimization for Maximum S/N
Objective: To maximize ion signal while minimizing chemical noise. Materials: MS system, syringe pump, standard solution (100 ng/mL in starting mobile phase). Procedure:
- Direct Infusion: Connect syringe pump to MS via a T-union, with LC flow entering the other port. Infuse standard at 5-10 µL/min.
- Ion Polarity: Determine optimal polarity (positive for alkaloids, negative for phenolics) by scanning a relevant mass range.
- Key Voltage Optimization: While monitoring the [M+H]+ or [M-H]- signal intensity and background noise, sequentially optimize:
- Spray Voltage: Adjust in 0.1-0.2 kV increments (typical range 2.5-4.5 kV).
- Capillary Temperature: Adjust in 25°C increments (typical range 150-350°C).
- Sheath & Aux Gas: Adjust to stabilize and sharpen the signal trace.
- Collision Energy (for SRM/MRM): If performing targeted quantitation, perform a collision energy ramp to find the optimum for precursor→product ion transition for each metabolite.
- Validation: Apply optimized parameters to a full LC-MS run of the standard. Measure the S/N for the target peak compared to a blank injection.
Visualized Workflows and Relationships
Diagram Title: Sequential LC and MS Optimization Workflow.
Diagram Title: Factors Influencing Signal-to-Noise Ratio.
The Scientist's Toolkit: Essential Research Reagent Solutions
Table 2: Key Reagents and Materials for Plant Metabolite LC-MS Optimization
| Item | Function in Optimization | Recommended Example / Specification |
|---|---|---|
| High-Purity MS-Grade Solvents | Minimize background chemical noise in baseline. | Acetonitrile and Water (Optima LC/MS Grade). |
| Volatile Mobile Phase Additives | Facilitate efficient droplet evaporation and ionization in ESI. | Formic Acid, Ammonium Formate, Acetic Acid (≥99% purity). |
| Metabolite-Specific Standard Mix | Essential for tuning MS parameters and evaluating LC performance. | Custom mix containing representative alkaloids, flavonoids, etc. |
| Quality Control (QC) Extract | Pooled sample extract for monitoring system stability and performance over time. | Aliquot of pooled plant extracts from study set. |
| Solid-Phase Extraction (SPE) Cartridges | Clean-up complex plant extracts to reduce matrix effects and column fouling. | Reverse-phase C18 or mixed-mode sorbents. |
| U/HPLC Column with Small Particles | Provides high chromatographic resolution for complex mixtures. | C18, 2.1 x 100 mm, 1.7-1.8 μm particle size. |
| Post-Column Infusion Syringe & T-Union | Hardware for direct MS source parameter optimization via infusion. | Hamilton syringe, PEEK T-union (0.005" bore). |
TROUBLESHOOTING POOR CHROMATOGRAPHY AND UNEXPECTED ADDUCT FORMATION
Abstract Within the context of developing a robust LC-MS protocol for plant secondary metabolites, two critical challenges are poor chromatography (leading to co-elution and ion suppression) and unexpected adduct formation (complicating spectral interpretation and quantification). These application notes provide targeted troubleshooting strategies, experimental protocols for diagnosis and mitigation, and key reagent solutions to ensure data integrity in metabolomics and natural product drug development.
1.0 Diagnosis of Common Chromatographic Issues Poor peak shape, retention time drift, and low resolution directly impact sensitivity and compound identification. The following table summarizes quantitative benchmarks for optimal performance and common failure points.
Table 1: Quantitative Benchmarks for HPLC Performance in Plant Metabolite Analysis
| Parameter | Optimal Range/Value | Indication of Problem |
|---|---|---|
| Peak Asymmetry (As) | 0.8 - 1.2 | >1.5 (tailing) or <0.8 (fronting) |
| Plate Count (N) | >10,000 plates/column | Sudden drop >20% |
| Retention Time Drift | < ±0.1 min over 24 hrs | Systematic drift > ±0.5 min |
| Peak Width at 50% Height | Consistent, < 0.2 min for sharp peaks | Broadening (>0.3 min) |
| Baseline Noise (UV/VIS) | < ±0.5 mAU | High, erratic noise |
| Backpressure | Stable within ±10% of initial | Sudden increase (>50%) or decrease |
Protocol 1.1: Systematic Column Performance Test Objective: Isolate the cause of poor peak shape (column vs. system).
- Prepare Test Mix: Inject a standard mixture of 3-5 well-characterized plant metabolites (e.g., caffeine, rutin, naringenin) spanning a range of polarities.
- Record Parameters: Note asymmetry factor (As), plate count (N), and backpressure.
- Perform By-Pass Test: Disconnect the column and connect a zero-dead-volume union in its place. Inject the test mix. Observe the baseline profile.
- Interpretation:
- Poor peaks only with column: Problem is column or mobile phase chemistry.
- Poor peaks in by-pass test: Problem is in LC system (injector, detector cell, or tubing).
- Column Cleaning (If Issue is Column): Flush sequentially with 10 column volumes each of: a) 90:10 Water:MeOH, b) 100% MeOH, c) 90:10 MeOH:Ethyl Acetate, d) 100% Ethyl Acetate, e) 100% MeOH, f) Starting mobile phase. Re-test.
Protocol 1.2: Investigating and Mitigating Retention Time Drift Objective: Identify source of instability in retention.
- Check Mobile Phase Preparation: Ensure accurate volumetric mixing, use HPLC-grade solvents, and fresh buffers (< 2 days for volatile ammonium salts, < 1 day for non-volatile salts like phosphate). Note pH precisely.
- Temperature Control: Verify column compartment temperature is stable (±0.5°C). Increase temperature to 40-45°C for better reproducibility.
- Column Equilibration: After gradient elution, re-equilibrate with initial conditions for at least 10 column volumes. Monitor pressure stability as indicator.
- Preventative Maintenance: Replace solvent inlet frits, purge seal wash lines, and check for leaks.
2.0 Understanding and Controlling Adduct Formation In ESI-MS, analytes (M) can form various gas-phase adducts with ions present in the solution or system. This is prevalent in plant extracts due to complex matrices.
Table 2: Common Adducts in Plant Metabolite LC-MS and Their Origins
| Adduct Ion | Typical m/z Shift | Common Source | Prevalence |
|---|---|---|---|
| [M+H]+ | +1.0078 | Proton from mobile phase (e.g., H2O, MeOH, FA) | Very High (Positive) |
| [M+Na]+ | +22.9898 | Sodium from glassware, buffers, or sample | High (Positive) |
| [M+K]+ | +38.9632 | Potassium from plant tissue, buffers | High (Positive) |
| [M+NH4]+ | +18.0338 | Ammonium from buffers (e.g., ammonium formate) | Medium (Positive) |
| [M+HCOOH-H]- | +44.9982 | Formate anion from mobile phase additive | High (Negative) |
| [M+CH3COOH-H]- | +59.0139 | Acetate anion from mobile phase additive | Medium (Negative) |
| [M+Cl]- | +34.9694 | Chloride from solvents, sample | Medium (Negative) |
Protocol 2.1: Diagnostic Experiment for Adduct Formation Objective: Determine the source of persistent adduct interference.
- Prepare Samples:
- A: Standard compound in pure MeOH/H2O.
- B: Standard compound spiked into a cleaned plant matrix extract.
- C: Original plant extract.
- Analyze with High-Resolution MS: Use a full-scan (e.g., m/z 100-1000) with data-dependent MS/MS.
- Data Analysis: For a target m/z, identify all potential adducts ([M+Na], [M+K], [M+NH4]). Check for consistent retention time across adduct forms of the same compound. Use software algorithms (e.g., "Find by Formula" or adduct grouping tools).
- Source Identification: Compare adduct patterns in Sample A vs. B. Increased alkali adducts in B indicate matrix origin. Ubiquitous adducts in A, B, C indicate systemic source (e.g., glassware, solvent impurities).
Protocol 2.2: Mitigation Strategies for Adduct Reduction Objective: Minimize non-protonated adducts to simplify spectra.
- Purge Alkali Ions:
- Sample Prep: Use LC-MS grade water and acids for extraction. Employ solid-phase extraction (SPE) with polymeric or C18 phases to remove salts.
- Mobile Phase: Use high-purity solvents (Optima LC-MS grade). Add volatile modifiers like 0.1% formic acid (positive mode) or 1mM ammonium fluoride (negative mode) to promote uniform [M+H]+ or [M-H]- formation.
- Hardware: Use polymer-based vials and tubing instead of glass for samples prone to leaching.
- Instrument Tuning: Optimize source parameters (e.g., higher fragmentor voltage or declustering potential) to dissociate weakly-bound adducts in the source region before they reach the mass analyzer.
- Data Processing: Apply adduct deconvolution algorithms during peak picking to group related ions and report the presumed neutral mass.
Workflow for LC-MS Troubleshooting
The Scientist's Toolkit: Key Research Reagent Solutions
| Item | Function & Rationale |
|---|---|
| LC-MS Grade Solvents | Minimal ionizable impurities to reduce chemical noise and unwanted adduct formation. |
| Volatile Buffers | Ammonium formate/acetate or formic/acetic acid. Provide pH control and evaporate in ESI source. |
| Polymeric SPE Cartridges | Clean-up plant extracts; remove salts, pigments, and lipids that cause ion suppression and adducts. |
| In-Line Filter (0.5µm) | Placed before column to trap particulates from crude extracts, protecting column frit. |
| Guard Column | Same phase as analytical column. Sacrificial cartridge to capture irreversible contaminants. |
| Polypropylene Vials/Tubes | Prevents leaching of alkali ions from glass, reducing [M+Na]+/[M+K]+ adducts. |
| Test Mix Standards | A cocktail of metabolites covering a polarity range for monitoring system performance and column health. |
| High-Purity Water | >18 MΩ.cm resistance, from a dedicated LC-MS system, to serve as a baseline for mobile phases. |
Application Notes and Protocols
Context: This document details critical data analysis procedures within a comprehensive LC-MS thesis protocol for the targeted and untargeted analysis of plant secondary metabolites (PSMs), including alkaloids, flavonoids, and terpenoids. Accurate deconvolution and peak integration are paramount for reliable quantification, compound identification, and subsequent biological interpretation in phytochemistry and drug discovery.
Table 1: Common Data Analysis Pitfalls and Quantitative Impact on PSM Analysis
| Pitfall | Typical Manifestation in LC-MS | Impact on Quantitative Data (e.g., Concentration, Relative Abundance) | Recommended Mitigation Strategy |
|---|---|---|---|
| Insufficient Chromatographic Resolution | Co-eluting peaks (Rt difference < 0.1 min) | Signal enhancement/suppression >20%; mis-identification. | Optimize gradient; Use UPLC/HPLC; Employ 2D-LC. |
| Inaccurate Baseline Definition | Incorrect baseline start/end points, curved baselines. | Integration error ranging from -15% to +50%. | Use algorithm testing (e.g., ApexTrack, LearnBaseline); Manual review. |
| Peak Tailoring & Shoulder Peaks | Unresolved shoulder peaks integrated as one. | Over/under-estimation of minor component by up to 80%. | Apply peak deconvolution algorithms (see Protocol 1). |
| Signal-to-Noise (S/N) Threshold Misuse | Low S/N (<3:1) peaks ignored; noise integrated as peak. | False negatives or overestimation of trace analytes. | Set S/N threshold at 10:1 for quantification; 3:1 for screening. |
| Isobaric & Isomeric Interference | Same m/z but different Rt or fragmentation patterns. | False positive identification; quantification error of co-eluting isomer. | Use high-res MS (HRMS); Implement MS/MS spectral deconvolution. |
Experimental Protocol 1: Deconvolution of Co-Eluting Peaks Using Spectral Unmixing
Objective: To accurately resolve and integrate overlapping chromatographic peaks for co-eluting PSMs using ion-specific extracted ion chromatograms (XICs) and mathematical deconvolution.
Materials & Software:
- LC-HRMS system (e.g., Q 2020-Exactive Plus, QTOF).
- Data analysis software with deconvolution tools (e.g., Compound Discoverer, MZmine 3, XCMS Online, MassHunter).
- Standard mixture of co-eluting PSMs (e.g., quercetin-3-O-rutinoside and kaempferol-3-O-glucoside).
Methodology:
- Data Acquisition: Inject the standard mixture and acquire data in full-scan mode (e.g., m/z 100-1500) with a data acquisition rate ≥ 10 Hz.
- Generate XICs: Extract ion chromatograms for the precursor m/z of each target compound with a narrow mass tolerance (e.g., ±5 ppm).
- Algorithm Selection: Apply a deconvolution algorithm (e.g., "Model Peak" in MZmine, "Find by Ion Chromatogram" in MassHunter).
- Set parameters: Noise level (determined from baseline), Minimum peak height (5x S/N), Peak duration range (e.g., 0.05-1.0 min).
- Enable "Deconvolve overlapping signals" or "Spectral deconvolution" option.
- Spectral Contrast: The algorithm uses unique fragment ions or adduct patterns from the MS1 or MS2 spectra within the overlapping region to apportion the total signal.
- Validation: Compare deconvoluted peak areas with those from individually injected standards to calculate accuracy (target: >90% recovery).
- Integration: Integrate the deconvoluted peaks using the Apex-Tracker algorithm with baseline drawn from valley point to valley point.
Experimental Protocol 2: Systematic Workflow for Accurate Peak Integration in Untargeted PSM Analysis
Objective: To establish a reproducible, semi-automated workflow for peak picking, alignment, and integration across multiple LC-MS runs of plant extracts.
Methodology:
- Data Preparation: Convert raw files to open format (.mzML).
- Noise Estimation & Peak Picking (MZmine 3 Example):
- Mass detection: Use exact mass detector. Noise level: 1.0E3.
- Chromatogram builder: Min time span: 0.02 min; Min height: 5.0E3; m/z tolerance: 5 ppm.
- Chromatographic deconvolution: Use "Local minimum resolver" algorithm.
Chromatographic threshold: 80%Search minimum in RT range: 0.1 minMinimum relative height: 5%Minimum absolute height: 1.0E3Min ratio of peak top/edge: 2
- Isotopic Peak Grouping & Alignment: Group peaks across samples using RT (0.1 min tolerance) and m/z (5 ppm tolerance). Align to a reference sample.
- Gap Filling: Fill in missing peaks using peak detection on raw data.
- Manual Curation & Baseline Correction:
- Visually inspect integrated peaks for top 200 features by abundance.
- For incorrect baselines, apply a manual "Set Baseline" tool, anchoring baseline start/end points in signal-free regions.
- Flag and re-integrate peaks with poor shape (Asymmetry factor >1.5).
- Export Data Matrix: Export final peak area table (samples x features) for statistical analysis.
Visualization 1: LC-MS Data Analysis Workflow
Diagram Title: LC-MS Data Analysis Workflow for PSMs
Visualization 2: Spectral Deconvolution Logic
Diagram Title: Spectral Deconvolution of Overlapping Peaks
The Scientist's Toolkit: Key Research Reagent Solutions & Materials
| Item | Function in PSM LC-MS Analysis |
|---|---|
| UPLC/HPLC Columns (C18, phenyl-hexyl) | Core separation component; choice dictates selectivity and resolution for different PSM classes (polar flavonoids vs. non-polar terpenes). |
| Mass Spectrometry Reference Standards | Essential for calibration curves (quantification), verifying retention times, and optimizing/confirming MS/MS fragmentation patterns. |
| Deuterated Internal Standards (e.g., Quercetin-d3) | Correct for matrix effects and variability in extraction, injection, and ionization; critical for precise quantification. |
| Quality Control (QC) Pool Sample | Pooled aliquot of all study samples; injected repeatedly to monitor system stability, reproducibility, and for data normalization in untargeted studies. |
| Blank Solvents (LC-MS Grade ACN, MeOH, Water) | Minimize background noise and contamination; essential for maintaining instrument sensitivity and detecting trace-level metabolites. |
| Data Analysis Software (e.g., MZmine, Compound Discoverer) | Platforms enabling the workflows described; must include peak detection, deconvolution, alignment, and statistical analysis modules. |
Ensuring Reliability: Method Validation, Compound Identification, and Technique Comparison
In the context of developing robust LC-MS protocols for plant secondary metabolite research, method validation is paramount. Accurate quantification of compounds like alkaloids, flavonoids, and terpenoids is essential for pharmacological activity assessment, biosynthetic studies, and quality control in phytopharmaceutical development. This article details the core validation parameters—linearity, limits of detection (LOD) and quantification (LOQ), precision, and accuracy—with specific application notes for plant metabolite analysis.
Linearity and Range
Protocol: Establishing Calibration Curve Linearity
- Standard Preparation: Prepare a stock solution of the purified target metabolite (e.g., berberine, quercetin) in a suitable solvent (e.g., methanol). Serially dilute to a minimum of six concentration levels across the expected range in the sample matrix (e.g., blank plant extract).
- LC-MS Analysis: Inject each calibration level in triplicate. Use a consistent chromatographic method (e.g., C18 column, gradient elution with water/acetonitrile + 0.1% formic acid) and MS detection in Selected Ion Monitoring (SIM) or Multiple Reaction Monitoring (MRM) mode.
- Data Analysis: Plot the mean peak area (or peak area ratio to internal standard) against the nominal concentration. Perform least-squares linear regression. Calculate the correlation coefficient (r), slope, and y-intercept.
- Acceptance Criteria: For quantitative bioanalysis, r ≥ 0.990 is typically required. The residuals should be randomly scattered around zero.
Table 1: Example Linearity Data for Quercetin in Ginkgo biloba Extract
| Nominal Concentration (ng/mL) | Mean Peak Area (n=3) | Standard Deviation | Residual (%) |
|---|---|---|---|
| 5 | 12540 | 450 | -2.1 |
| 10 | 29850 | 890 | 1.3 |
| 50 | 147800 | 3200 | 0.8 |
| 100 | 305500 | 7500 | -1.5 |
| 500 | 1,520,000 | 45000 | 1.0 |
| 1000 | 3,010,000 | 92000 | 0.5 |
| Regression Results | Value | ||
| Correlation Coefficient (r) | 0.9992 | ||
| Slope | 3015 | ||
| Y-Intercept | -850 |
Limits of Detection (LOD) and Quantification (LOQ)
Protocol: Determining LOD and LOQ via Signal-to-Noise Ratio
- Analysis of Low-Level Standards: Analyze progressively lower concentrations of the analyte.
- Signal-to-Noise Measurement: In the chromatogram, measure the peak height (H) of the analyte and the peak-to-peak noise (N) in a blank sample region close to the analyte's retention time.
- Calculation:
- LOD: Concentration yielding S/N ≈ 3.
- LOQ: Concentration yielding S/N ≈ 10. Alternatively, LOQ can be defined as the lowest concentration on the calibration curve with precision (RSD) ≤ 20% and accuracy (80-120%).
Table 2: LOD and LOQ for Selected Alkaloids in Catharanthus roseus Extract
| Metabolite (Alkaloid) | LOD (ng/mL) | LOQ (ng/mL) | MS Detection Mode |
|---|---|---|---|
| Vincristine | 0.05 | 0.15 | MRM |
| Vinblastine | 0.08 | 0.25 | MRM |
| Ajmalicine | 0.20 | 0.60 | SIM |
Precision
Protocol: Assessing Intra-day and Inter-day Precision
- Sample Preparation: Prepare QC samples at three concentrations (low, mid, high) within the calibration range using spiked blank matrix.
- Intra-day Precision: Analyze six replicates of each QC level in a single analytical run. Calculate the mean, standard deviation (SD), and relative standard deviation (RSD%).
- Inter-day Precision: Analyze three replicates of each QC level on three separate days. Calculate the overall mean, SD, and RSD%.
- Acceptance Criteria: For bioanalytical methods, RSD for intra-day precision should be ≤ 15% (≤ 20% at LOQ), and inter-day precision RSD should be ≤ 15%.
Table 3: Precision Data for Resveratrol Quantification in Polygonum cuspidatum
| QC Level | Nominal Conc. (µg/mL) | Intra-day (n=6) | Inter-day (n=3x3) | ||
|---|---|---|---|---|---|
| Mean ± SD (µg/mL) | RSD% | Mean ± SD (µg/mL) | RSD% | ||
| Low | 1.0 | 0.97 ± 0.08 | 8.2 | 0.99 ± 0.09 | 9.1 |
| Medium | 10.0 | 9.88 ± 0.45 | 4.6 | 10.1 ± 0.52 | 5.1 |
| High | 80.0 | 81.2 ± 2.8 | 3.4 | 79.8 ± 3.5 | 4.4 |
Accuracy (Recovery)
Protocol: Determining Accuracy via Spike Recovery
- Sample Spiking: Take a known amount of blank plant matrix. Spike with the target analyte at three QC levels (low, mid, high) prior to extraction (n=5 per level).
- Extraction and Analysis: Process the spiked samples through the entire analytical method (extraction, cleanup, LC-MS).
- Calculation: Calculate the percentage recovery for each level.
- Recovery (%) = (Measured Concentration / Spiked Concentration) × 100.
- Acceptance Criteria: Mean recovery should be within 85-115% for most concentration levels.
Table 4: Accuracy (Recovery) for Curcuminoids in Curcuma longa Rhizome Extract
| Spike Level | Spiked Amount (mg/g) | Mean Recovered Amount (mg/g) ± SD | Recovery (%) | RSD% |
|---|---|---|---|---|
| Low | 0.50 | 0.47 ± 0.04 | 94.0 | 8.5 |
| Medium | 2.50 | 2.45 ± 0.12 | 98.0 | 4.9 |
| High | 10.00 | 10.3 ± 0.41 | 103.0 | 4.0 |
The Scientist's Toolkit: Key Research Reagent Solutions
Table 5: Essential Materials for LC-MS Validation of Plant Metabolites
| Item | Function & Explanation |
|---|---|
| Certified Reference Standards | High-purity, characterized plant metabolites (e.g., from ChromaDex, Sigma-Aldrich) for preparing calibration curves and QC samples. Essential for defining linearity and accuracy. |
| Stable Isotope-Labeled Internal Standards (SIL-IS) | e.g., ^13^C- or ^2^H-labeled analogs of the target analyte. Added at the start of extraction to correct for matrix effects and recovery losses, significantly improving precision and accuracy. |
| LC-MS Grade Solvents | Acetonitrile, methanol, water with ultra-low volatility and UV absorbance. Critical for maintaining low background noise, ensuring consistent ionization, and preventing instrument contamination. |
| Additives for Mobile Phase | Formic acid, ammonium formate/acetate. Enhance analyte protonation/deprotonation in ESI, improve chromatographic peak shape, and control pH for reproducibility. |
| Solid-Phase Extraction (SPE) Cartridges | C18, HLB, or mixed-mode sorbents. Used for sample cleanup and pre-concentration of metabolites from complex plant extracts, reducing matrix effects and improving LOD/LOQ. |
| Appropriate Analytical Column | e.g., C18, phenyl-hexyl, or HILIC columns (50-100mm, sub-2µm or core-shell particles). Provides the necessary chromatographic resolution for separating structurally similar secondary metabolites. |
Experimental Workflow and Logical Relationships
Diagram Title: LC-MS Validation Parameter Workflow for Plant Metabolites
Diagram Title: Interdependence of LC-MS Validation Parameters
Within the broader thesis on developing robust LC-MS protocols for plant secondary metabolites research, the confident identification of detected compounds remains the paramount challenge. This document outlines an integrated, multi-tiered strategy leveraging chemical standards, tandem mass spectrometry (MS/MS) libraries, and high-resolution mass spectrometry (HRMS) data to achieve confident metabolite identification, adhering to the Metabolomics Standards Initiative (MSI) confidence levels.
Tiered Identification Strategy and Data Requirements
Table 1: Confidence Levels for Metabolite Identification (Based on MSI Guidelines)
| Confidence Level | Identification Evidence Required | Typical Tools & Data |
|---|---|---|
| Level 1 (Confirmed Structure) | Comparison with authentic chemical standard analyzed under identical analytical conditions. | Retention time (RT), accurate mass, MS/MS spectrum, isotopic pattern. |
| Level 2 (Probable Structure) | Match to literature or library spectral data without RT match from standard. | Accurate mass match (< 5 ppm error), MS/MS spectral similarity (e.g., dot product > 0.8). |
| Level 3 (Tentative Candidate) | Characteristic physicochemical properties or spectral similarity to compound classes. | Accurate mass, predicted elemental formula, diagnostic fragments/neutral losses. |
| Level 4 (Unknown) | Distinct molecular signal but insufficient evidence for characterization. | Accurate mass only (or m/z feature). |
Detailed Experimental Protocols
Protocol 1: Identification Using Authentic Chemical Standards
Objective: Achieve Level 1 identification by matching RT, accurate mass, and MS/MS fragmentation.
- LC-HRMS/MS System Setup: Use a UHPLC system coupled to a Q-TOF or Orbitrap mass spectrometer.
- Standard Solution Preparation: Prepare a series of dilutions (e.g., 0.1, 1, 10 µg/mL) of the authentic standard in appropriate solvent (e.g., 50% methanol).
- Chromatographic Separation: Inject standard and sample using identical method (e.g., C18 column, 35°C, water/acetonitrile + 0.1% formic acid gradient).
- Data Acquisition:
- Full-scan MS in positive/negative mode (resolving power ≥ 35,000 FWHM).
- Data-Dependent Acquisition (DDA): Top N most intense ions per cycle fragmented with stepped normalized collision energy (e.g., 20, 40, 60 eV).
- Data Analysis:
- Align RT of standard peak with sample feature (acceptable tolerance: ± 0.1 min).
- Confirm accurate mass match (mass error < 3 ppm).
- Compare MS/MS spectra using spectral similarity scoring.
Protocol 2: Library-Based MS/MS Matching (Level 2 Identification)
Objective: Assign probable structure by matching experimental MS/MS spectrum to reference spectra.
- Library Curation: Use and/or combine public libraries (MoNA, MassBank, GNPS) and commercial libraries (e.g., NIST MS/MS).
- Data Acquisition: Generate high-quality MS/MS spectra for the unknown feature from the sample using Protocol 1, Step 4.
- Spectral Matching:
- Process raw spectra: background subtract, normalize to base peak.
- Search processed spectrum against library using algorithms like dot product (cosine similarity) or modified cosine score.
- Apply thresholds: Forward dot product > 0.7, reverse dot product > 0.8, mass error < 10 ppm for precursor ion.
- Manual Verification: Inspect top matches for logical fragment ions and neutral losses consistent with candidate structure.
Protocol 3: HRMS-Based Formula Generation & In-Silico Fragmentation (Level 3 Identification)
Objective: Propose tentative candidates when no library match is found.
- Elemental Formula Determination:
- Extract accurate m/z of precursor ion.
- Use software (e.g., Compound Discoverer, XCMS Online) to generate possible formulas based on mass error (< 3 ppm), isotopic pattern fit (mSigma < 20), and heuristic rules (e.g., N, S, P atom counts).
- In-Silico Fragmentation:
- Input candidate formula or structure (from databases like PubChem, ChemSpider) into tools such as CFM-ID, MS-FINDER, or SIRIUS.
- Compare in-silico predicted fragments with experimental MS/MS spectrum.
- Biological Context: Cross-reference candidate formulas with metabolic pathways relevant to the plant species under study.
The Scientist's Toolkit
Table 2: Essential Research Reagent Solutions & Materials
| Item | Function & Application |
|---|---|
| Authentic Chemical Standards | Provide definitive RT and spectral benchmarks for Level 1 identification. Used for calibration curves and spiking experiments. |
| Stable Isotope-Labeled Internal Standards (SIL-IS) | Correct for matrix effects and ionization variability during quantification; aid in confirming identifications via characteristic isotopic clusters. |
| LC-MS Grade Solvents (MeCN, MeOH, Water) | Ensure minimal background noise, prevent system contamination, and provide reproducible chromatography. |
| Volatile Additives (Formic Acid, Ammonium Acetate) | Modify mobile phase pH to enhance ionization efficiency in ESI positive or negative mode. |
| C18 UHPLC Column (e.g., 2.1 x 100 mm, 1.7-1.8 µm) | Provide high-efficiency separation of complex plant metabolite extracts. |
| Solid Phase Extraction (SPE) Cartridges (C18, HILIC) | Clean-up and fractionate crude plant extracts to reduce matrix complexity and ion suppression. |
| MS/MS Spectral Libraries (Commercial & Public) | Reference databases for spectral matching to achieve Level 2 identifications. |
| Software with Deconvolution Tools (e.g., MZmine, MS-DIAL) | Process raw HRMS data: detect features, align peaks across samples, integrate signals, and export data for statistical analysis. |
Visualized Workflows
Title: Tiered Metabolite ID Workflow from LC-HRMS/MS Data
Title: Steps for Confirmed ID with a Standard
This application note is a component of a broader thesis focused on developing robust LC-MS protocols for the comprehensive analysis of plant secondary metabolites. The selection of an appropriate analytical platform is critical for research in phytochemistry, natural products discovery, and drug development from plant sources. This document provides a comparative analysis of three cornerstone techniques—Liquid Chromatography-Mass Spectrometry (LC-MS), Gas Chromatography-Mass Spectrometry (GC-MS), and Nuclear Magnetic Resonance (NMR) Spectroscopy—detailing their respective strengths, limitations, and optimal application scenarios. Included are detailed protocols to guide researchers in implementing these techniques for targeted and untargeted phytochemical analysis.
Table 1: Core Comparative Analysis of LC-MS, GC-MS, and NMR for Phytochemical Analysis
| Feature | LC-MS | GC-MS | NMR |
|---|---|---|---|
| Analyte Suitability | Non-volatile, thermally labile, polar to mid-polar compounds (e.g., flavonoids, alkaloids, glycosides, saponins). | Volatile, thermally stable, non-polar to mid-polar compounds (e.g., essential oils, terpenes, fatty acids, steroids). Requires derivatization for polar compounds. | All organic compounds, regardless of volatility or thermal stability. Provides structural information on complex, novel compounds. |
| Sensitivity | High (fg-pg on-column for MS/MS). Excellent for trace analysis in complex matrices. | High (fg-pg). | Low (µg-mg). Requires significant amounts of purified compound. |
| Identification Power | High via accurate mass (HRMS) and fragmentation patterns (MS/MS). Depends on library spectra for unknowns. | High via mass spectral libraries (EI). Excellent for known volatile compounds. | Definitive. Elucidates complete planar and stereochemical structure without reference standards. |
| Quantitation | Excellent. Broad dynamic range. Relies on reference standards for absolute quantitation. | Excellent. Robust and reproducible. | Possible but less common for complex mixtures. Requires careful method development. |
| Sample Throughput | High for screening. Analysis times 10-30 mins. | High. Analysis times 5-20 mins. | Low. Acquisition times from minutes to hours per sample. |
| Sample Preparation | Moderate (extraction, filtration, dilution). Can often analyze crude extracts. | Can be complex, often requires derivatization (e.g., silylation, methylation). | Can be extensive. Typically requires isolation of pure compounds or fractionation for mixture analysis. |
| Key Limitation | Cannot provide definitive structural elucidation of completely unknown compounds; isomer differentiation can be challenging. | Limited to volatile or derivatizable compounds; thermal degradation possible. | Low sensitivity; requires high sample quantity/purity; expensive instrumentation and maintenance. |
| Key Strength | Versatile, sensitive, and ideal for profiling complex, polar extracts typical in plant metabolomics. | Gold standard for volatile organic compounds; highly reproducible spectral libraries. | Gold standard for de novo structural elucidation and stereochemistry determination. Non-destructive. |
Table 2: Typical Performance Metrics for Phytochemical Analysis
| Parameter | LC-MS (ESI-QTOF) | GC-MS (EI-Quadrupole) | NMR (600 MHz) |
|---|---|---|---|
| Mass Accuracy | < 5 ppm | N/A (Unit mass) | N/A |
| Resolution (MS) | 20,000 - 60,000 | Unit Mass (R ~ 2,000) | N/A |
| Spectral Resolution | N/A | N/A | < 1 Hz |
| Dynamic Range | Up to 10^5 | Up to 10^5 | ~ 10^2 |
| Sample Amount Needed | ng - µg | ng - µg | µg - mg (10s of µg for cryoprobes) |
| Analysis Time per Sample | 10 - 30 min | 5 - 20 min | 5 min - several hours |
Detailed Application Protocols
Protocol: Untargeted Phytochemical Profiling of a Plant Extract via LC-HRMS
Objective: To acquire comprehensive metabolite profile data from a crude plant extract for fingerprinting and putative identification.
Workflow:
Title: LC-HRMS Untargeted Profiling Workflow
Materials & Reagents:
- Extraction Solvent: Methanol/Water (80:20, v/v) with 0.1% Formic Acid.
- LC Mobile Phase A: Water with 0.1% Formic Acid.
- LC Mobile Phase B: Acetonitrile with 0.1% Formic Acid.
- Column: Reversed-phase C18 column (e.g., 2.1 x 100 mm, 1.7-1.8 µm).
- Internal Standards: Stable isotope-labeled compounds (e.g., d4-Succinic acid) for QC.
Procedure:
- Sample Preparation: Homogenize 50 mg of freeze-dried plant powder with 1 mL of cold 80% methanol. Sonicate for 15 min in an ice bath, then centrifuge at 14,000 x g for 10 min at 4°C. Filter supernatant through a 0.22 µm PTFE or nylon membrane.
- LC Conditions: Column temperature: 40°C. Flow rate: 0.3 mL/min. Gradient: 5% B to 95% B over 25 min, hold 5 min, re-equilibrate.
- HRMS Conditions (ESI-QTOF): Ionization: ESI positive and negative modes. Scan range: m/z 50-1200. Collision energy: Ramped (e.g., 10-40 eV) for Data-Dependent Acquisition (DDA) or fixed for Data-Independent Acquisition (DIA).
- QC: Inject pooled sample (QC) at start and periodically throughout the run to monitor system stability.
- Data Analysis: Use software (e.g., MS-DIAL, XCMS, Compound Discoverer) for peak picking, alignment, and deconvolution. Annotate using accurate mass (± 5 ppm), isotopic pattern, and MS/MS against databases (e.g., GNPS, MassBank, in-house libraries).
Protocol: Essential Oil Analysis via GC-MS
Objective: To identify and quantify volatile constituents in a plant essential oil.
Workflow:
Title: GC-MS Essential Oil Analysis Workflow
Materials & Reagents:
- Carrier Gas: Helium (He), purity >99.999%.
- Derivatization Reagent (if needed): N,O-Bis(trimethylsilyl)trifluoroacetamide (BSTFA) with 1% TMCS.
- Solvent for dilution: Hexane or Methyl tert-butyl ether (MTBE).
- Column: Fused-silica capillary column (e.g., 5% phenyl polysiloxane, 30 m x 0.25 mm, 0.25 µm film).
- Internal Standard: Alkane mix (for RI) or specific compound (e.g., nonane for quantitation).
Procedure:
- Sample Preparation: Dilute 10 µL of essential oil in 1 mL of hexane. For non-volatile acids/phenols, derivative by mixing 50 µL sample with 100 µL BSTFA, heat at 70°C for 30 min.
- GC Conditions: Injector temp: 250°C (split mode, split ratio 50:1). Oven program: 50°C hold 2 min, ramp 5°C/min to 280°C, hold 5 min.
- MS Conditions (EI-Quadrupole): Ion source temp: 230°C. Electron energy: 70 eV. Scan range: m/z 35-500.
- Identification: Compare acquired mass spectra to NIST/Adams libraries. Confirm matches using calculated Retention Index (RI) relative to alkane series vs. published RI values.
- Quantification: Report as relative percentage of total ion chromatogram (TIC) area or use calibration curves of authentic standards for absolute quantification of key compounds.
Protocol: Structural Elucidation of a Purified Compound via NMR
Objective: To determine the complete chemical structure (including stereochemistry) of an isolated phytochemical.
Workflow:
Title: NMR Structure Elucidation Workflow
Materials & Reagents:
- Deuterated Solvents: Chloroform-d (CDCl3), Methanol-d4 (CD3OD), Dimethyl sulfoxide-d6 (DMSO-d6).
- NMR Tube: 5 mm high-quality NMR tube.
- Internal Reference: Tetramethylsilane (TMS, 0.0 ppm) or residual solvent peak.
Procedure:
- Sample Preparation: Dissolve 1-5 mg of the purified compound in 0.6 mL of appropriate deuterated solvent. Transfer to a 5 mm NMR tube.
- 1D NMR:
- ¹H NMR: Acquire with sufficient scans for S/N > 100:1. Set spectral width (e.g., 12 ppm), relaxation delay (D1 > 5*T1).
- ¹³C NMR: Acquire using inverse-gated decoupling to avoid NOE, with many scans (1000s) due to low sensitivity.
- DEPT-135/90: To determine CH, CH2, CH3 multiplicities.
- 2D NMR:
- COSY: Identifies scalar-coupled (²,³JHH) proton networks.
- HSQC: Correlates directly bonded ¹H and ¹³C nuclei (¹JCH).
- HMBC: Correlates long-range coupled ¹H and ¹³C nuclei (²,³JCH), crucial for linking structural fragments.
- NOESY/ROESY: Provides through-space correlations to determine relative stereochemistry and conformation.
- Processing & Interpretation: Process all data (Fourier transform, phase, baseline correct). Assign all ¹H and ¹³C signals sequentially using the 2D correlation data. Compare chemical shifts and coupling constants with literature data for known analogues.
The Scientist's Toolkit: Essential Reagents and Materials
Table 3: Key Research Reagent Solutions for Phytochemical Analysis
| Category | Item | Function in Analysis |
|---|---|---|
| Sample Prep & LC-MS | Methanol (LC-MS Grade) | Primary extraction solvent for polar metabolites; minimizes background ions in MS. |
| Formic Acid (Optima Grade) | Mobile phase additive (0.1%) to improve protonation and peak shape in positive ESI. | |
| Ammonium Acetate / Formate | Volatile buffer salts for mobile phase to control pH and improve ion formation. | |
| Solid Phase Extraction (SPE) Cartridges (C18, HLB) | Clean-up and fractionation of crude extracts to reduce matrix effects. | |
| GC-MS | N-Methyl-N-(trimethylsilyl) trifluoroacetamide (MSTFA) | Common silylation derivatizing agent for polar functional groups (-OH, -COOH). |
| Alkane Standard Solution (C8-C40) | For precise calculation of Retention Indices (RI) for compound identification. | |
| Restek Rxi-5Sil MS Column | Popular 5% diphenyl / 95% dimethyl polysiloxane GC column for general metabolomics. | |
| NMR | Deuterated Solvents (CDCl3, DMSO-d6) | Provides a locking signal for the spectrometer and minimizes solvent proton interference. |
| Shift Reagents (e.g., Eu(fod)3) | Lanthanide complexes used to induce predictable chemical shift changes for stereochemistry. | |
| Susceptibility-Matched NMR Tubes (Shigemi) | Allows for smaller sample volumes in standard 5 mm probes, maximizing concentration. | |
| General | Quercetin / Rosmarinic Acid Std. | Common secondary metabolite reference standards for LC-MS method validation. |
| Stable Isotope Internal Standards (13C, 2H) | For absolute quantification and correction for matrix effects and recovery losses. |
Application Note & Protocol
1. Introduction within LC-MS Research Thesis Context Advancements in Liquid Chromatography-Mass Spectrometry (LC-MS) instrumentation and data processing are central to modern plant metabolomics. This application note, framed within a broader thesis on optimizing LC-MS protocols for plant secondary metabolites, presents case studies benchmarking new methods for profiling two critical compound classes: flavonoids and alkaloids. We evaluate cutting-edge techniques against established standards, focusing on sensitivity, coverage, and throughput for drug discovery and phytochemical research.
2. Case Study 1: Ion Mobility-Enabled LC-HRMS for Flavonoid Isomers
- Challenge: Differentiating flavonoid glycoside and aglycone isomers with identical mass but distinct biological activities.
- Benchmarked Method: Ultra-High-Performance Liquid Chromatography coupled with High-Resolution Mass Spectrometry and Trapped Ion Mobility Spectrometry (UHPLC-HRMS-TIMS).
- Protocol: UHPLC-HRMS-TIMS for Flavonoid Separation
- Sample Prep: Homogenize 50 mg of dried plant material (e.g., Ginkgo biloba leaf) in 1 mL of 80% methanol/water. Sonicate (15 min), centrifuge (15,000 × g, 10 min, 4°C), filter (0.22 µm PTFE), and dilute 1:10 with mobile phase A.
- Chromatography:
- Column: C18 reverse-phase (2.1 x 100 mm, 1.7 µm).
- Mobile Phase A: 0.1% Formic acid in water.
- Mobile Phase B: 0.1% Formic acid in acetonitrile.
- Gradient: 5% B to 95% B over 18 min.
- Flow Rate: 0.4 mL/min. Column Temp: 40°C.
- Mass Spectrometry & Ion Mobility:
- Platform: Q-TOF with TIMS device.
- Ionization: Electrospray Ionization (ESI), negative mode.
- MS Scan: m/z 150-1500.
- TIMS Parameters: Ramp accumulation time 100 ms; Nitrogen as drift gas.
- Collision-Induced Dissociation (CID): Applied for MS/MS identification.
- Data Analysis: Use vendor software to extract Collision Cross-Section (CCS) values. Align CCS with fragmentation patterns in libraries (e.g., MoNA, in-house).
3. Case Study 2: LC-MS/MS with MRM³ for Targeted Alkaloid Quantitation
- Challenge: Achieving ultra-sensitive, specific quantification of low-abundance toxic alkaloids (e.g., pyrrolizidine alkaloids) in complex matrices.
- Benchmarked Method: Triple Quadrupole LC-MS/MS with Enhanced Product Ion Scanning and Third-Stage Mass Filtering (MRM³).
- Protocol: LC-MS/MS (MRM³) for Trace Alkaloid Quantification
- Sample Prep & SPE Clean-up: Extract 100 mg powdered herb with 5 mL of 2% formic acid in 50% methanol. Vortex, centrifuge. Load supernatant onto a mixed-mode cation-exchange SPE cartridge (pre-conditioned). Wash, elute with 5% ammonia in methanol. Evaporate, reconstitute in 100 µL mobile phase A.
- Chromatography: As in Section 2, but using a phenyl-hexyl column for improved aromatic selectivity. Gradient: 10% B to 100% B over 12 min.
- Mass Spectrometry (MRM³):
- Platform: Triple quadrupole mass spectrometer.
- Ionization: ESI positive mode.
- Primary MRM Transition: Optimize Q1 and Q3 for protonated parent > characteristic product ion.
- MRM³ Activation: Isolate primary product ion in Q2, fragment further in the collision cell (Q2), and monitor a specific tertiary fragment in Q3.
- Quantitation: Use a 6-point internal standard calibration curve (e.g., deuterated alkaloids). Inject in randomized order.
4. Benchmarking Data Summary
Table 1: Performance Comparison of Profiling Methods
| Metric | Established LC-MS/MS (MRM) | New LC-HRMS (DIA) | New LC-HRMS-TIMS | New LC-MS/MS (MRM³) |
|---|---|---|---|---|
| Application | Targeted Alkaloid Quant. | Untargeted Flavonoid Profiling | Isomeric Flavonoid Separation | Trace Alkaloid Quant. |
| Precision (CV%) | < 5% | 8-12% (post-alignment) | 5-8% (CCS) | < 3% |
| Sensitivity (LOD) | ~ 0.1 ng/mL | ~ 1 ng/mL (in full scan) | ~ 5 ng/mL | ~ 0.01 ng/mL |
| Identifications | Limited to targets | 50% more flavonoid features | 2x more isomers resolved | Confirmed specificity |
| Throughput | High (10 min run) | Medium (20 min + long processing) | Medium-Low (25 min run) | High (12 min run) |
| Key Advantage | Robust quantitation | Comprehensive discovery | Structural confidence | Ultimate selectivity |
Table 2: Key Research Reagent Solutions
| Reagent / Material | Function & Rationale |
|---|---|
| Mixed-mode Cation Exchange SPE Cartridge | Selective clean-up and concentration of basic alkaloids from plant extracts, reducing ion suppression. |
| Deuterated Internal Standards (e.g., D5-nicotine, D3-quinine) | Compensates for matrix effects and losses during sample preparation, ensuring quantification accuracy. |
| Formic Acid (LC-MS Grade) | Mobile phase additive to promote [M+H]+ ionization in positive mode and improve chromatographic peak shape. |
| Commercial CCS Library (e.g., AllCCS) | Provides experimental Collision Cross-Section values for metabolite identification confidence via TIMS. |
| Hypergrade Solvents (ACN, MeOH) | Minimizes background noise and system contamination, crucial for high-sensitivity detection. |
| Phenyl-Hexyl LC Column | Provides π-π interactions for improved separation of planar aromatic flavonoids and alkaloids vs. standard C18. |
5. Visualized Workflows & Pathways
Diagram 1: LC-TIMS-HRMS Workflow for Flavonoids
Diagram 2: MRM³ Specificity Logic on Triple Quad
Diagram 3: Method Selection Decision Tree
Conclusion
This comprehensive guide synthesizes the critical steps for successful LC-MS analysis of plant secondary metabolites, from foundational knowledge and meticulous method development to advanced troubleshooting and rigorous validation. The integration of robust protocols is paramount for generating reliable, reproducible data essential for phytochemical discovery, chemotaxonomy, and the development of plant-based therapeutics. Future directions point toward increased automation, the integration of multi-omics data, and the application of AI-driven data processing to uncover novel bioactive compounds and elucidate complex biosynthetic pathways, thereby accelerating drug discovery from natural sources.